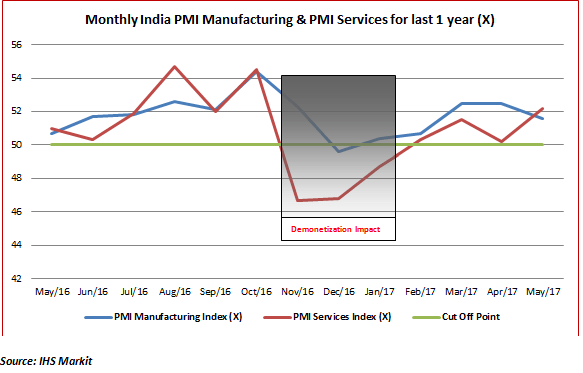
The PMI manufacturing and the PMI services for the month of May have stayed above the 50-mark indicating that both are still in expansion mode. For the month of May, while services showed a positive momentum, manufacturing showed a negative momentum. But then, as the chart below depicts, the services sector also witnessed a much sharper correction in the aftermath of demonetization. Here are the key PMI highlights…

PMI manufacturing and PMI services are two key measures of whether the manufacturing and service sector are expanding or not. The 50-mark is considered to be the cut-off for PMI. A level of over 50 indicates that the economic activity is expanding while a level of below 50 indicates that the economic activity is contracting. There is also a composite PMI which combines the manufacturing and services PMI, but that is not too indicative and hence it is always better to use the two PMIs individually. The above chart captures the manufacturing and services PMI on a monthly basis for the last 1 year. The actual contraction came after the demonetization announcement in November as most factories had to put off their production and inventory build-up due to a shortage of liquidity in the system. With remonetization commencing from January 2017, the trend is clearly indicative of a pick-up in PMI manufacturing and services, although it continues to be volatile.
How PMI-Manufacturing for the month of May 2017 shaped up…
PMI manufacturing for the month of May 2017 came in at 51.6 as compared to 52.5 for the month of May. During the month there was a sharp acceleration in purchases by purchase managers of Indian companies which shows a high level of optimism. The growth in purchases was also spurred by the fact that input costs were moving up at the slowest rate in the last 7 months. However, while purchases showed an optimistic streak, the growth in output was at a 3-month low. New orders were also slow during the month of May so the sharp increase in purchases may be indicative of optimism of a pick-up in the coming months.
On the inventories front, the stocks of inputs increased which can be explained by the optimism among purchasing managers. However, there was a sharp fall in the inventory of finished goods. This can be an outcome of two factors. Firstly, production may have been deliberately kept low, as is evident from the core sector numbers and that could have led to a sharper depletion of the finished goods inventory. Secondly, many companies are even offering discounts to hive off their inventory ahead of the GST launch on July 01st. That could possibly explain the reduction in finished goods inventory. So out of the four key factors influencing Manufacturing PMI, the purchases and inventory showed a positive trend whereas new orders and production showed a weak trend. There was also a weak trend visible in demand for capital goods which may imply that the much-anticipated revival in the capital cycle could get further back-ended.
While the PMI-manufacturing stays above the 50-mark, the slower pick-up in orders and production is a signal of weakening momentum compared to the previous month. Based on the optimism of purchasing managers, one can logically expect the PMI-Manufacturing to pick up in the coming months. That could be the important take-away from the PMI numbers.
How the Services PMI panned out for May 2017…
It may be recollected, and the chart also testifies, that the sharp impact of the demonetization was felt most by the PMI services and even the lag effect was much longer in case of services than the case of manufacturing. The PMI Services for May 2017 recovered sharply to 52.2 from a level of 50.2 in the month of April. This clearly shows positive momentum on a MOM basis. Normally, for the services sector, the improvement in jobs created is the best indicator of optimism and that is visible in the month of May.
The big positive is that there is a genuine pick-up in new business in services which is an indication of a pick-up in underlying demand. In fact, while factory jobs fell in the manufacturing space, the service jobs expanded at the fastest pace in 4 years. However, unlike the manufacturing sector, the services saw a spurt in their input costs since their principal cost inputs are fuel and transport and both are susceptible to the movement in global crude prices. Despite the glut in production of crude oil globally, the prices have remained firm as the OPEC has tried hard to restrict supply to hold prices. This has led a rise in input costs for service companies.
When one compares the manufacturing and the services sector, there appears to be more optimism in the services sector as it is also taking in more workers. In the services sector this is the most affirmative indication of a pick-up in sentiments. Normally, the services sector is a lead indicator for the manufacturing sector and it looks like the optimism in the PMI-Services could soon get transmitted to the PMI-Manufacturing. For that, of course, a genuine pick-up in demand will be essential!
Published on: Jun 15, 2017, 12:00 AM IST
We're Live on WhatsApp! Join our channel for market insights & updates
