
Did you know that the U.S. stock market and India’s NSE are worlds apart in many ways? Join us as we uncover fascinating insights, including a jaw-dropping revelation about one tech giant’s daily trade that could leave you wide-eyed.
The National Stock Exchange of India (NSE) has established a near-monopoly in equity Futures and Options (F&O) trading, with over two-thirds of its trading revenue now stemming from this segment, marking a significant shift from the pre-pandemic 25-30% level.
Over the past three years, NSE has reigned as the largest exchange globally in terms of the number of F&O contracts traded. The equity F&O segment saw a remarkable 500% surge in individual traders during FY22, reaching 4.5 million, although 90% of them experienced net losses.
Cash equity volumes in the industry have experienced cycles of stagnation punctuated by sudden spikes, achieving remarkable growth over the past two decades, with 22x growth in the last 20 years, driven by a customer base of 70 million unique registrations.
Smaller towns and cities are fuelling the surge in NSE’s new investor registrations, with 57% and 43% of these registrations originating from cities beyond the top 50/100. These trends reflect a widening interest in equity markets, indicating the expanding reach of NSE. While 95% of trading volumes are from equities, both cash and F&O, options trading has notably become NSE’s cash cow.
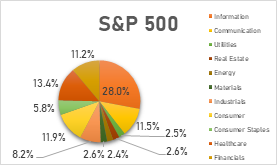
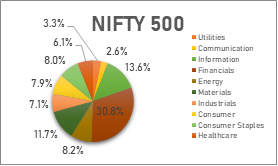
Diversification
The vast difference in market size is striking. The combined market capitalization of the Dow Jones Industrial Average (DJIA) in the US is approximately 8.33 trillion dollars, nearly eight times that of the BSE Sensex in India, which stands at 1.16 trillion dollars. Given the contrast in the two countries’ economies, this divergence is unsurprising.
When it comes to valuations, the DJIA maintains a PE ratio of 16, while the Sensex reports a higher PE ratio of 33.13. This suggests that the market anticipates faster earnings growth for Indian companies compared to their US counterparts, in line with India’s recent GDP growth outpacing the US.
An analysis of the past decade reveals a correlation coefficient of 0.54 between the monthly returns of the two indices, indicating a moderate relationship between the markets, suggesting that diversification strategies require careful consideration.
Over the last ten years, both markets have performed relatively similarly, with the DJIA yielding a compounded annual return of 9.75%, slightly edging out the Sensex’s return of 9.70%. This demonstrates the resilience and attractiveness of both the US and Indian markets for investors.
Surprising Example – Microsoft vs whole NSE turnover
Imagine a big marketplace where people buy and sell things. Market turnover is like counting how many things they trade every day. When a lot of things are traded, we say the market is very busy and lots of people are buying and selling. In our story, we’ll look at two big markets, like a superstore and a toy shop. One of them, the superstore, has more toys and games traded every day than the toy shop, and we’ll learn why this is important for everyone.
Microsoft, known for its widespread global presence, boasts an average daily market turnover of approximately Rs 67,000 crore. This staggering figure showcases the sheer magnitude of trading activity that swirls around the tech giant’s stock on a typical day.
Now, let’s shift our gaze to the heart of India’s financial landscape, the NSE. The NSE’s market turnover, while substantial, hovers around Rs 62,000 crore. This figure represents the combined trading activity of all the stocks and securities listed on the NSE.
The twist? On certain remarkable days, Microsoft’s single stock can command a higher average daily market turnover than the entire NSE, a clear testament to the immense liquidity and dynamism of both the U.S. tech giant and India’s financial markets.
This astonishing example underscores the incredible diversity in the world of financial markets. While it’s a testament to Microsoft’s global appeal, it also highlights the opportunities and potential for growth that continue to beckon India’s thriving stock exchanges.
Disclaimer: This blog has been written exclusively for educational purposes. The securities mentioned are only examples and not recommendations. It is based on several secondary sources on the internet and is subject to changes. Please consult an expert before making related decisions.
Published on: Oct 12, 2023, 2:04 PM IST
We're Live on WhatsApp! Join our channel for market insights & updates

Get the link to download the App

