
The Russell 2000, a prominent stock market index tracking the performance of the smallest 2,000 publicly traded companies in the United States, serves as a vital indicator of the nation’s economic health. Given its focus on smaller companies, which are particularly sensitive to domestic economic conditions, the index holds significant weight on Wall Street.
In the recent trading session, the Russell 2000 witnessed a 1.29% decline on Monday, raising questions about its short-term trajectory. However, over the last five trading sessions, it had managed to accumulate an impressive gain of approximately 5.5%. As market participants ponder whether this is the onset of a fresh rally or merely a transient dead cat bounce, it is imperative to delve into a technical analysis to provide a clearer perspective.
In the aftermath of the Covid-induced lows, the Russell 2000 embarked on a parabolic ascent that culminated in an all-time high of 2459, representing an astounding gain of over 150%. However, as the saying goes, all good things must come to an end. Subsequently, the index entered a corrective decline phase, characterized by a sequence of lower highs and lower lows on the weekly time scale.
This corrective phase found support between the 50-61.8% retracement level, measured from the Covid lows to the highs of 2021. Notably, despite concerns about rising yields and interest rate hikes, the index has managed to stay above the critical 61.8% Fibonacci retracement level.
Recent developments on the weekly chart reveal a positive divergence on the Relative Strength Index (RSI). Moreover, despite experiencing a sharp reaction at the upper boundary of a rectangle channel, the weekly RSI has not ventured into oversold territory, which is a bullish indicator.
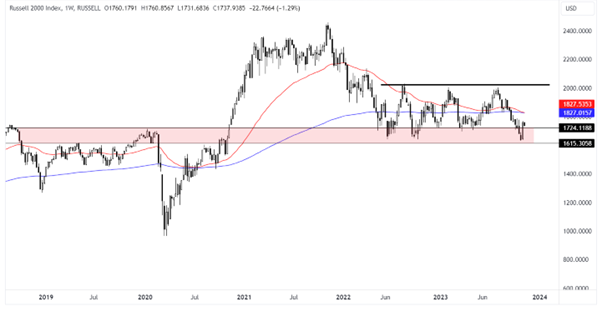
Currently, the index is engaged in a 72-73 week-long consolidation within a rectangle pattern, with a height of approximately 20%. The zone between 2000-2030 is expected to pose a formidable resistance, with the upper boundary of the rectangle pattern located at this level. Simultaneously, the 2000 level itself represents a significant psychological resistance. On the downside, the range of 1630-1670 serves as an important support level. It is likely that the consolidation will persist, with a potential breakout anticipated around the 88–89-week mark.
Analysing the moving averages, the 50-period Exponential Moving Average (EMA) has just crossed below the 200-period EMA on the weekly timeframe, a technical phenomenon known as the “Death Cross.” In the context of a weekly chart, this could herald a long-term bearish trend.
To confirm this bearish trend, the index would need to breach the support level at 1615.30. Conversely, a bullish movement would necessitate the index crossing both the 50 and 200-period EMAs and surmounting the 2000 level with strong market breadth.
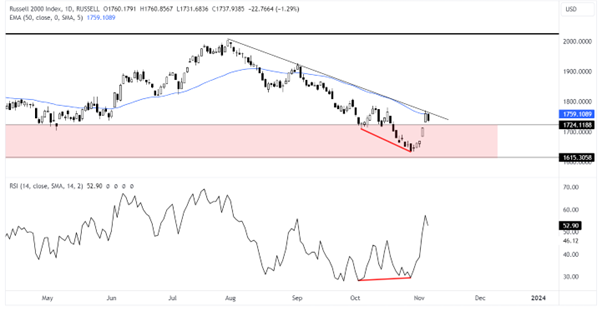
Shifting our focus to the daily chart, recent price action has encountered the 50-day EMA and a short-term downtrend line, resulting in a one-day decline. However, the Relative Strength Index (RSI) exhibits a clear bullish divergence. These contrasting signals may perplex observers.
A potential trendline breakout, accompanied by the price crossing above the 50-day EMA, would signify a bullish momentum, as attempted in the previous week. This breakout has the potential to drive the index towards the coveted 2000 level. The true path forward will become clearer as economic developments unfold and key chart events materialize.
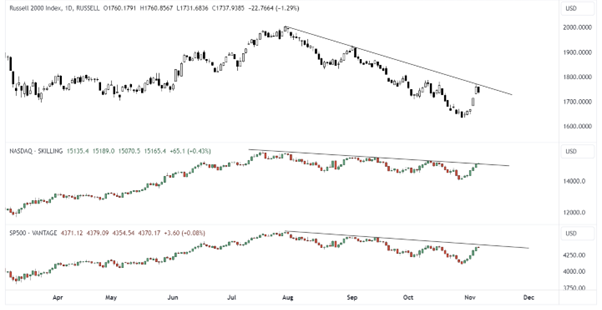
In the broader context, it is imperative to monitor the Russell 2000 in comparison to other major U.S. indices such as the S&P 500 and the Nasdaq 100 composite index. All these indices are currently near a pivotal trendline that will play a crucial role in determining their future direction. The Nasdaq 100 has already breached this trendline with reduced momentum, adding to the significance of the coming week’s market trend and its potential impact on the closing prices of these indexes.
Disclaimer: This analysis is intended solely for educational purposes. The mentioned securities serve as examples and not as recommendations. It is based on multiple secondary sources available on the internet and is subject to change. It is advisable to seek guidance from an expert before making any related decisions.
Published on: Nov 7, 2023, 1:37 PM IST
We're Live on WhatsApp! Join our channel for market insights & updates

Get the link to download the App

