The month of July 2017 saw a marginal 3.94% growth in exports on a YOY basis but there was a perceptible fall in imports on an MOM basis which led to the trade deficit coming down. The big worry for exports growth has been the strong rupee. In fact, the INR strengthened from Rs.68.5/$ to Rs.63.5/$ since the beginning of January 2017. This INR strength has been an outcome of healthy capital flows and lesser than expected negative impact of demonetization. The INR also strengthened as the Fed began to go slow on the pace of rate hikes. The net result was that the strong rupee was actually working against exports and in favour of imports. Under these circumstances, the reduction in fiscal deficit for the month of July is truly commendable.
How exports and imports for July panned out…

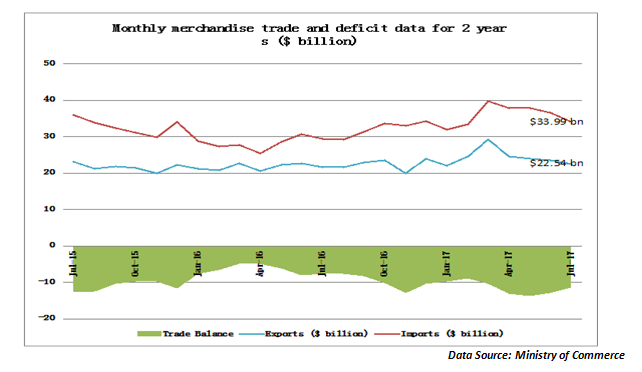
Exports for the month of July 2017 were up by 3.94% at $22.54 billion. Most of the key export-basket components like engineering goods, petroleum products and organic & inorganic chemicals saw growth in the range of 15 to 20%. As the chart above indicates, exports have almost been flat over the last 2 years. This is largely an outcome of a strong rupee. When the INR was at 68.5/$, it was already overvalued in REER terms. One can estimate the extent of overvaluation at the current level of the INR. That has been one of the reasons for tepid growth in exports over the last one year. In fact, countries like Japan and the EU have benefited substantially due to a weak currency; a model that India should also consider seriously.
Imports for the month of July at $33.99 billion were slightly lower than the previous month. However, the import figure is still 15% higher than the previous year, which goes to show that the import chart is already in a higher trajectory in the current fiscal year. Crude oil imports grew by 15% while imports of electronic goods were up by 22.5%. Overall, POL imports were up by 15% at $7.85 billion while non-oil imports were 16% higher at $26.15 billion. Within the ambit of non-oil imports, the big worry is on the gold imports front. Gold imports are up by 95% for the month of July 2017. Let us understand the significance of gold imports in slightly greater detail.
Gold represents an unproductive asset unlike other products which are instrumental in further productive applications after being imported. The RBI and the Ministry of Finance has never been comfortable with a rising gold import bill as it means that more of your precious forex resources are being used to pay for an unproductive asset. However, the surge in gold imports may be temporary. Last year, gold imports were at a multi-year low to due to a prolonged jewellers strike protesting against the high levels of duties imposed. Once that base effect wears off, the growth in gold imports may appear less intimidating. Of course, the government does have options to curb gold imports through higher duties and compulsory export commitments, which it had last used in 2013. But, if it is just the base effect playing on gold demand then these curbs may not be required.
How did the merchandise and service trade balance pan out?
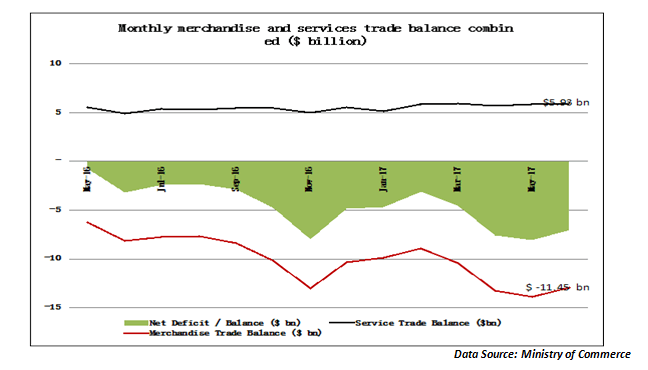
There are two key components to the overall trade deficit. There is the merchandise trade deficit at ($-11.45 bn), which we have seen as the excess of merchandise imports over merchandise exports. But India has much more favourable situation in the services account. Since services trade is reported by the RBI with a 1 month time lag, we have the service exports for June 2017 $13.39 billion while the imports of services were at $7.46 billion. This resulted in a surplus of $5.93 billion on the services trade account. Services exports are predominantly about software exports. The global software industry has been facing the brunt of an unfriendly visa regime and weak tech spending by a majority of global companies. As the chart below clearly indicates, the export of services has been almost static over the last 2 years.

Why is this comparison important? Unlike China, which is an economy driven by manufacturing, India is an economy that is driven by the services sector. Hence a robust services export basket needs to act as a counter-weight against the merchandise trade deficit. As the chart above indicates, the net cumulative deficit has been consistently widening as the growth in services trade surplus has failed to keep pace with the growth in the merchandise trade deficit. It also makes the economy vulnerable were crude oil prices to rise in the next few months. That must be the priority!
Published on: Aug 16, 2017, 12:00 AM IST
We're Live on WhatsApp! Join our channel for market insights & updates
