
Neuland Laboratories Ltd manufactures and exports of bulk pharmaceutical ingredients and intermediates for the generics industry. It also offers custom manufacturing solutions and synthetic peptides.
The company currently holds a market capitalisation of Rs 8,804 crore, with its stock trading at Rs 6,862. Over the past period, the stock has seen fluctuations between Rs 6,961 and Rs 1,545. With a price-to-earnings (P/E) ratio of 27.7, the stock reflects its earnings performance relative to its market value. Despite a modest dividend yield of 0.15%, the company demonstrates strong returns on capital employed (ROCE) at 20.8% and return on equity (ROE) at 17.9%, signifying efficient utilisation of invested capital and shareholder equity, respectively.
The company maintains a low debt-to-equity ratio of 0.09, indicating prudent financial management. While the industry P/E ratio is 32.5, the company’s P/E ratio suggests it may be undervalued compared to its peers. Promoter holding stands at 32.8%, indicating their confidence in the company’s prospects.
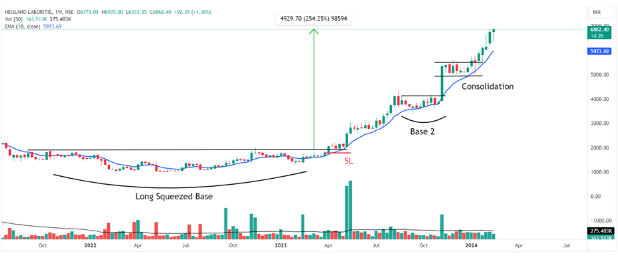
Looking at the chart Neuland Laboratories broke the long base in 1st quarter of FY24 and started a strong upward journey where it created 2nd base in 2nd quarter then the price consolidated at the end of the year 2023. Since then, the stock has been in a strong uptrend. The green bar volumes are higher than the red giving confidence to the bullish trend. Overall technical setup looks good for the stock to reach new highs.
The earnings per share (EPS) for the company have shown significant growth over the specified quarters, on a YoY basis where all quarter has triple-digit growth.
| Particulars | Mar-22 | Jun-22 | Sep-22 | Dec-22 | Mar-23 | Jun-23 | Sep-23 | Dec-23 |
| EPS (Rs) | 16.98 | 7.77 | 29.98 | 23.81 | 65.89 | 48.23 | 69.56 | 63.44 |
| YoY Growth (%) | – | – | – | – | 288% | 521% | 132% | 166% |
The earnings per share (EPS) experienced a significant surge in March 2021, reaching Rs 62.85, marking a remarkable 397.62% growth compared to the previous year. However, in March 2022, the EPS declined to Rs 49.74, representing a downturn of -20.86%. Nevertheless, by March 2023, the EPS rebounded sharply to Rs 127.45, showcasing an impressive growth of 156.23%, which could suggest a successful recovery or strategic initiatives yielding fruitful results for the organisation.
| Particulars | Mar-21 | Mar-22 | Mar-23 |
| EPS (Rs) | 62.85 | 49.74 | 127.45 |
| Annual Growth (%) | 397.62% | -20.86% | 156.23% |
In January 2024, the company approved a capital expenditure of Rs 17.2 crore for the acquisition of a land parcel.
As mentioned above, the chart has properly formed two bases till now.
There is a change in the management of the company, but it does not affect the company as the resignation of the vice president was reasoned to pursue new career opportunities.
The company has reduced the number of shares in the previous year’s quarter where since the last 3 quarters the number of shares has increased in minor quantity. Where the company’s borrowing is reduced immensely and reserves are continuously increasing.
In the peer’s comparison Neuland Labs stands at 3rd position by market capitalization but looking at the stock price growth and return of capital employed it emerges as the leading stock in the segment.
| Sr. No. | Name | CMP Rs. | Mar Cap Rs. Cr. | 1Yr return % | ROCE % |
| 1 | Divi’s Lab. | 3712.10 | 98544.60 | 31.78 | 19.36 |
| 2 | Jubilant Pharmova | 605.60 | 9647.23 | 86.47 | 3.13 |
| 3 | Neuland Labs. | 6847.60 | 8785.40 | 304.20 | 20.85 |
| 4 | Aarti Drugs | 535.05 | 4954.58 | 41.32 | 15.34 |
| 5 | Ami Organics | 1095.95 | 4041.91 | 21.07 | 20.58 |
The company has total 28.71% of Institutional investment as shown in the table and details are given below
| Share Holdings | Mar-23 | Jun-23 | Sep-23 | Dec-23 |
| Promoters | 36.14% | 36.03% | 35.97% | 32.80% |
| FIIs | 18.14% | 20.19% | 21.57% | 22.69% |
| DIIs | 7.10% | 6.76% | 6.99% | 6.02% |
| Government | 0.40% | 0.40% | 0.40% | 0.40% |
| Public | 38.22% | 36.62% | 35.08% | 38.10% |
| No. of Shareholders | 26,948 | 25,223 | 26,824 | 27,723 |
FIIs Investment
Malabar India Fund Limited has a 9.95% stake and Matthews India Fund has a 3.53% stake where the remaining part is invested by other FIIs.
DIIs and Ace Investor’s Investment
The stock is subscribed by 3 prominent investors named Mukul Agarwal, Dolly Khanna and Vijay Kedia where Malabar Value Fund has a significant stake through the DII category.
As we stand in February 2024 the Indian stock market indices are just trading near their respective all-time high and consolidating right now. Looking at the economic event the Indian economy is on the bull run and likely to achieve the 5 trillion soon. The healthcare and pharma sectors are on the bullish move where the Pharma index is at its all-time high.
Disclaimer: This blog has been written exclusively for educational purposes. The securities mentioned are only examples and not recommendations. It is based on several secondary sources on the internet and is subject to changes. Please consult an expert before making related decisions.
Published on: Feb 15, 2024, 4:24 PM IST
We're Live on WhatsApp! Join our channel for market insights & updates

Get the link to download the App

