
HDFC Bank faced a significant downturn following the release of its Q3FY24 results, with market sentiment heavily stacked against it. The HDFC Bank stock plummeted to a new 52-week low of Rs 1,363.55, with negative market depth indicating widespread selling pressure. However, the tide soon turned as the stock stabilised and began its ascent once again. While still lingering at lower levels, today’s surge in open interest marks a notable shift in investor sentiment, suggesting renewed confidence in the bank’s prospects.
HDFC Bank Ltd started the trading day on a positive note, opening at Rs 1,415 and quickly gaining momentum to reach a high of Rs 1,450.8. The stock maintained its strength throughout the session, with minor fluctuations, and found support at Rs 1,411.8, ultimately closing at Rs 1,449.4. This marks a significant uptick from its previous close of Rs 1,417.1, indicating a bullish sentiment among investors. The stock saw a notable percentage change of 2.28%, reflecting the positive market sentiment towards HDFC Bank.
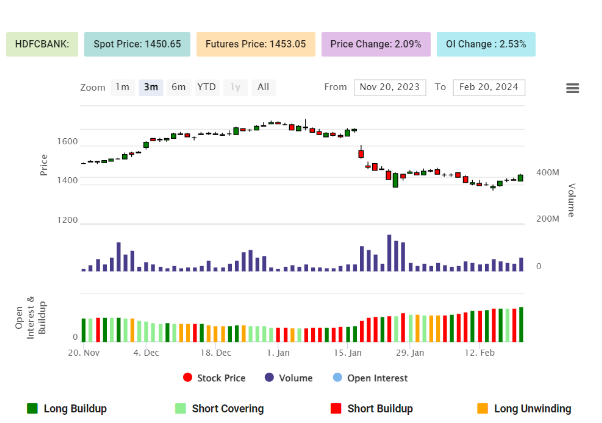
The recent data for HDFC Bank (HDFCBANK) indicates a notable increase in long buildup, both in the short-term and medium-term outlooks.
In the short term, there has been a significant increase in open interest (OI) by 2.70%, coupled with a substantial surge in trading volume by 65.52%. This suggests a strong bullish sentiment among market participants, with a considerable number of new positions being initiated or added to existing ones, indicating confidence in the upward movement of the stock price. Additionally, the stock price has seen a positive change of 1.95% over the day, further supporting the bullish outlook.
Similarly, over the past five days, there has been a significant long buildup, with a 5-day price change of 3.42% and a significant increase in both open interest (8.80%) and trading volume (139.88%). This sustained bullish momentum over the medium term further reinforces the positive outlook for HDFC Bank.

Weekly Technical Chart
Despite today’s gains, it’s important to note that the stock is still in its old 52-week high and low range where the 52-week high of Rs 1,757.5, and its 52-week low of Rs 1,363.55. With a market cap of Rs 11,00,933.53 crore, HDFC Bank continues to be a prominent player in the market, attracting investor attention with its consistent performance.
Disclaimer: This blog has been written exclusively for educational purposes. The securities mentioned are only examples and not recommendations. The information is based on various secondary sources on the internet and is subject to change. Please consult with a financial expert before making investment decisions.
Published on: Feb 20, 2024, 5:03 PM IST
We're Live on WhatsApp! Join our channel for market insights & updates

Get the link to download the App

