Products
Quiz Locked
You need to complete all the
Chapters to unlock module Quiz
Bear Market: Meaning, Causes and Types
READING
![]() 10 mins read
10 mins read
In the past chapters and modules, we’ve walked you through the stock market basics and concepts that impact investment decisions. In this module, let’s take a step back and look at the entire market. Trust us, the stock market is a beautiful little world in itself, captured very aptly by Benjamin Graham, the father of investing, in his book The Intelligent Investor. He gives the market a persona - one of a whimsical Mr Market who does what he wants, when he wants, and is very, mind us, very moody! That’s exactly what we will look at now - bull markets and bear markets - brought about by the mood of Mr Market. In this chapter, let’s tackle bear markets.
Before we get to that, here’s a trivia for you. Have you ever wondered why the bull and the bear? Why not a lion, a squirrel, or an eagle? There are many theories around this, but the most logical seems to be that the bull and the bear have been chosen as representations for market trends because of their attacking positions (of course, also their alliteration - B words!). Alright, let’s wrestle the bear by its claws!
What Is a Bear Market?
When a bear attacks, it slashes its formidable claws in a downward motion with great strength that can cripple and, in many cases, cause mortal damage to its prey. A market is termed a bear market when stock prices drop significantly, often by 20% or more from its recent high. One can imagine the plight of investors. It causes widespread pessimism, and the downturn affects stock values, scares investors to pull out money rather than invest (selling pressure on the market is more), and decreases the money flow in the economy's investment sector.

How to Identify a Bear Market?
A bear market sure is scary as it wipes out investor wealth. But not all dips in the stock market can be called bear markets. How does one identify it then? At the outset, a bear market is characterised by a prolonged period of declining stock prices. Here's a detailed breakdown of the indicators. Understanding these indicators can help you make more informed decisions, especially during turbulent market conditions.
-
Major Indices Decline:
A bear market is often signalled by a sustained drop in major stock indices, such as the BSE Sensex and NSE Nifty, by more than 20% from the latest highs over a period of roughly two months. This trend reflects widespread pessimism and a lack of confidence among investors.
-
Economic Recession:
The onset of a bear market can lead to or coincide with an economic recession. As investors become wary, they might hold onto their investments, hoping for a market rebound. This cautious behaviour can reduce overall spending and demand for goods and services, further exacerbating the economic downturn.
-
Market Bubbles Burst:
Historical market bubbles, like the dot-com bubble or the housing market crisis, often precede bear markets. These bubbles are characterised by inflated asset prices that eventually collapse, leading to a broad market sell-off.
-
Societal Crises:
Significant public health emergencies or geopolitical conflicts can also trigger bear markets. Events such as pandemics or wars disrupt normal economic activities and can lead to widespread market declines.
-
Increased Volatility:
A notable increase in market volatility, with sharp and unpredictable price fluctuations, is another hallmark of a bear market. This heightened uncertainty can challenge even seasoned investors and significantly impact investment strategies.
Note: You can see the market trends of a particular day. To do so:
-
Open the Angel One app and go to the Home Page
-
Check the ‘Markets Today’ section.
-
Choose Derivatives Market.
-
Here you can check the movements of the major indices. You can also find the sectoral heatmaps of the various sectors.
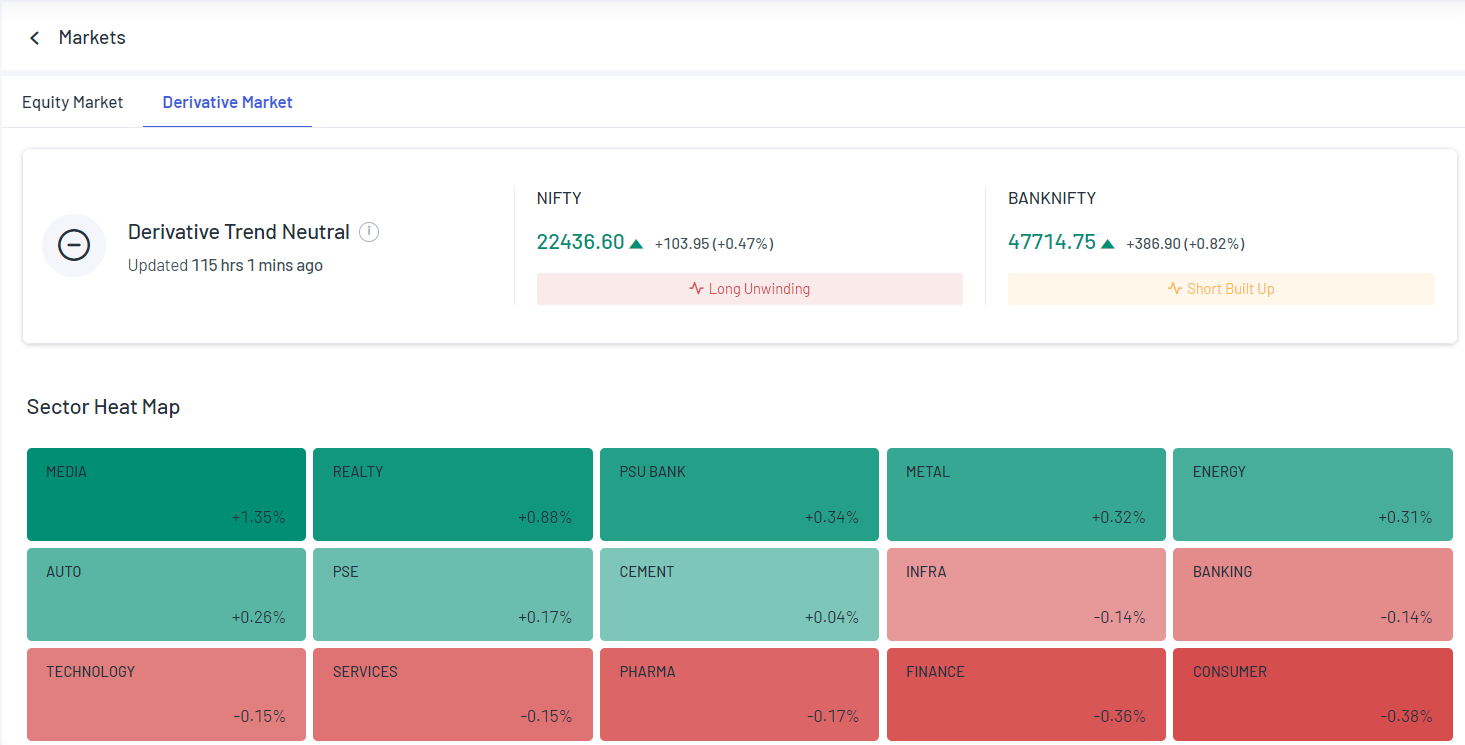
Figure: Derivative Market page on Angel One
Heat map here basically shows not only the overall direction of prices of the stocks in that sector, but also tries to give us a picture of the intensity of that movement, both by colour and percentage change. For example, if the finance sector is in a highly bearish mood, then the sector will show as dark red.
What Causes Bear Market?
Now that you have a fair understanding of what happens when the market is bearish, it is important to understand what causes a bear market.
Let’s have a look at these factors:
-
Economic Downturns:
Global or regional economic downturns often lead to bear markets. Any disruption in economic stability leads to business losses and higher unemployment. This causes investors to sell their stocks, contributing to the bearish trend.
-
Market Overvaluation:
Prolonged bullish markets can lead to overpriced stocks. At this point, fear of a potential crash prompts investors to sell and thus triggers a bear market.
-
High Inflation:
When inflation rises, but incomes don't keep pace, people's buying power drops. This leads to negative economic sentiment and, thus a decline in stock prices.
-
Strict Monetary Policies:
When central banks raise interest rates or enforce tight policies to control inflation, it can lead to a bear market.
-
Socio-Political Factors:
The stock market is also sensitive to social and geopolitical issues. Negative developments in these areas can lead to a bearish market.
Examples of Bear Phases in Share Market History
Bear markets can last from a few weeks to even several years! Let’s take a look at some bear market scenarios from the past.
-
The Great Depression:
Possibly still the scariest of times in history with regard to economic activity is the bear market, which began with the stock market crash in 1929. Termed the ‘Great Depression’, the phenomenon lasted for several years, with severe economic challenges persisting even into the late 1930s!
One cannot quite nail to this day why the bear market happened, but there were factors contributing to the imminent fall. One is, of course, the stock market crashed a good 12% (the day coming to be known as Black Tuesday), which led to a loss of confidence. With investors rushing to withdraw their deposits and savings, banking systems could not withstand the pressure, leading to widespread closures. Now, with people panicking about their financial stability, they naturally cut back on spending, which went on to impact overall economic activity.
Note that from its peak in September 1929 to the bottom in July 1932, the DJIA - a commonly referenced indicator of the US markets - lost about 89% of its value! Now you know why the Great Depression was the greatest bear market the world has ever witnessed.
-
The 2008 Recession:
The 2008 Recession is another episode that is etched in the history of bear markets. After the subprime mortgage crisis in the USA, the economy slowed down drastically.
The event was followed by the collapse of one of the biggest financial institutions in the world at the time: Lehman Brothers Holdings Inc. The series of events impacted the world. Even in India, the Sensex was down by 1408 points.
Due to the global recession, investors became conservative with their investments and the market became bearish.
-
The Covid-19 Pandemic:
The Covid-19 pandemic significantly impacted the stock market, swiftly leading to a bear market. This period was marked by an economic slowdown as a direct consequence of the pandemic, highlighting one of the fastest transitions ever seen into a bearish market phase. For reference, the S&P 500, an index of the US markets, declined by about 34% from its peak on February 19, 2020, to its low point on March 23, 2020!
Types of Bear Markets
Bear markets are classified based on their characteristics and the events that lead to a bearish trend. Primarily, there are two types of bear markets.
-
Secular Bear Market:
A Secular Bear Market represents an extended period of downtrend in stock prices, potentially lasting years, where values may significantly drop or stagnate. Identifying such a market involves analysing key economic indicators that directly influence stock market performance, as these factors play a crucial role in hindering market growth during these times. The bear market brought on by the historical event - The Great Depression - may be considered an example of a secular bear market. A better example is, however, the bear market that began in 1966 and finally bottomed and saw a trend reversal way out in 1982.
-
Cyclical Bear Market:
Cyclic bear markets are short-lived and are triggered by specific economic or financial events. They tend to correspond with economic cycles. These periods see temporary stock price declines as the market adjusts to reflect economic growth and other indicators. Once these adjustments occur, the market typically corrects itself, leading to a recovery in stock prices and a return to positive market sentiment. The COVID-led bear market is often characterised as a cyclical bear market.
Bear Markets vs Corrections
Bear markets are often confused with market corrections. However, they are starkly different. In the case of a bear market, the value of the stocks falls by at least 20% from its high. Sometimes, the market self-adjusts during this phase, potentially leading to a bullish (upward) trend.
On the other hand, a market correction is a shorter, more temporary dip in stock prices, usually between 10% and 20%, and is considered a natural part of market fluctuations without lasting impact.
Following a correction, stock prices typically rebound and attract more investors. This positively influences economic growth and can be reflected in the GDP.
Can We Invest During Bear Market?
While investing during a bear market is challenging, it presents opportunities for savvy investors to acquire stocks at lower prices. This offers them an opportunity to make profits once the market gets better. You can consider the following strategies to navigate this period effectively:
-
Reassess Long-Term Objectives:
Understanding your long-term financial goals is crucial before entering a bear market. If you are here to stay, it may be a good idea, but remember, the prices can go down further and thinking in the short term may not be a great idea.
-
Opt for Defensive Stocks:
Experts recommend focusing on companies in essential services sectors. These stocks are known as defensive stocks because they tend to remain more stable as compared to the others even in turbulent economic conditions.
-
Embrace Diversification:
Diversification is suggested as a single solution for several investment woes. It involves broadening your investment portfolio across various sectors and asset classes and can spread risk and potentially mitigate losses during bear market volatility.
Bottom line
Now that you have understood the bear market meaning, it is also important to understand the fundamentals of the bull stock market. A combined understanding of both these concepts will offer you a comprehensive idea of the functioning of markets and help you become a better investor. The next chapter is about bull markets and will help to learn the concept completely.