September 15, 2021
www.angelone.in
Technical & Derivatives Report
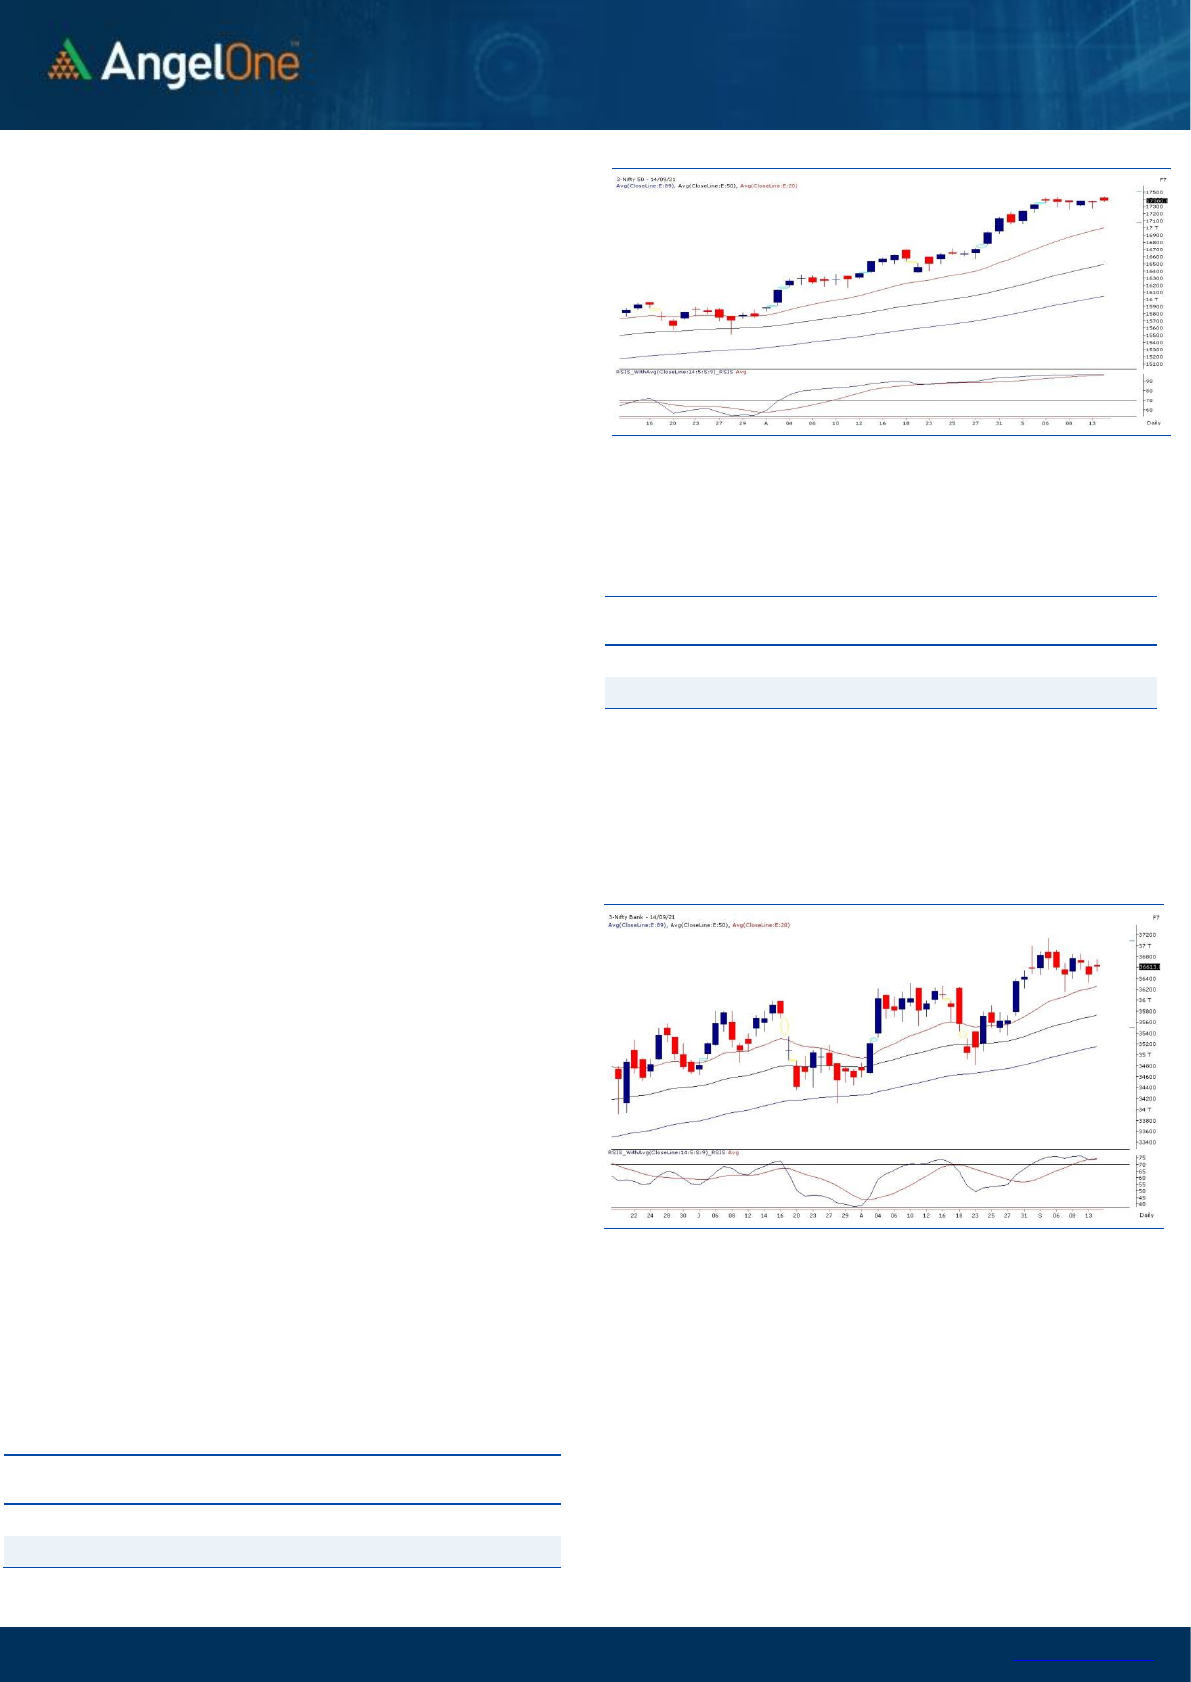
Exhibit 1: Nifty Daily Chart
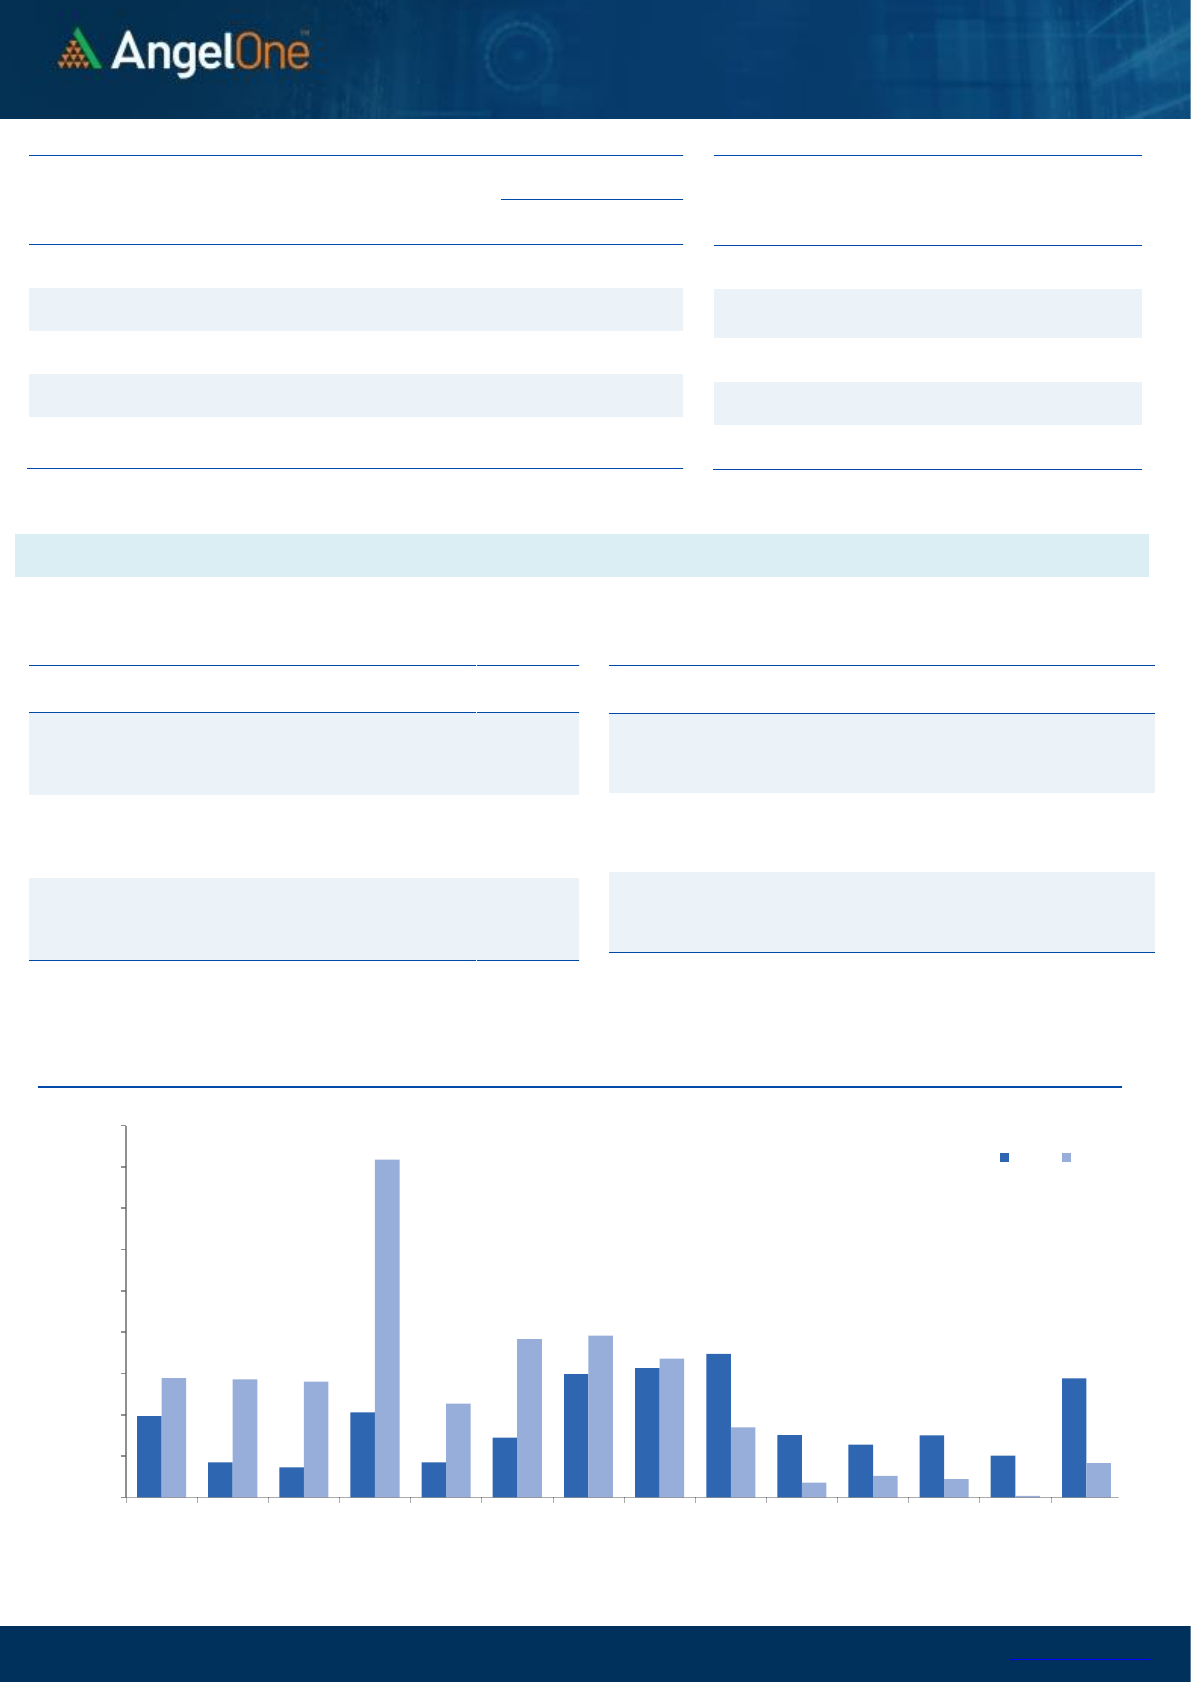
Nifty Bank Outlook - (36613)
The banking index had a positive start in tandem with the
benchmark. However after the initial head-start, the follow up
move was once again missing. For the remaining part of the
session, BANKNIFTY remained in a positive territory but it was
more of a consolidation within a slender range.
Now if we look at the intraday time frame chart, we can see a
range shrinking day by day. Generally when the consolidation
price movement reached a converging point, the breakout
becomes imminent on either side. So on the higher side, 36700 is
the level to watch; whereas on the flipside, the lower end of this
consolidation range is at 36300. Let’s see whether it really triggers
real momentum outside this range or not.
Key Levels
Support 1 – 36510
Resistance 1 – 36700
Support 2 – 36300
Resistance 2 – 36860
Exhibit 2: Nifty Bank Daily Chart
Hence, traders should keep a watch on the development there and
we reiterate to have a thematic approach and be fussy in stock
selection.
Key Levels
Support 1 – 17300
Resistance 1 – 17450
Support 2 – 17250
Resistance 2 – 17500
Sensex (58247) / Nifty (17380)
Nifty started the day on a positive note and marked a new high of
17438. However, it failed to show a follow up move and gave up
some of the gains to end below 17400.
Although we saw a new high in Nifty, the index traded within a
narrow range throughout the day. In last few sessions, Nifty has
traded within a range of 17250-17430 and as we approached the
higher end of the range yesterday, we saw signs of fatigue at higher
levels. The stock specific momentum continued where better trading
opportunities are seen for day traders. Until we see a clear breakout
from the range of 17250-17450, we continue with our advice for
traders to avoid aggressive trades in index and rather focus on stock
specific ideas. In last few day’s, the banking index too has seen a
sideways move and looking at the lower time frame chart, we expect
a breakout soon on either side which could then lead to momentum
in the benchmark as well.
.

www.angelone.in
Technical & Derivatives Report
September 15, 2021
Nifty Vs OI
16200
16400
16600
16800
17000
17200
17400
17600
,0
20,000
40,000
60,000
80,000
100,000
120,000
140,000
160,000
180,000
8/25 8/27 8/30 9/1 9/3 9/7 9/9 9/14
(`000)
Openinterest Nifty
View
◼ Post Monday’s recovery, our market had a positive start
yesterday. The benchmark clocked yet another record
high but as we progressed follow-up buying was
missing and hence we concluded the with the marginal
gains.
◼ FIIs were net buyers in cash market segment to the tune
of Rs. 1649 crores. In index futures, they sold worth
Rs. 197 crores with some fall in open interest indicating
blend of long unwinding and short formation.
◼ In F&O space, we hardly saw any relevant open interest
activities in both the indices inline with recent trend.
Stronger hands continued with their buying in equities
but remained sellers in index and stock futures segment.
In Nifty options front, massive writing was seen in
17450-17550 call strikes which restricted the upside
yesterday. On the other side, we saw some build-up in
17300 put option. Considering the above data points,
we would advise traders to keep booking profit in index
and continue trading in individual counters.
Comments
◼ The Nifty futures open interest has increased by 1.22%.
Bank Nifty futures open interest has decreased by 0.26%
as market closed at 17380.00 levels.
◼ The Nifty September future closed with a premium of
4.95 point against a premium of 4.00 point in last
trading session. The October series closed at a premium
of 35.40 point.
◼ The INDIA VIX decreased from 14.02 to 13.57. At the
same time, the PCR-OI of Nifty has decreased from 1.33
to 1.19.
◼ Few of the liquid counters where we have seen high cost
of carry are ADANIENT, IDEA, BHEL, CANBK and
BHARATFORG.
OI Gainers
SCRIP
OI
OI
CHG. (%)
PRICE
PRICE
CHG. (%)
IRCTC
2553200
50.96
3738.35
8.93
IPCALAB
253125
16.46
2637.90
1.82
IDEA
930580000
15.18
8.70
9.38
UBL
1600900
14.01
1586.60
-0.53
PIIND
1194250
13.01
3497.60
1.65
MARICO
11676000
11.63
558.30
-2.93
INDUSINDBK
17045100
9.52
1036.60
4.32
BHEL
131061000
9.22
58.00
5.42
OI Losers
SCRIP
OI
OI
CHG. (%)
PRICE
PRICE
CHG. (%)
ZEEL
67038000
-14.70
261.55
39.44
HINDALCO
34885900
-9.86
477.95
-0.18
LICHSGFIN
24086000
-6.51
419.60
0.10
SRF
699000
-6.43
10676.45
-0.34
DEEPAKNTR
2736000
-6.35
2451.10
0.66
NAM-INDIA
4249600
-6.21
437.85
0.38
EXIDEIND
36500400
-5.46
182.60
-0.65
KOTAKBANK
17575200
-4.43
1867.75
1.37
Put-Call Ratio
SCRIP
PCR-OI
PCR-VOL
NIFTY
1.19
0.95
BANKNIFTY
0.80
0.93
RELIANCE
0.47
0.41
ICICIBANK
0.43
0.40
INFY
0.51
0.40
Historical Volatility
SCRIP
HV
SYNGENE
38.67
IGL
39.09
COALINDIA
38.24
MINDTREE
47.83
ASTRAL
51.50
www.angelone.in
Technical & Derivatives Report
September 15, 2021
Note: Above mentioned Bullish or Bearish Spreads in Nifty (September Series) are given as an information and not as a recommendation.
Nifty Spot = 17380
0900 Lot Size = 75
FII Statistics for September 14, 2021
Detail
Buy
Net
Contracts
Open Interest
Sell
Value
(in Cr.)
Change
Change
(%)
INDEX
FUTURES
2726.36
2923.36
(197.00)
174556
15376.61
(0.23)
4849.58
INDEX
OPTIONS
189207.26
190522.00
(1314.74)
1450810
127856.51
6.94
297314.41
STOCK
FUTURES
11545.49
11741.65
(196.16)
1478297
127222.73
0.35
18904.77
STOCK
OPTIONS
18466.65
18568.94
(102.29)
285427
24644.51
4.95
22378.01
Total
221945.76
223755.95
(1810.19)
3389090
295100.36
3.43
343446.77
Turnover on September 14, 2021
Instrument
No. of
Contracts
Turnover
( in Cr. )
Change
(%)
Index Futures
174876
15657.67
-20.21
Index Options
38663756
3473298.67
10.77
Stock Futures
719603
61509.04
32.01
Stock Options
2982919
263275.68
28.54
Total
42,541,154
3813741.06
11.95
Bull-Call Spreads
Action
Strike
Price
Risk
Reward
BEP
Buy
17400
150.00
44.50
55.50
17444.50
Sell
17500
105.50
Buy
17400
150.00
79.55
120.45
17479.55
Sell
17600
70.45
Buy
17500
105.50
35.05
64.95
17535.05
Sell
17600
70.45
Bear-Put Spreads
Action
Strike
Price
Risk
Reward
BEP
Buy
17400
164.20
43.70
56.30
17356.30
Sell
17300
120.50
Buy
17400
164.20
75.70
124.30
17324.30
Sell
17200
88.50
Buy
17300
120.50
32.00
68.00
17268.00
Sell
17200
88.50
Nifty Put-Call Analysis
,0
500,000
1000,000
1500,000
2000,000
2500,000
3000,000
3500,000
4000,000
4500,000
16700 16800 16900 17000 17100 17200 17300 17400 17500 17600 17700 17800 17900 18000
Call Put

www.angelone.in
Technical & Derivatives Report
September 15, 2021
Daily Pivot Levels for Nifty Constituents
Scrips
S2
S1
PIVOT
R1
R2
ADANIPORTS
737
746
755
764
772
ASIANPAINT
3,338
3,350
3,369
3,382
3,401
AXISBANK
784
789
795
800
806
BAJAJ-AUTO
3,659
3,705
3,736
3,782
3,813
BAJFINANCE
7,330
7,374
7,452
7,496
7,574
BAJAJFINSV
16,645
16,738
16,889
16,982
17,133
BPCL
483
488
496
501
508
BHARTIARTL
684
689
694
700
705
BRITANNIA
4,042
4,072
4,112
4,142
4,183
CIPLA
945
949
954
958
962
COALINDIA
152
154
155
156
157
DIVISLAB
5,000
5,047
5,119
5,167
5,239
DRREDDY
4,883
4,907
4,948
4,972
5,013
EICHERMOT
2,773
2,797
2,833
2,857
2,894
GRASIM
1,583
1,597
1,609
1,623
1,634
HCLTECH
1,195
1,217
1,229
1,251
1,262
HDFCBANK
1,535
1,542
1,553
1,560
1,571
HDFCLIFE
732
736
740
743
748
HDFC
2,773
2,796
2,832
2,855
2,891
HEROMOTOCO
2,777
2,814
2,838
2,875
2,899
HINDALCO
468
473
478
483
488
HINDUNILVR
2,720
2,741
2,773
2,794
2,825
ICICIBANK
702
705
709
712
717
IOC
113
114
115
116
117
INDUSINDBK
983
1,010
1,024
1,051
1,066
INFY
1,670
1,678
1,687
1,695
1,704
ITC
213
214
216
218
219
JSW STEEL
686
690
696
700
706
KOTAKBANK
1,830
1,849
1,864
1,883
1,898
LT
1,667
1,682
1,690
1,705
1,714
M&M
741
746
749
754
757
MARUTI
6,796
6,845
6,900
6,949
7,004
NESTLEIND
19,911
20,071
20,340
20,500
20,769
NTPC
114
115
116
116
117
ONGC
121
123
124
125
127
POWERGRID
173
173
174
175
176
RELIANCE
2,348
2,358
2,376
2,386
2,404
SBILIFE
1,152
1,161
1,168
1,177
1,184
SHREECEM
30,234
30,446
30,616
30,828
30,998
SBIN
430
431
434
436
439
SUNPHARMA
772
776
782
787
793
TCS
3,798
3,842
3,869
3,913
3,941
TATACONSUM
873
877
882
886
890
TATAMOTORS
300
303
305
308
310
TATASTEEL
1,432
1,442
1,459
1,469
1,486
TECHM
1,419
1,435
1,446
1,463
1,474
TITAN
2,020
2,038
2,050
2,067
2,079
ULTRACEMCO
7,770
7,813
7,893
7,936
8,016
UPL
742
747
756
761
770
WIPRO
667
670
673
676
679

www.angelone.in
Technical & Derivatives Report
September 15, 2021
*
Research Team Tel: 022 – 39357600 (Extn. 6844) Website: www.angelone.in
DISCLAIMER
Angel Broking Limited (hereinafter referred to as “Angel”) is a registered Member of National Stock Exchange of India Limited,
Bombay Stock Exchange Limited and Metropolitan Stock Exchange Limited. It is also registered as a Depository Participant with CDSL
and Portfolio Manager and Investment Adviser with SEBI. It also has registration with AMFI as a Mutual Fund Distributor. Angel
Broking Limited is a registered entity with SEBI for Research Analyst in terms of SEBI (Research Analyst) Regulations, 2014 vide
registration number INH000000164. Angel or its associates has not been debarred/ suspended by SEBI or any other regulatory
authority for accessing /dealing in securities Market. Angel or its associates/analyst has not received any compensation / managed
or co-managed public offering of securities of the company covered by Analyst during the past twelve months.
This document is solely for the personal information of the recipient, and must not be singularly used as the basis of any investment
decision. Nothing in this document should be construed as investment or financial advice. Each recipient of this document should
make such investigations as they deem necessary to arrive at an independent evaluation of an investment in the securities of the
companies referred to in this document (including the merits and risks involved), and should consult their own advisors to determine
the merits and risks of such an investment.
Reports based on technical and derivative analysis center on studying charts of a stock's price movement, outstanding positions and
trading volume, as opposed to focusing on a company's fundamentals and, as such, may not match with a report on a company's
fundamentals. Investors are advised to refer the Fundamental and Technical Research Reports available on our website to evaluate
the contrary view, if any.
The information in this document has been printed on the basis of publicly available information, internal data and other reliable
sources believed to be true, but we do not represent that it is accurate or complete and it should not be relied on as such, as this
document is for general guidance only. Angel Broking Limited or any of its affiliates/ group companies shall not be in any way
responsible for any loss or damage that may arise to any person from any inadvertent error in the information contained in this
report. Angel Broking Limited has not independently verified all the information contained within this document. Accordingly, we
cannot testify, nor make any representation or warranty, express or implied, to the accuracy, contents or data contained within this
document. While Angel Broking Limited endeavors to update on a reasonable basis the information discussed in this material, there
may be regulatory, compliance, or other reasons that prevent us from doing so.
This document is being supplied to you solely for your information, and its contents, information or data may not be reproduced,
redistributed or passed on, directly or indirectly.
Neither Angel Broking Limited, nor its directors, employees or affiliates shall be liable for any loss or damage that may arise from or
in connection with the use of this information.
Technical and Derivatives Team:
Sameet Chavan Chief Analyst - Technical & Derivatives sameet.chavan@angelbroking.com
Ruchit Jain Senior Analyst - Technical & Derivatives ruchit.jain@angelbroking.com
Rajesh Bhosale Technical Analyst rajesh.bhosle@angelbroking.com
