Please refer to important disclosures at the end of this report
1
WINDLAS BIOTECH LIMITED
IPO NOTE WINDLAS BIOTECH LIMITED.
August 3, 2021
Windlas Biotech Ltd. The company was incorporated in 2001 based in Dehradun.
The Company operating with 3 business verticals - 1. CDMO Products and
services, 2. Domestic trade generics and Over-the-counter (OTC) market 3.
Exports. The company currently owns and operates four manufacturing facilities
located at Dehradun in Uttarakhand. As of March 31, 2021, their manufacturing
facilities had an aggregate installed operating capacity of 7,063.83 million
tablets/capsules, 54.46 million pouch/ sachet and 61.08 million liquid bottles.
Positives:
(a)
Leading CDMO in India with a focus on the chronic therapeutic
category. (b) Promoter having experience of over two decades in manufacturing
both solid, liquid, and CDMO business along with a good regulatory compliance
track record. (c) Innovative portfolio of complex generic products supported by
robust R&D capabilities. (d)Provides CDMO services to 7 of the top-10 Indian
Pharmaceutical formulations companies. Clients like – Pfizer, Sanofi, Cadila, etc.
Investment concerns: (a) High dependency on CDMO business, 85% of FY2021
revenues. Any slow down in CDMO business can hurt the company’s growth
outlook. (b)Companies top-10 customers contributed 58% of revenue, company
highly dependent on them. (c)Working capital days have increased from 13 days
in FY2020 to 70 days in FY2021.
Outlook & Valuation: Based on FY-2021 adjusted earnings, IPO is priced at PE of
22.2x and EV/EBITDA of 15.58x at the upper band of the IPO price, which is
slightly better than the peer’s companies. The Company has a very healthy
balance sheet with negative Net Debt/ Equity. Quality CDMO business has huge
potential in India in the near future and the company having a good regulatory
compliance track record. We expect the upcoming expansion plan in Dehradun
and increase in capacity utilization will be the next growth drivers for the
company. We are assigning a “SUBSCRIBE” recommendation to the issue.
Key Financials
Y/E March (` cr)
FY2019
FY2020
FY2021
Net Sales
206
263
300
% chg
-
27.6
14.1
Net Profit
21
38
52
% chg
-
84.0
38.3
EBITDA (%)
16.4
20.9
21.9
EPS (`)
9.0
17.0
23.6
P/E (x)
120.4
63.5
45.9
P/BV (x)
30.1
20.4
14.5
ROE (%)
50.0
38.3
36.8
ROCE (%)
29.0
22.4
24.1
EV/EBITDA
72.8
45.1
37.8
EV/Sales
11.9
9.4
8.3
Source: Company, Angel Research.
Note: Valuation ratios at upper price band.
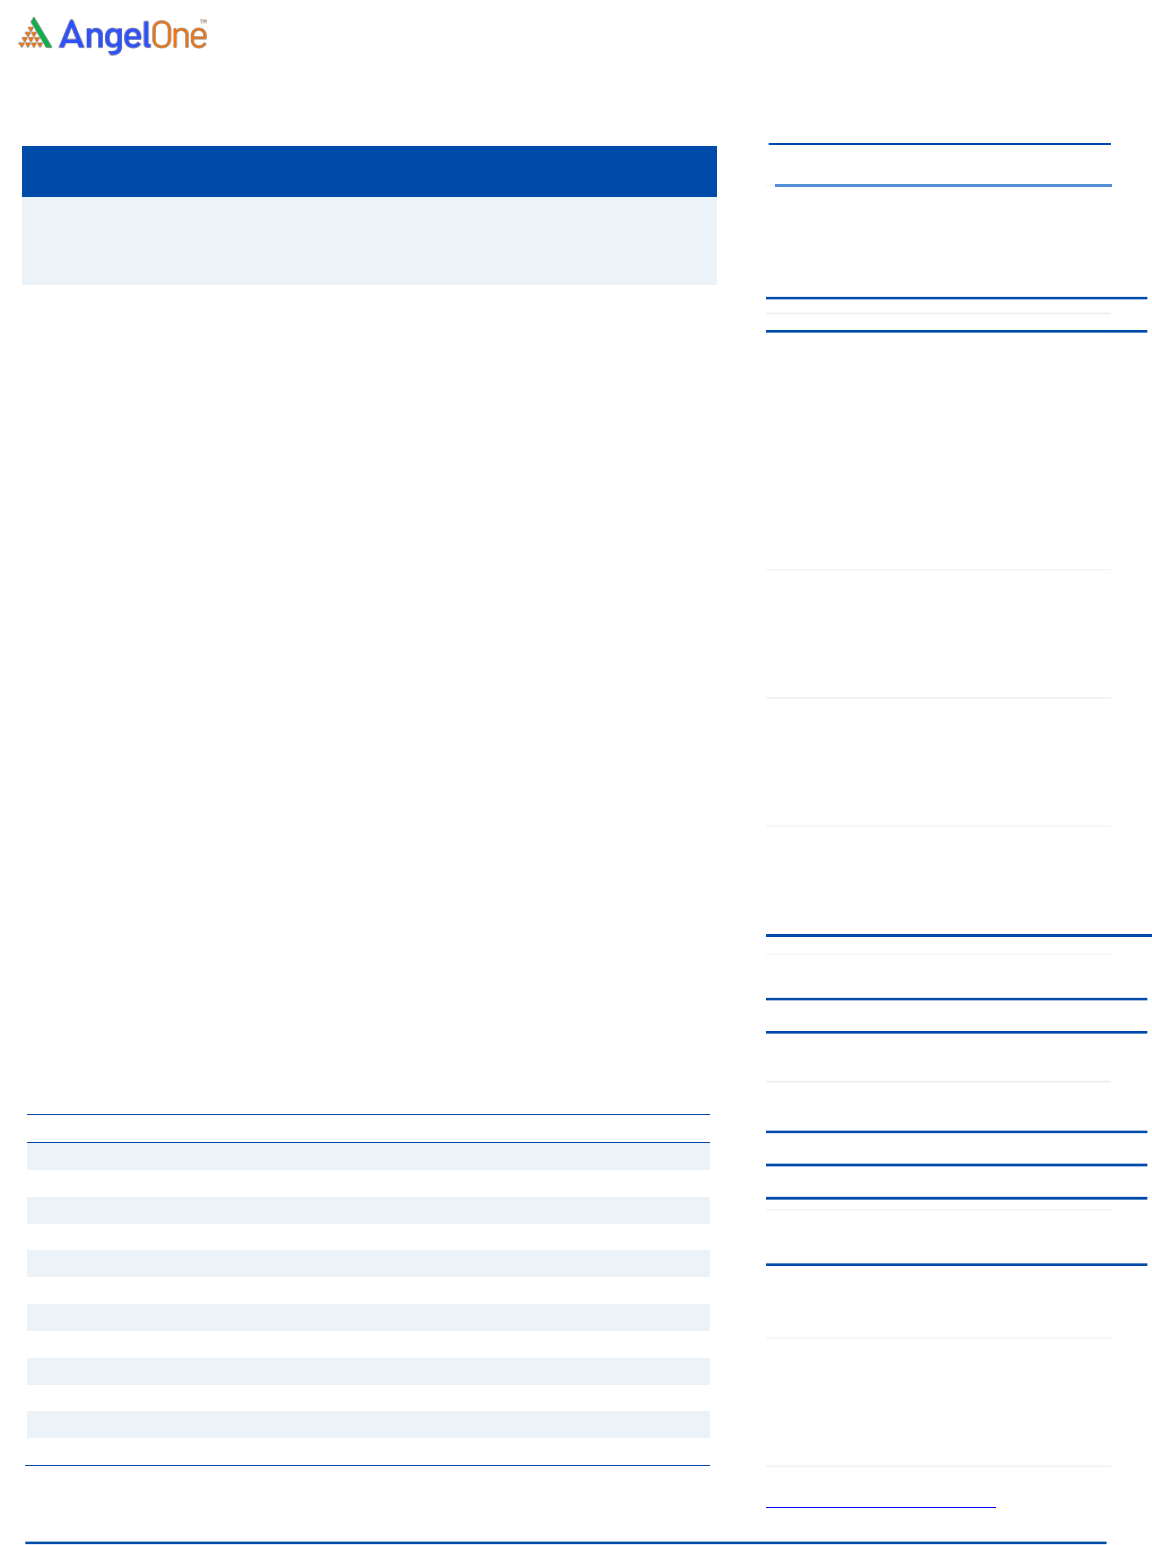
SUBSCRIBE
Issue Open: August 4, 2021
Issue Close: August 6, 2021
Issue Details
Face Value: ₹5
Present Eq. Paid up Capital: ₹6.4 Cr
Issue Size: ₹401 Cr
Offer for Sale: ₹236.5 Cr
Fresh issue: ₹165 Cr
Price Band: ₹448-460
Lot Size: 30 shares and in multiple thereafter
Expected Listing : 17th August 2021
Post-issue mkt. cap: * ₹976 Cr - ** ₹1,003 Cr
Promoters holding Pre-Issue: 78%
Promoters holding Post-Issue: 65.2%
*Calculated on lower price band
** Calculated on upper price band
Book
Building
QIBs
50% of issue
Non-Institutional
15% of issue
Retail
35% of issue
Post issue Shareholding pattern
Promoters
Others
65.2%
34.8%

Windlas Biotech Limited | IPO Note
August 3, 2021
2
Company background
Incorporated in 2001, Windlas Biotech Ltd is one of the leading companies in the
pharmaceutical formulations contract development and manufacturing organizations
(CDMO) segment in India. The company offers a range of CDMO services from product
discovery to product development, licensing, and commercial manufacturing of generic
products including complex generics.
It further sells its own branded products in the trade generics and OTC markets.
Currently, the focus of the company is to launch complex generic products in the chronic
therapeutic category related to lifestyle-related disorders. The business operates in 3
verticals; 1. CDMO Products and services, 2. Domestic trade generics and Over-the-
counter (OTC) market (nutraceutical and health supplement products), and 3. Export.
Leading pharma companies i.e. Pfizer Ltd, Sanofi India Ltd, Cadila Healthcare Ltd,
Emcure Pharmaceuticals Ltd, Eris Lifesciences Ltd, Intas Pharmaceuticals Ltd, and
Systopic Laboratories Private Limited are some of the marquee customers of Windlas
Biotech. Its manufacturing facilities are located at Dehradun with an installed operating
capacity of 7,063.83 million tablets/ capsules, 54.46 million pouch/ sachet, and 61.08
million liquid bottles.
Issue details
The issue comprises of offer for sale of upto ₹236.5 crore and Fresh issue of 165
crores with the price band of ₹448-460.
Pre & Post Shareholding Pattern
No of shares
(Pre-issue)
%
(Post-issue)
%
Promoter
1,42,01,787
78.0%
1,42,01,215
65.2%
Public
40,05,632
22.0%
75,93,160
34.8%
Total
1,82,07,419
100%
2,17,94,376
100%
Source: Company, Angel Research
Objectives of the Offer
Purchase of equipment required for capacity expansion of their existing
facility at the Dehradun. (50 Cr)
Funding incremental working capital requirements of the Company. (47.5 Cr)
Repayment of certain borrowings (20 Cr.)

Windlas Biotech Limited | IPO Note
August 3, 2021
3
Key Management Personnel
Vivek Dhariwal is the Chairman and Non-Executive Independent Director of the
Company. He holds a bachelor’s degree in technology (chemical engineering) from
the Indian Institute of Technology, Bombay and a master’s degree in science
(chemical engineering) from University of Kentucky.
Ashok Kumar Windlass is the Wholetime Director of our Company. He holds a
diploma in civil engineering from Government Polytechnic, Ambala City. He has
over 20 years of experience in the manufacturing and pharmaceutical business in
India. He is one of Promoters and one of the founders of Company.
Hitesh Windlass is the Managing Director of Company. He holds a bachelor’s
degree in ceramic engineering from the Indian Institute of Technology, Banaras
Hindu University, a master’s degree in science in materials science and
engineering from The Georgia Institute of Technology and a master’s degree in
business administration from the Graduate School of Business, University of
Chicago. He has set up our Domestic Trade Generics, OTC Brands and Exports
SBVs and plays a significant role in driving the technical operations, quality, R&D,
manufacturing strategy and financial strategy of our Company.
Manoj Kumar Windlass is the Joint Managing Director of Company. He holds a
bachelor’s degree in business administration from Georgia State University,
Atlanta. He has over 15 years of experience in product development, operations,
procurement and portfolio functions of the medicine business. He has set up
CDMO Services and Products SBV and plays a significant role in driving the
product portfolio decisions and overall commercial operations.
Pawan Kumar Sharma is an Executive Director of our Company. He holds a
bachelor’s degree in Law from the Hemwati Nandan Bahuguna Garhwal University,
Srinagar (Garhwal). He is responsible for the commercial and administrative
activities of the Company. He has over 20 years of experience in the
pharmaceutical industry.
Windlas Biotech Limited | IPO Note
August 3, 2021
4
Consolidated Profit & Loss Account
Y/E March (₹ Cr)
FY2019
FY2020
FY2021
Total operating income
307
329
428
% chg
-
7.0
30.0
Total Expenditure
269
287
373
Cost of Material Consumed
188
224
271
Changes in Inventories
4
(13)
4
Employee Benefit Expenses
43
44
58
Other Expenses
34
32
40
EBITDA
39
41
55
% chg
-
7.7
31.9
(% of Net Sales)
12.5
12.6
12.8
Depreciation& Amortisation
11
9
13
EBIT
27.9
32.2
41.7
% chg
-
15.2
29.7
(% of Net Sales)
9.1
9.8
9.8
Finance costs
4.8
2.5
1.3
Other income
4.3
2.5
3.1
(% of Sales)
1.4
0.8
0.7
Recurring PBT
27.3
32.1
43.5
% chg
-
17.5
35.5
Gain/loss in Joint Venture/associate
(0.8)
(7.5)
(0.2)
Exceptional item
49.5
-
(21.6)
Tax
12.3
8.5
6.2
PAT (reported)
63.8
16.2
15.6
% chg
-
(74.6)
(4.0)
(% of Net Sales)
20.8
4.9
3.6
Basic & Fully Diluted EPS (Rs)
3.5
8.9
8.6
Source: Company, Angel Research
Windlas Biotech Limited | IPO Note
August 3, 2021
5
Consolidated Balance Sheet
Y/E March (₹ Cr)
FY2019
FY2020
FY2021
SOURCES OF FUNDS
Equity Share Capital
6.4
6.4
6.4
Other equity (Retained Earning)
187.2
203.2
192.7
Shareholders Funds
193.6
209.7
199.1
Total Loans
22.9
22.2
30.2
Other liabilities
2.6
2.3
2.8
Total Liabilities
219.0
234.1
232.1
APPLICATION OF FUNDS
Property, Plant and Equipment
59.7
66.1
92.5
Capital work in Progress
4.6
-
0.0
Right of Use
4.2
3.6
3.0
Goodwill
-
-
-
Other Intangible Assets
0.4
0.6
0.5
Investments
101.5
94.0
-
Current Assets
120.5
168.0
194.3
Inventories
19.0
49.3
41.5
Investments
20.9
22.3
23.1
Trade Receivables
61.7
63.9
79.4
Cash and Cash Equivalents
12.9
18.1
15.9
Bank Balance other than cash and cash
equivalents
0.3
0.3
15.2
Other Financial Assets
0.1
0.1
0.5
Current Tax Assets (Net)
-
0.9
4.0
Other Current Assets
5.5
13.1
14.8
Current Liability
79.1
104.3
64.0
Net Current Assets
41.3
63.7
130.3
Other Non Current Asset
7.4
6.2
5.8
Total Assets
219.0
234.1
232.1
Source: Company, Angel Research
Windlas Biotech Limited | IPO Note
August 3, 2021
6
Consolidated Cash Flow Statement
Y/E March (₹ Cr)
FY2019
FY2020
FY2021
Operating profit before working capital changes
42.2
42.0
58.0
Net changes in working capital
(11.5)
(3.5)
(40.0)
Cash generated from operations
30.7
38.4
18.0
Direct taxes paid (net of refunds)
(12.1)
(13.4)
(6.5)
Net cash flow (used in)/from operating activities
18.7
25.0
11.5
Purchase of property, plant & equipment
(9.0)
(15.3)
(5.8)
Interest received
0.7
0.9
1.7
Others
3.0
0.1
(16.0)
Cash Flow from Investing
(5.3)
(14.3)
(20.2)
Proceeds/(Repayment) of Short-Term Borrowings
(4.4)
3.9
8.5
Share Issue Expense
-
0
(1.3)
Proceeds from issue of equity shares
4.8
-
-
Repayment of Long-Term Borrowings
(1.3)
(6.3)
(4.6)
Repayment of Lease liabilities (principal portion)
(0.4)
(0.4)
(0.5)
Interest paid (including interest on lease liabilities)
(5.0)
(2.5)
(1.4)
Cash Flow from Financing
(6.2)
(5.4)
0.8
Inc./(Dec.) in Cash
7.2
5.2
(8.0)
Opening Cash balances
7.2
12.9
18.1
Cash acquired on acquisition
(1.5)
-
5.8
Closing Cash balances
12.9
18.1
15.9
Source: Company, Angel Research
Key Ratio
Y/E March
FY2019
FY2020
FY2021
Valuation Ratio (x)
P/E (on FDEPS)
130.6
51.7
53.8
P/CEPS
11.3
32.8
29.4
P/BV
4.3
4.0
4.2
EV/Sales
2.8
2.6
2.0
EV/EBITDA
22.0
20.3
15.6
Per Share Data (Rs)
EPS (Basic)
3.52
8.9
8.6
EPS (fully diluted)
3.5
8.9
8.6
Cash EPS
40.9
14.0
15.7
Book Value
106.3
115.2
109.4
Returns (%)
ROE
33.0
7.7
7.8
ROCE
12.7
13.7
18.0
Turnover ratios (x)
Receivables (days)
73.3
71.0
67.8
Inventory (days)
22.6
54.7
35.4
Payables (days)
-
-
-
Working capital cycle (days)
95.9
125.7
103.2
Source: Company, Angel Research

Windlas Biotech Limited | IPO Note
August 3, 2021
7
DISCLAIMER
Angel Broking Limited (hereinafter referred to as “Angel”) is a registered Member of National Stock Exchange of India Limited, Bombay
Stock Exchange Limited and Metropolitan Stock Exchange Limited. It is also registered as a Depository Participant with CDSL and
Portfolio Manager and investment advisor with SEBI. It also has registration with AMFI as a Mutual Fund Distributor. Angel Broking
Limited is a registered entity with SEBI for Research Analyst in terms of SEBI (Research Analyst) Regulations, 2014 vide registration
number INH000000164. Angel or its associates has not been debarred/ suspended by SEBI or any other regulatory authority for
accessing /dealing in securities Market. Angel or its associates/analyst has not received any compensation / managed or co-managed
public offering of securities of the company covered by Analyst during the past twelve months.
This document is solely for the personal information of the recipient, and must not be singularly used as the basis of any investment
decision. Nothing in this document should be construed as investment or financial advice. Each recipient of this document should
make such investigations as they deem necessary to arrive at an independent evaluation of an investment in the securities of the
companies referred to in this document (including the merits and risks involved), and should consult their own advisors to determine
the merits and risks of such an investment.
Reports based on technical and derivative analysis center on studying charts of a stock's price movement, outstanding positions and
trading volume, as opposed to focusing on a company's fundamentals and, as such, may not match with a report on a company's
fundamentals. Investors are advised to refer the Fundamental and Technical Research Reports available on our website to evaluate the
contrary view, if any.
The information in this document has been printed on the basis of publicly available information, internal data and other reliable
sources believed to be true, but we do not represent that it is accurate or complete and it should not be relied on as such, as this
document is for general guidance only. Angel Broking Limited or any of its affiliates/ group companies shall not be in any way
responsible for any loss or damage that may arise to any person from any inadvertent error in the information contained in this report.
Angel Broking Limited has not independently verified all the information contained within this document. Accordingly, we cannot testify,
nor make any representation or warranty, express or implied, to the accuracy, contents or data contained within this document. While
Angel Broking Limited endeavors to update on a reasonable basis the information discussed in this material, there may be regulatory,
compliance, or other reasons that prevent us from doing so.
This document is being supplied to you solely for your information, and its contents, information or data may not be reproduced,
redistributed or passed on, directly or indirectly.
Neither Angel Broking Limited, nor its directors, employees or affiliates shall be liable for any loss or damage that may arise from or in
connection with the use of this information.
