1
For Private Circulation Only
Technical and Derivatives Review |March 10, 2023
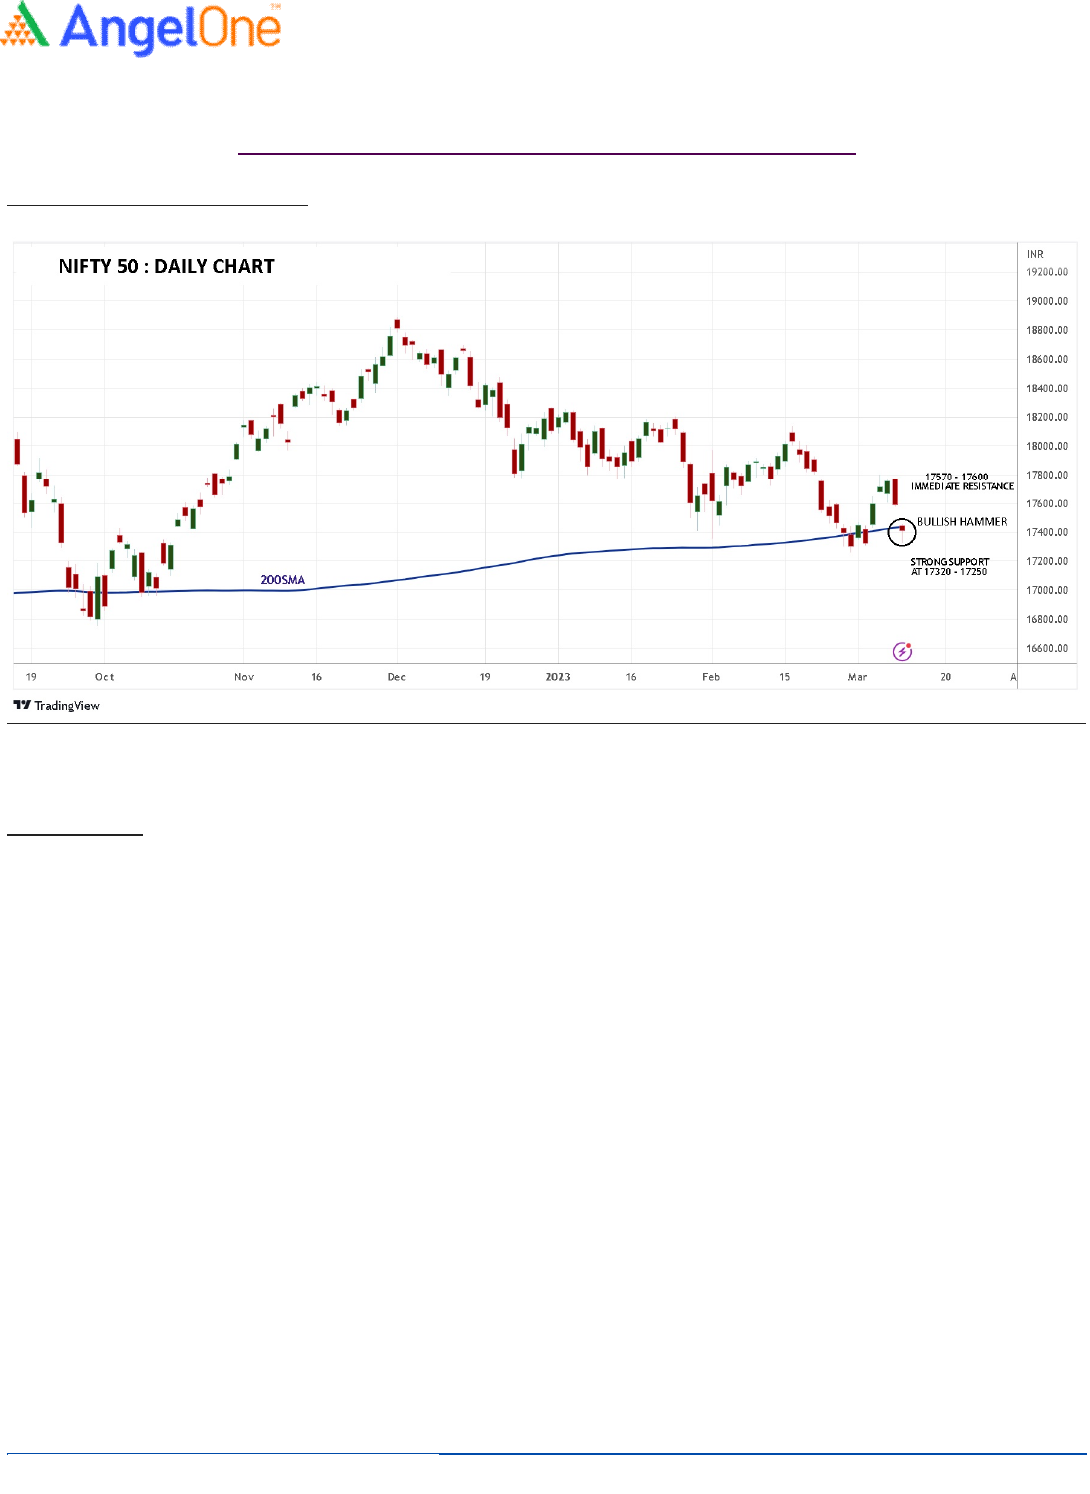
Weak global cues turned culprit to spoil market sentiments
Sensex (59135) / Nifty (17413)
Source: Tradingview.com
Future outlook
Following the strong closing of the previous week, we had a spectacular start to the week with a gap-up opening. The positive
momentum continued to retest 17800; however, ahead of the mid-week holiday, some profit booking was seen at higher levels. In
the following trading session, despite a bleak opening, the bulls remained in commanding positions. After repeatedly failing to cross
17800, we witnessed a sharp sell-off during the last two sessions to retest sub-17350 levels. Eventually after some respite, Nifty
ended a tad above 17400 with a weekly loss of a percent.
During the week, the sell-off was triggered as Nifty failed to cross a key technical level of 17800, which is the 61.8% retracement of
the recent down move. However, considering the recent positive development and head start to the week, we were of the view that
Nifty would surpass the hurdle to reclaim 18000. Now, with two back-to-back weak sessions, the momentum is again in favour of
bears. Despite this, we remain a bit hopeful and expect important levels to remain unbroken in coming week; especially after seeing
prices showing resilience around the 200-SMA and forming a key technical pattern known as ‘Bullish Hammer’. It would however be
very early to jump to any conclusion and considering the recent volatility, traders should ideally wait for the trend to establish. In
such a scenario, Friday’s low around 17320 would be seen as immediate support followed by sacrosanct support at February's swing
low of 17250. On the flip side, the bearish gap left around 17570 – 17600 should be considered as immediate hurdles. In our sense,
instead of swaying on both sides of the trend, traders should ideally prefer staying light on positions and keep accumulating quality
propositions in a staggered manner.
The weak global cues and underperforming heavyweights (especially Reliance) were the major culprits in dragging our markets
down. Going ahead, it would be crucial to keep a close tab on them as any positive development globally, can elevate the overall
sentiments. Also, Nifty Midcap 100 outperformed as this index ended the week in green, forming a ‘hammer’ pattern around the
recent trend line breakout levels. If the markets find some relief, we may see many midcap counters giving mesmerizing move.
Traders are advised to focus on such counters that are likely to provide better trading opportunities.
2
For Private Circulation Only
Technical and Derivatives Review |March 10, 2023
Sho
rt Form
at
ion
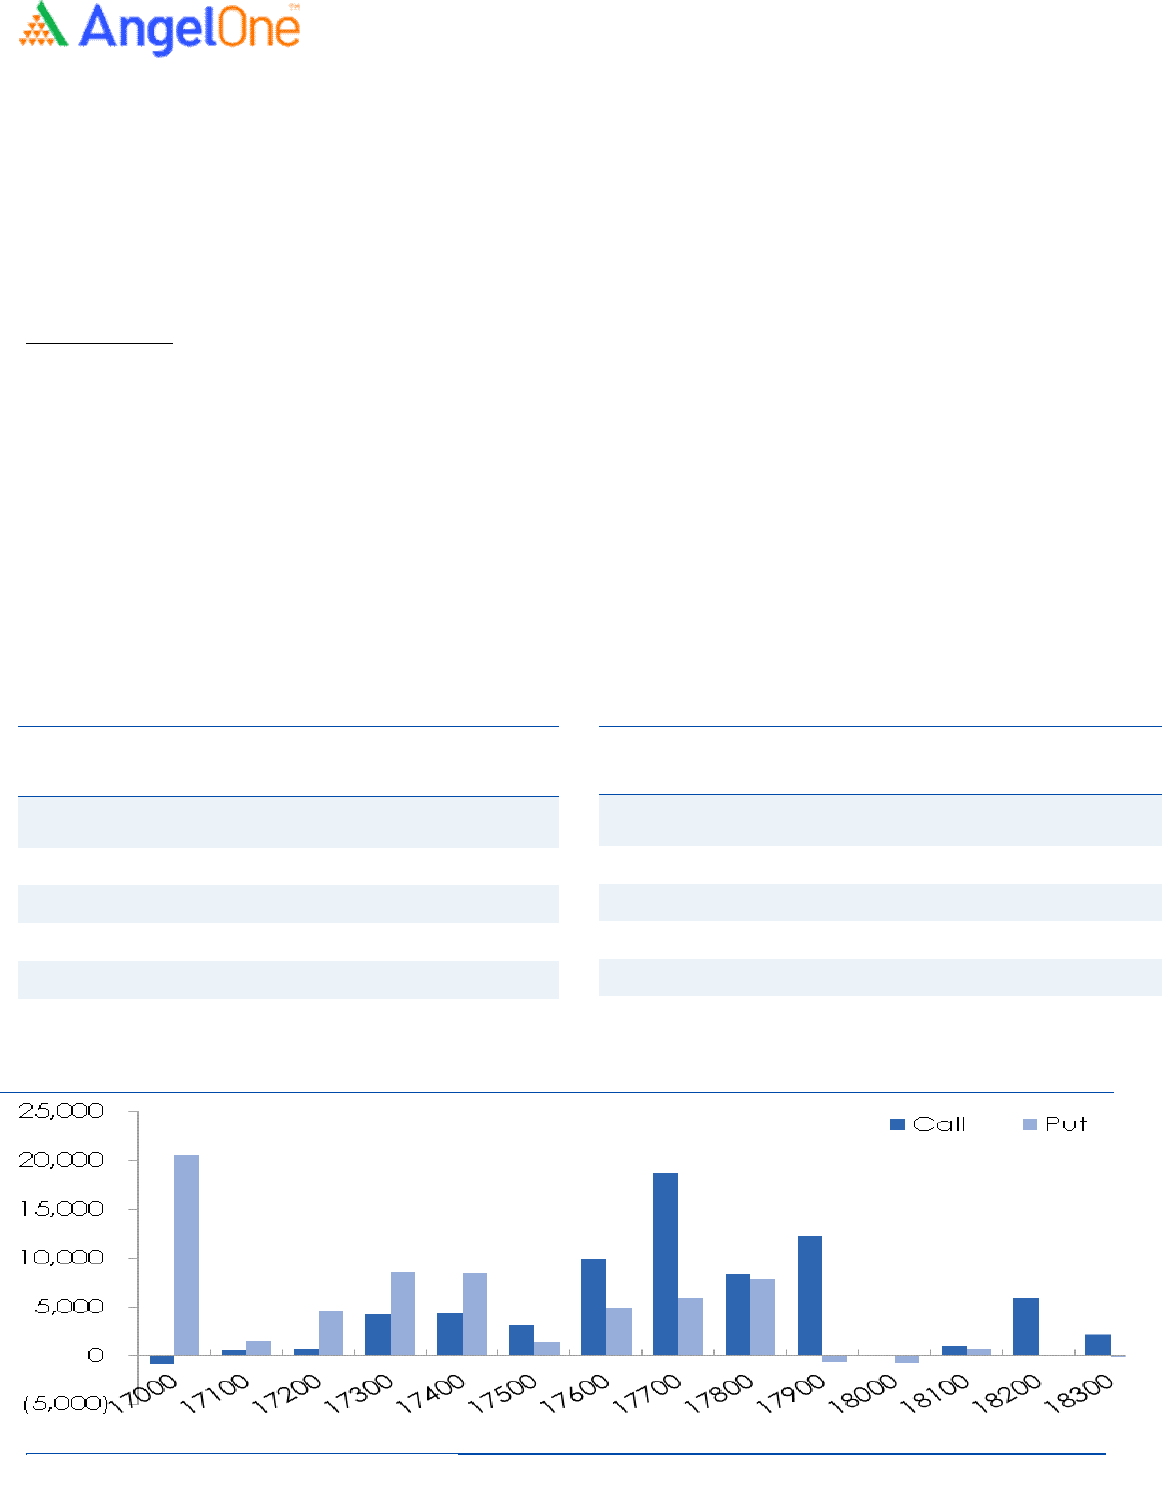
F&O data indicates market to be in an oversold region
Nifty spot closed at 17412.90 this week, against a close of 17594.35 last week. The Put-Call Ratio has decreased from 1.17 to 0.89 on
Weekly basis. The annualized Cost of Carry is positive at 4.37%. The Open Interest of Nifty Futures increased by 8.94%.
Derivatives View
Nifty current month’s future closed with a premium of 39.65 against a premium of 77.20 points to its spot in the previous week.
Next month’s future is trading at a premium of 147.15 points.
It was a roller coaster ride for our market, as we kickstarted the week on a promising note. But the last two sessions not only pared
down the initial gains but dented the overall sentiments, with Nifty shedding over a percent on a weekly basis. In the F&O space, we
witnessed short addition in both key indices on a WoW basis. While on the options front, a decent piling of OI is seen at the 17400
put strike, followed by 17300 PE, indicating nearby support for Nifty. On the flip side, the 17500-call strike has the highest OI
concentration, implying an immediate hurdle. Meanwhile, the stronger hands have added shorts in the system, leading the ‘Long
Short Ratio’ to plunge to 16% from 23% WoW. Considering the mentioned data, the market seems a bit oversold, and any short
covering shall be an encouraging sign.
Scrip
OI
Futures
OI
Chg (%)
Price
Price
Chg(%)
RBLBANK 30585000 15.59 155.15 (7.48)
POLYCAB 1248900 13.06 2907.55 (5.12)
CROMPTON 6286500 12.75 298.10 (4.84)
BAJFINANCE 5421125 11.40 5887.20 (3.86)
LALPATHLAB 942500 9.82 1832.20 (6.33)
Weekly change in OI
Long Formation
Scrip
OI
Futures
OI
Chg (%)
Price
Price
Chg(%)
BALRAMCHIN 8147200 40.59 400.20 8.82
MGL 2849600 36.74 991.35 8.76
RECLTD 55768000 23.27 123.00 3.40
PFC 61386200 17.24 167.50 7.20
NTPC 92659200 16.01 181.10 4.20

3
For Private Circulation Only
Technical and Derivatives Review |March 10, 2023
Sameet Chavan Chief Analyst – Technical & Derivatives sameet.chavan@angelone.in
Sneha Seth Senior Analyst – Technical & Derivatives sneha.seth@angelone.in
Rajesh Bhosale Technical Analyst rajesh.bhosle@angelone.in
Osho Krishan Senior Analyst – Technical & Derivatives osho.krishan@angelone.in
Research Team Tel: 022 - 39357600 Website: www.angelone.in
For Technical Queries E-mail: technicalresearch-cso@angelone.in
For Derivative Queries E-mail: derivatives.desk@angelone.in
DISCLAIMER
Angel One Limited (hereinafter referred to as “Angel”) is a registered Member of National Stock Exchange of India Limited, Bombay
Stock Exchange Limited and Metropolitan Stock Exchange Limited. It is also registered as a Depository Participant with CDSL and
Portfolio Manager and investment advisor with SEBI. It also has registration with AMFI as a Mutual Fund Distributor. Angel One
Limited is a registered entity with SEBI for Research Analyst in terms of SEBI (Research Analyst) Regulations, 2014 vide registration
number INH000000164. Angel or its associates has not been debarred/ suspended by SEBI or any other regulatory authority for
accessing /dealing in securities Market.
This document is solely for the personal information of the recipient, and must not be singularly used as the basis of any investment
decision. Nothing in this document should be construed as investment or financial advice. Each recipient of this document should
make such investigations as they deem necessary to arrive at an independent evaluation of an investment in the securities of the
companies referred to in this document (including the merits and risks involved), and should consult their own advisors to determine
the merits and risks of such an investment.
Angel or its associates or research analyst or his relative may have actual/beneficial ownership of 1% or more in the securities of the
subject company at the end of the month immediately preceding the date of publication of the research report. Neither Angel or its
associates nor Research Analysts or his relative has any material conflict of interest at the time of publication of research report.
Angel or its associates might have received any compensation from the companies mentioned in the report during the period
preceding twelve months from the date of this report for services in respect of managing or co-managing public offerings, corporate
finance, investment banking or merchant banking, brokerage services or other advisory service in a merger or specific transaction in
the normal course of business. Angel or its associates did not receive any compensation or other benefits from the companies
mentioned in the report or third party in connection with the research report. Neither Angel nor its research analyst entity has been
engaged in market making activity for the subject company.
Reports based on technical and derivative analysis center on studying charts of a stock's price movement, outstanding positions and
trading volume, as opposed to focusing on a company's fundamentals and, as such, may not match with a report on a company's

4
For Private Circulation Only
Technical and Derivatives Review |March 10, 2023
fundamentals. Investors are advised to refer the Fundamental and Technical Research Reports available on our website to evaluate
the contrary view, if any.
The information in this document has been printed on the basis of publicly available information, internal data and other reliable
sources believed to be true, but we do not represent that it is accurate or complete and it should not be relied on as such, as this
document is for general guidance only. Angel One Limited or any of its affiliates/ group companies shall not be in any way
responsible for any loss or damage that may arise to any person from any inadvertent error in the information contained in this
report. Angel One Limited has not independently verified all the information contained within this document. Accordingly, we cannot
testify, nor make any representation or warranty, express or implied, to the accuracy, contents or data contained within this
document. While Angel One Limited endeavors to update on a reasonable basis the information discussed in this material, there
may be regulatory, compliance, or other reasons that prevent us from doing so.
This document is being supplied to you solely for your information, and its contents, information or data may not be reproduced,
redistributed or passed on, directly or indirectly.
Neither Angel One Limited, nor its directors, employees or affiliates shall be liable for any loss or damage that may arise from or in
connection with the use of this information. Angel or its associates or Research Analyst or his relative might have financial interest in
the subject company. Research analyst has not served as an officer, director or employee of the subject company.
