Technical Picks | March 5, 2016
Nifty may take a breather at 7550, but avoid shorting
Sensex (24646) / Nifty (7485)
The market was inflicted with high volatility as it started the
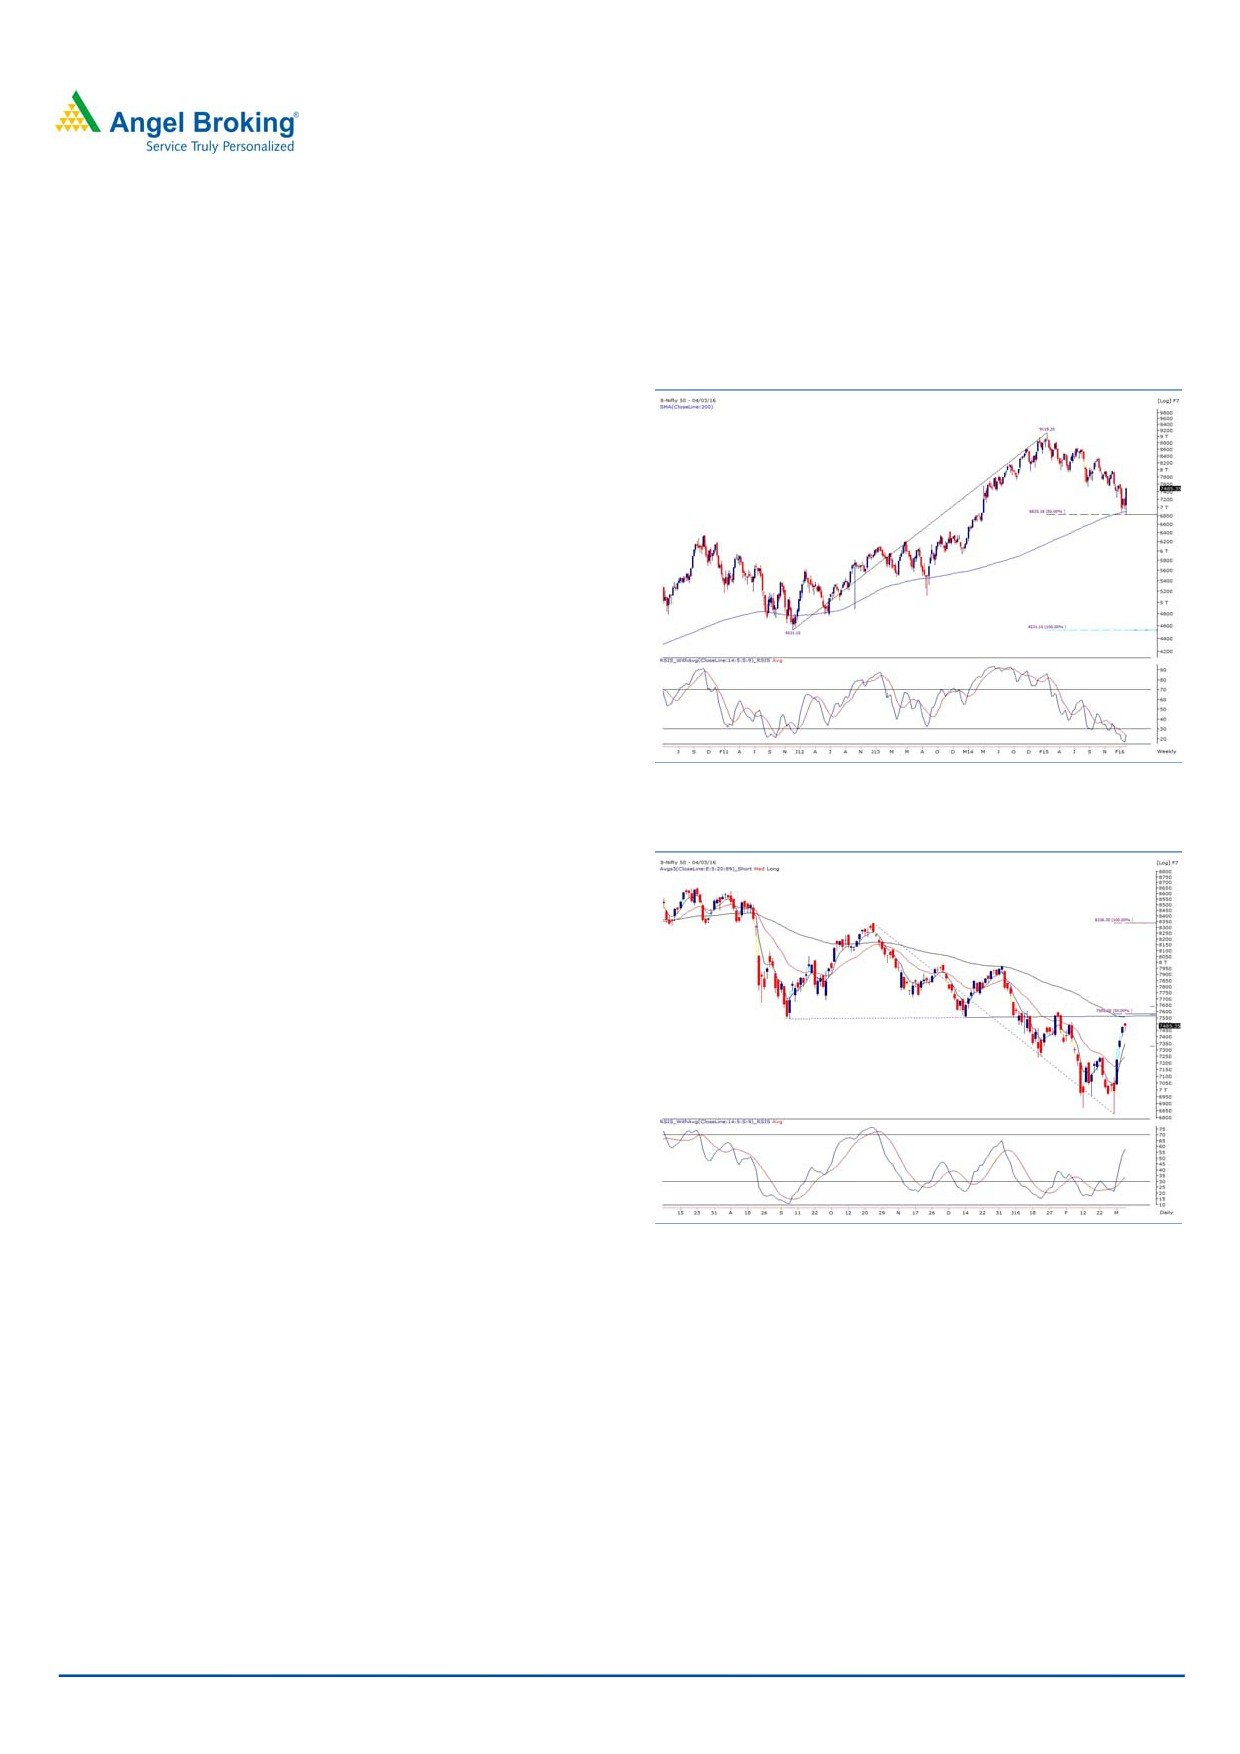
Exhibit 1: Nifty Weekly chart
proceedings for the week at the backdrop of the
announcement of Union Budget 2016-17. The Nifty had a
rollercoaster move on Monday with it making a 52-week low
of 6825.80. But post the conclusion of the budget speech, it
underwent a sharp recovery from the lower levels and
managed to offset a major portion of the day’s losses to
finally close just a tad below the 7000 mark. The bullishness
spilled over Tuesday with the Nifty opening gap up and the
same was followed by a tremendous intraday rally. The
upward momentum got accelerated further in the following
sessions; in the process, the Nifty surpassed the 7500 mark.
The index eventually ended the week with an enormous gain
of 6.48% over the previous week’s closing, which is the
biggest weekly gain in the last four years.
Source: Company, Angel Research
Pattern formation:
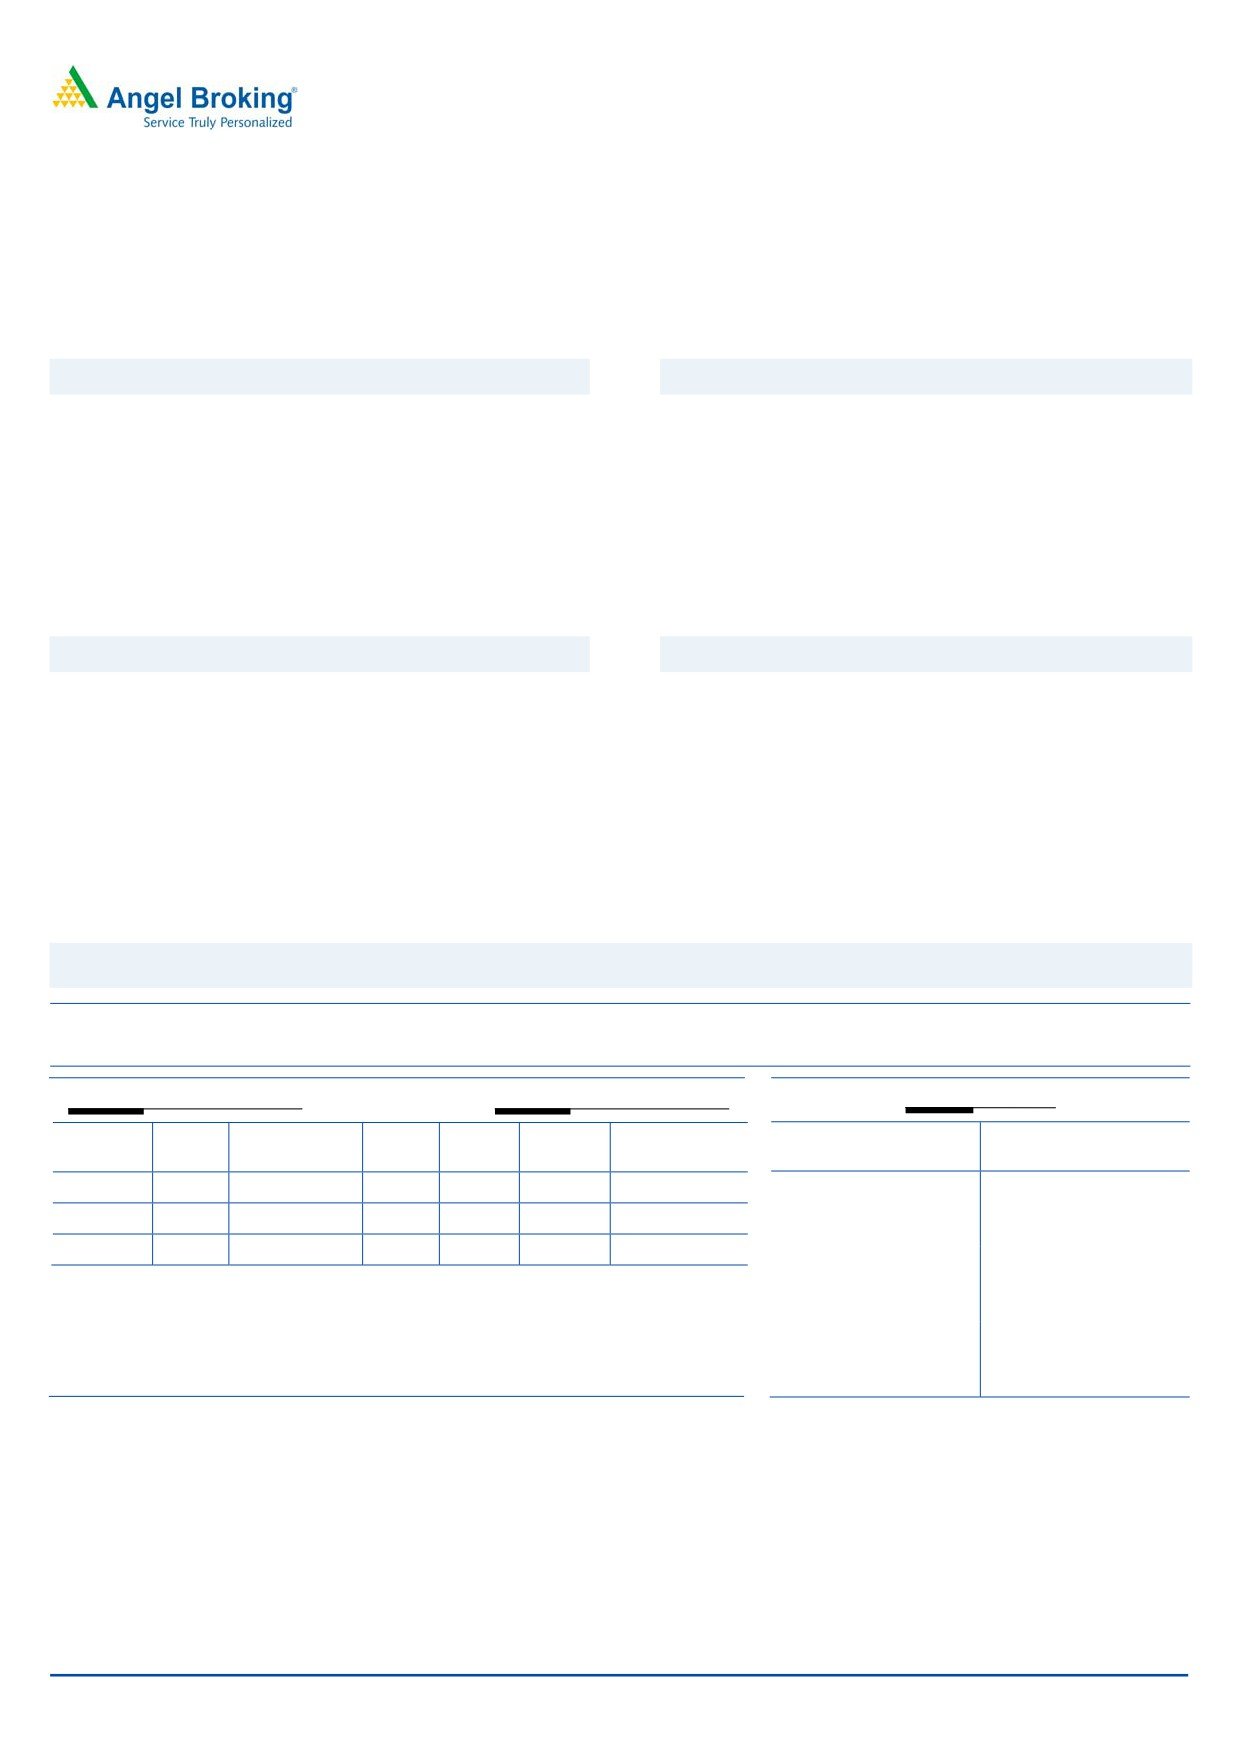
Exhibit 2: Nifty Daily chart
The ’89-day EMA’ and the ’89-week EMA’ for the
Sensex/Nifty are placed at
24869
/
7555 and
25646 / 7755 levels, respectively.
The ’20-day EMA’ and the ‘20-week EMA’ for the
Sensex/Nifty are placed at
23852
/
7247 and
24995 / 7592 levels, respectively.
Future outlook
The concluded week was clearly dominated by the bulls
wherein the Nifty rallied by around 10% from its Monday’s
intraday low. Market participants have taken the budget in
the positive vein and it is now being anticipated that the RBI
Source: Company, Angel Research
might initiate further cuts in the interest rate. During the
week, the Nifty took support at the 50% retracement level of
Considering multiple resistances, a minor pull back cannot
the entire up move from 4531.15 to 9119.20, which also
be ruled out although the overall view remains positive. We
coincides with the ‘200 SMA’ on the weekly chart. Also, we
advise traders not to get carried away in the anticipated
witnessed a positive divergence of the ‘RSI-smoothened’
corrective price action and suggest towards remaining light
oscillator on the daily chart. The up move was in line of our
on positions until there is a decisive development on the
anticipation and we were vocal about the same in our daily
charts. Going forward, if the Nifty manages to overcome
reports. The short term downtrend of the Nifty got negated
the 7600 mark, then we may see an extension of the up
as it formed ‘Higher Highs’ on the daily chart after a period
move towards 7750 - 7800 levels; whereas 7300 - 7250
of four months. At the current juncture, the Nifty is trading
zone on the downside would now act as a crucial support for
near its resistance of 7550 (previous breakdown level) on
the Nifty.
the daily chart, which coincides with the ‘89 DEMA’ and 50%
retracement level of the previous down move from 8336.30
to 6825.80.
For Private Circulation Only
1
Technical Picks | March 5, 2016
Weekly Pivot Levels For Nifty 50 Stocks
SCRIPS
S2
S1
PIVOT
R1
R2
SENSEX
21729
23188
23953
25412
26178
NIFTY
6592
7039
7272
7719
7952
NIFTY BANK
12688
14014
14733
16058
16777
ACC
1139
1189
1224
1275
1310
ADANIPORTS
183
204
217
238
250
AMBUJACEM
179
191
197
209
215
ASIANPAINT
813
839
868
894
923
AXISBANK
358
387
403
432
448
BAJAJ-AUTO
2115
2211
2267
2363
2420
BANKBARODA
118
133
143
158
168
BHEL
84
96
102
114
120
BPCL
709
762
790
843
871
BHARTIARTL
299
314
325
341
352
BOSCH
15969
16613
17022
17666
18075
CAIRN
106
117
125
136
144
CIPLA
489
513
529
554
570
COALINDIA
298
312
320
333
341
DRREDDY
2866
3060
3171
3364
3476
GAIL
268
305
327
363
385
GRASIM
3156
3336
3433
3613
3711
HCLTECH
761
798
832
870
904
HDFC
982
1055
1096
1169
1209
HDFCBANK
894
957
991
1054
1088
HEROMOTOCO
2334
2585
2722
2973
3110
HINDALCO
61
70
76
85
91
HINDUNILVR
803
826
841
864
879
ICICIBANK
166
193
209
236
252
IDEA
99
102
106
109
113
INDUSINDBK
760
838
880
957
999
INFY
1019
1095
1144
1220
1268
ITC
240
278
306
343
372
KOTAKBANK
556
611
640
695
725
LT
986
1090
1157
1260
1328
LUPIN
1641
1710
1765
1834
1889
M&M
1139
1177
1229
1267
1319
MARUTI
3011
3283
3465
3737
3919
NTPC
113
120
124
131
135
ONGC
171
186
203
218
236
POWERGRID
126
132
136
142
146
PNB
65
74
79
88
93
RELIANCE
903
955
986
1038
1069
SBIN
140
164
177
201
214
SUNPHARMA
810
833
857
881
904
TCS
2012
2185
2288
2461
2564
TATAMOTORS
269
306
328
365
386
TATAPOWER
55
57
58
61
62
TATASTEEL
229
259
275
305
321
TECHM
384
418
441
474
497
ULTRACEMCO
2549
2728
2869
3048
3189
VEDL
62
75
82
95
103
WIPRO
491
514
531
554
572
YESBANK
624
692
731
798
837
ZEEL
348
372
388
412
429
Technical Research Team
For Private Circulation Only
2
Derivatives Review | March 5, 2016
Liquidity flowing in our market; stay long.
Nifty spot closed at 7485.35 this week, against a close of 7029.75 last week. The Put-Call Ratio has increased from 0.82 to 1.00
levels and the annualized Cost of Carry is negative at 4.51%. The Open Interest of Nifty Futures increased by 21.78%.
Put-Call Ratio Analysis
Implied Volatility Analysis
PCR-OI has increased from 0.82 to 1.00 levels mainly due
Implied Volatility (IV) for NIFTY has decreased from
to huge OI addition in put options. 7000-7400 strikes of
19.64% to 15.19%. Historical volatility (HV) of NIFTY is at
put options added significant OI, while IV’s plunged more
27.61% and that for BANKNIFTY is at 37.64%. Liquid
than 400 bps indicating short formation. In call options,
counters having very high HV are ITC, MARUTI,
7400-7800 strikes added good amount of build-up.
HEROMOTOCO, ONGC and ICICIBANK. Stocks where
Maximum build-up in current series is seen in 7500 call
HV are on lower side are EICHERMOT, LUPIN, MARICO,
options and 7000 put options.
CROMPGREAV and JISLJALEQS.
Open Interest Analysis
Cost-of-Carry Analysis
Total open interest of market has increased from
Nifty current month futures closed at a discount of 25.00
`1,68,030/- cr. to `2,12,493/- cr. Stock futures open
points against a premium of 25.40 points to its spot. Next
interest has increased from `50,078/- cr. to `56,552/- cr.
month future is trading with premium of 2.40 points.
Large cap names which added significant positions last
Liquid counters where CoC is high are IDFC, HINDALCO,
week are ONGC, HEROMOTOCO, CIPLA, COALINDIA
JINDALSTEL, LT and CIPLA. Stocks with negative CoC are
and JINDALSTEL. On the other hand unwinding was visible
COALINDIA, BAJAJ-AUTO, HEROMOTOCO, TECHM and
in counters like GAIL, BANKBARODA, PNB, BAJAJ-AUTO
TATASTEEL.
and POWERGRID.
Derivative Strategy
Scrip: BHEL
CMP : `107.50
Lot Size : 2000
Exercise Date (F & O) :
31st Mar 2016
View: Mildly Bullish
Strategy: Long Call Ladder.
Expected Payoff
Buy/Sell
Qty
Scrip
Strike
Series
Option
Buy/Sell Rate
Closing Price
Expected
Price
Type
(`)
(`)
Profit/Loss
BUY
2000
BHEL
110
MAR
CE
4.00
95
(`2.00)
SELL
2000
BHEL
120
MAR
CE
1.50
105
(`2.00)
SELL
2000
BHEL
130
MAR
CE
0.50
115
`3.00
LBEP - `112
UBEP - `138
125
`8.00
Max. Risk: Unlimited
Max. Profit: `16,000
If BHEL continues to move above UBEP on expiry
If BHEL closes between `120-`130 levels on
135
`3.00
expiry.
145
(`7.00)
NOTE: Profit can be booked before expiry if BHEL moves in favourable direction and time value decays.
For Private Circulation Only
3
Research Team Tel: 022 - 39357800
DISCLAIMER
Angel Broking Private Limited (hereinafter referred to as “Angel”) is a registered Member of National Stock Exchange of India Limited,
Bombay Stock Exchange Limited and Metropolitan Stock Exchange of India Limited. It is also registered as a Depository Participant with
CDSL and Portfolio Manager with SEBI. It also has registration with AMFI as a Mutual Fund Distributor. Angel Broking Private Limited is
a registered entity with SEBI for Research Analyst in terms of SEBI (Research Analyst) Regulations, 2014 vide registration number
INH000000164. Angel or its associates has not been debarred/ suspended by SEBI or any other regulatory authority for accessing
/dealing in securities Market. Angel or its associates including its relatives/analyst do not hold any financial interest/beneficial
ownership of more than 1% in the company covered by Analyst. Angel or its associates/analyst has not received any compensation /
managed or co-managed public offering of securities of the company covered by Analyst during the past twelve months. Angel/analyst
has not served as an officer, director or employee of company covered by Analyst and has not been engaged in market making activity
of the company covered by Analyst.
This document is solely for the personal information of the recipient, and must not be singularly used as the basis of any investment
decision. Nothing in this document should be construed as investment or financial advice. Each recipient of this document should
make such investigations as they deem necessary to arrive at an independent evaluation of an investment in the securities of the
companies referred to in this document (including the merits and risks involved), and should consult their own advisors to determine
the merits and risks of such an investment.
Reports based on technical and derivative analysis center on studying charts of a stock's price movement, outstanding positions and
trading volume, as opposed to focusing on a company's fundamentals and, as such, may not match with a report on a company's
fundamentals.
The information in this document has been printed on the basis of publicly available information, internal data and other reliable
sources believed to be true, but we do not represent that it is accurate or complete and it should not be relied on as such, as this
document is for general guidance only. Angel Broking Pvt. Limited or any of its affiliates/ group companies shall not be in any way
responsible for any loss or damage that may arise to any person from any inadvertent error in the information contained in this report.
Angel Broking Pvt. Limited has not independently verified all the information contained within this document. Accordingly, we cannot
testify, nor make any representation or warranty, express or implied, to the accuracy, contents or data contained within this document.
While Angel Broking Pvt. Limited endeavors to update on a reasonable basis the information discussed in this material, there may be
regulatory, compliance, or other reasons that prevent us from doing so.
This document is being supplied to you solely for your information, and its contents, information or data may not be reproduced,
redistributed or passed on, directly or indirectly.
Neither Angel Broking Pvt. Limited, nor its directors, employees or affiliates shall be liable for any loss or damage that may arise from
or in connection with the use of this information.
Note: Please refer to the important ‘Stock Holding Disclosure' report on the Angel website (Research Section). Also, please refer to the
latest update on respective stocks for the disclosure status in respect of those stocks. Angel Broking Pvt. Limited and its affiliates may
have investment positions in the stocks recommended in this report.
For Private Circulation Only
4