TOP PICKS REPORT
D E C E M B E R
2015
Research Team
Angel Top Picks - December 2015
The domestic benchmark equity market indices - Sensex and Nifty - ended the month
of November 2015 in the negative territory, correcting by 1.9% and 1.6%, respectively.
A higher possibility of the Federal Reserve increasing interest rates in December 2015,
as perceived by the market, dampened market sentiments.
In November 2015, among sectoral indices, the top two gainers were the BSE
Consumer Durables Index and the BSE Auto Index, which rose by 5.0% and 4.4%,
respectively. Among the top losers were the BSE Healthcare Index and the BSE Realty
Index, which fell by 9.8% and 2.0%, respectively. Foreign Institutional Investors (FIIs)
were net seller in Indian equities to the tune of ~`7,074cr and Domestic Institutional
Investors (DIIs) were net buyers in Indian equities to the tune of ~`6,548cr, for the
month of November 2015.
During the month, the BSE Midcap index has outperformed the broader market indices.
We believe mid-cap companies having strong fundamentals have the potential to
outperform the broader market, going forward as well. We are replacing Inox Wind
with Blue Star in our top picks recommendation.
We expect some volatility in the market, ahead of the upcoming review of interest
rates in the US. However, any positive outcome in terms of passing of the Goods and
Services Tax (GST) bill in the winter session of the parliament would be a positive for
the market. Further, declining interest rates, lower current account deficit and
expectation of a stable currency would create positive sentiment for market.
Large Cap
Company
Sector
CMP Target Upside
EPS
PER
EV/Sales
ROE
(`)
(`)
(%)
FY16
FY17
FY16
FY17
FY16
FY17
FY16
FY17
Amara Raja
Auto & Auto Ancill.
846
1,040
23.0
28.8
37.1
29.4
22.8
2.9
2.4
23.4
24.1
Ashok Leyland
Auto & Auto Ancill.
90
111
23.2
3.4
4.7
26.5
19.2
1.4
1.1
17.7
22.2
Axis Bank
Financials
462
630
36.3
35.7
43.5
12.9
10.6
0.0
0.0
17.9
18.9
HCL Tech
IT
841
1,132
34.7
55.8
62.9
15.1
13.4
2.4
1.9
23.0
19.8
HDFC Bank
Financials
1,062
1,262
18.8
49.3
61.0
21.5
17.4
0.0
0.0
18.5
19.7
ICICI Bank
Financials
263
354
34.5
21.0
24.4
12.5
10.8
0.0
0.0
14.4
14.7
Infosys
IT
1,046
1,306
24.9
58.3
63.7
17.9
16.4
3.3
2.8
20.9
19.7
Larsen & Toubro
Construction
1,341
1,646
22.8
61.5
65.6
21.8
20.4
2.1
1.8
13.4
14.0
LIC Housing Finance Financials
462
571
23.5
33.0
40.2
14.0
11.5
0.0
0.0
19.7
20.5
Source: Angel Broking
Mid Cap
Company
Sector
CMP Target Upside
EPS
PER
EV/Sales
ROE
(`)
(`)
(%)
FY16
FY17
FY16
FY17
FY16
FY17
FY16
FY17
Blue Star
Capital Goods
357
429
20.3
13.7
17.2
26.0
20.8
1.0
0.8
26.1
25.4
Ipca labs
Pharmaceuticals
757
900
18.9
13.4
28.0
56.5
27.0
3.1
2.7
7.4
14.0
Jagran Prakashan Media
146
169
15.6
8.9
9.9
16.4
14.8
2.1
1.9
20.9
20.4
MT Educare
Others
140
169
21.0
7.7
9.4
18.2
15.0
1.9
1.4
20.2
21.1
Radico Khaitan
Others
109
156
43.6
5.7
7.1
19.1
15.3
1.4
1.3
8.3
9.5
Siyaram Silk Mills
Others
1,165
1,354
16.3
89.9
104.1
13.0
11.2
0.8
0.7
17.9
17.8
Surya Roshni
Others
135
183
36.0
14.7
18.3
9.2
7.3
0.5
0.4
9.7
11.0
Source: Angel Broking
December 8, 2015
Please refer to important disclosures at the end of this report.
1
Top Picks Report
December 2015
Top Picks - Large Cap
December 8, 2015
Please refer to important disclosures at the end of this report.
2
Top Picks Report
December 2015
Stock Info
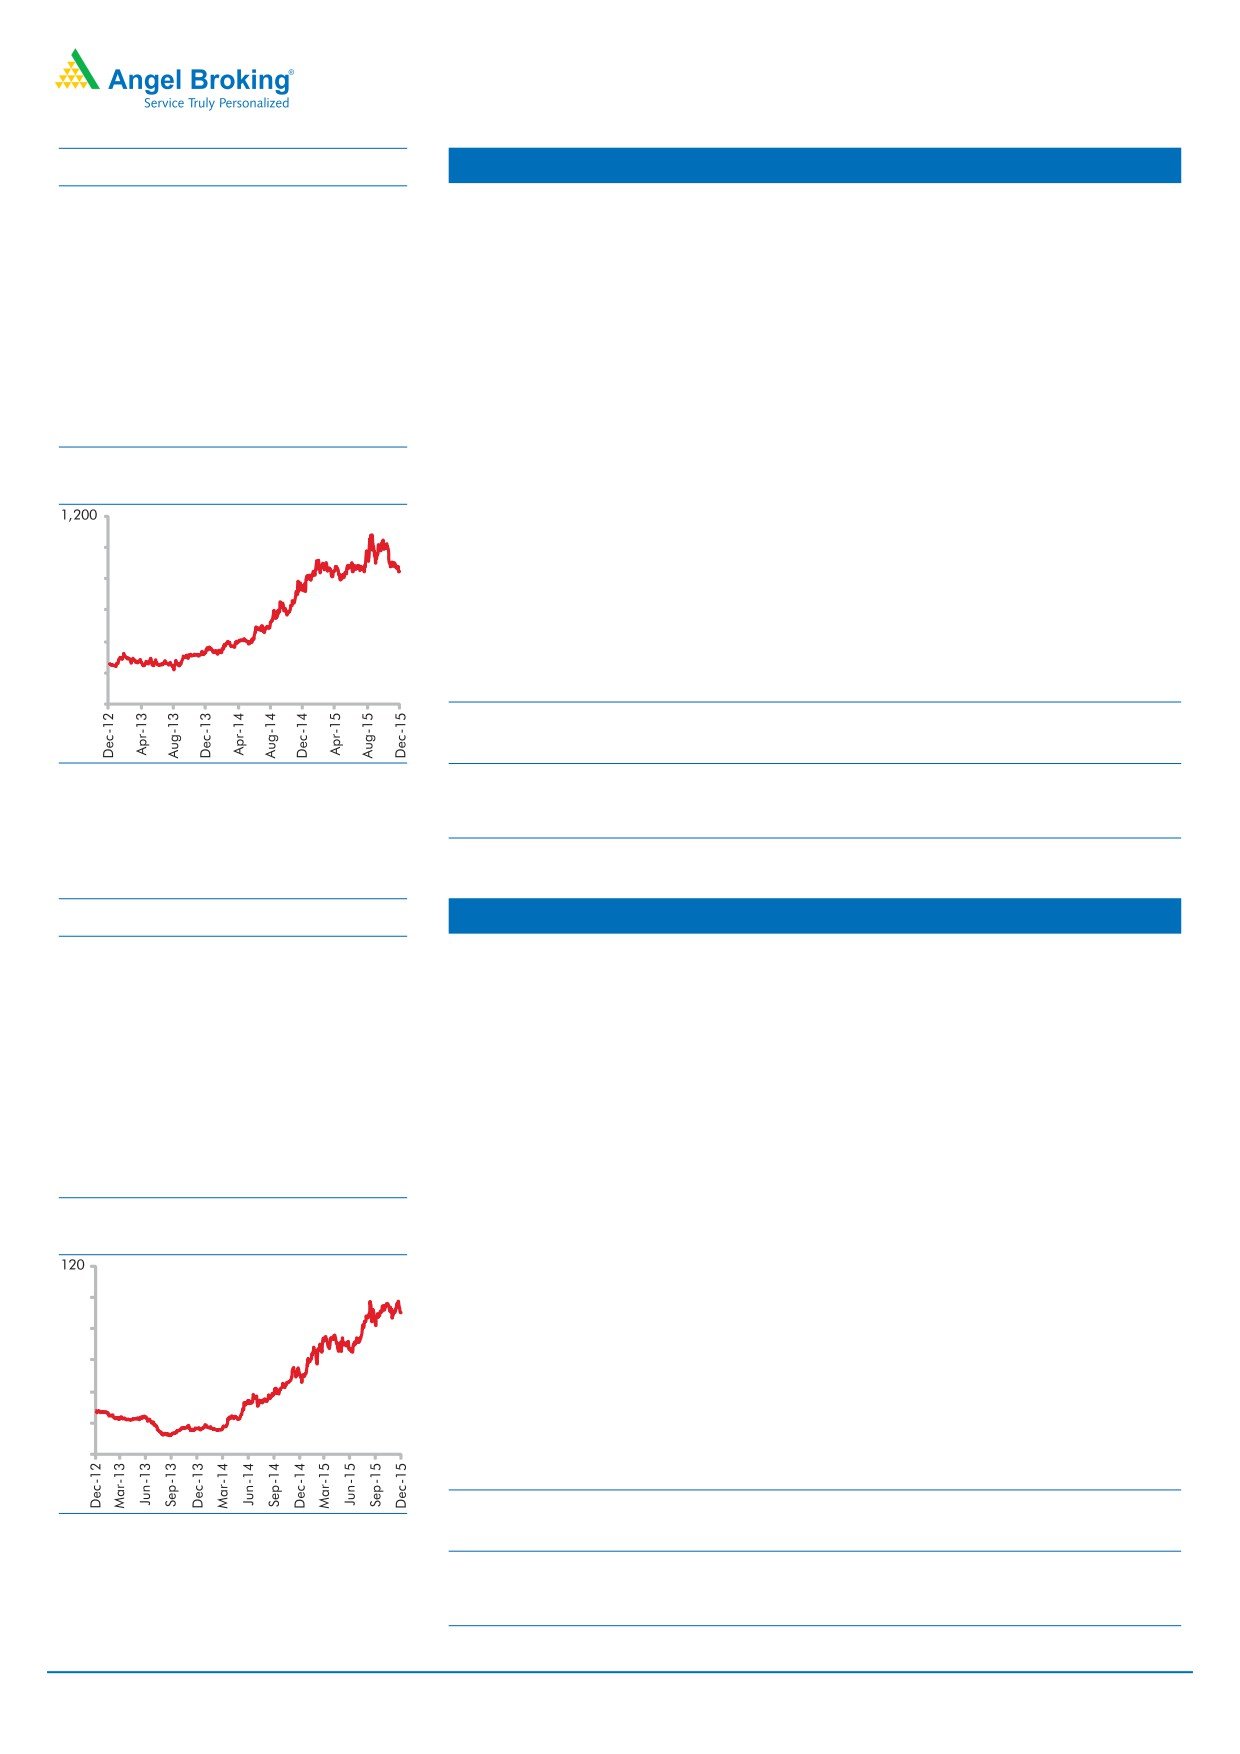
Amara Raja Batteries
CMP (`)
846
Amara Raja Batteries Ltd (ARBL) is the second largest lead acid storage battery
TP (`)
1,040
manufacturer. ARBL has been outpacing market leader Exide (ARBL grew 24%
Upside
23%
CAGR over FY2010-15 as compared to Exide's growth of 13%), leading to market
share improving from 25% in FY10 to about current 35% . ARBL's outperformance
Sector
Auto ancillary
is mainly due to market share gains in automotive segment driven by introduction
Market Cap (` cr)
10,469
of technologically superior products developed with technological support from
Beta
0.9
global battery leader Johnson Controls Inc (which also holds 26% stake in ARBL).
52 Week High / Low
1,132/709
With the automotive OEM policy of having multiple vendors and a strong brand
recall in the replacement segment, ARBL is well poised to further gain market share.
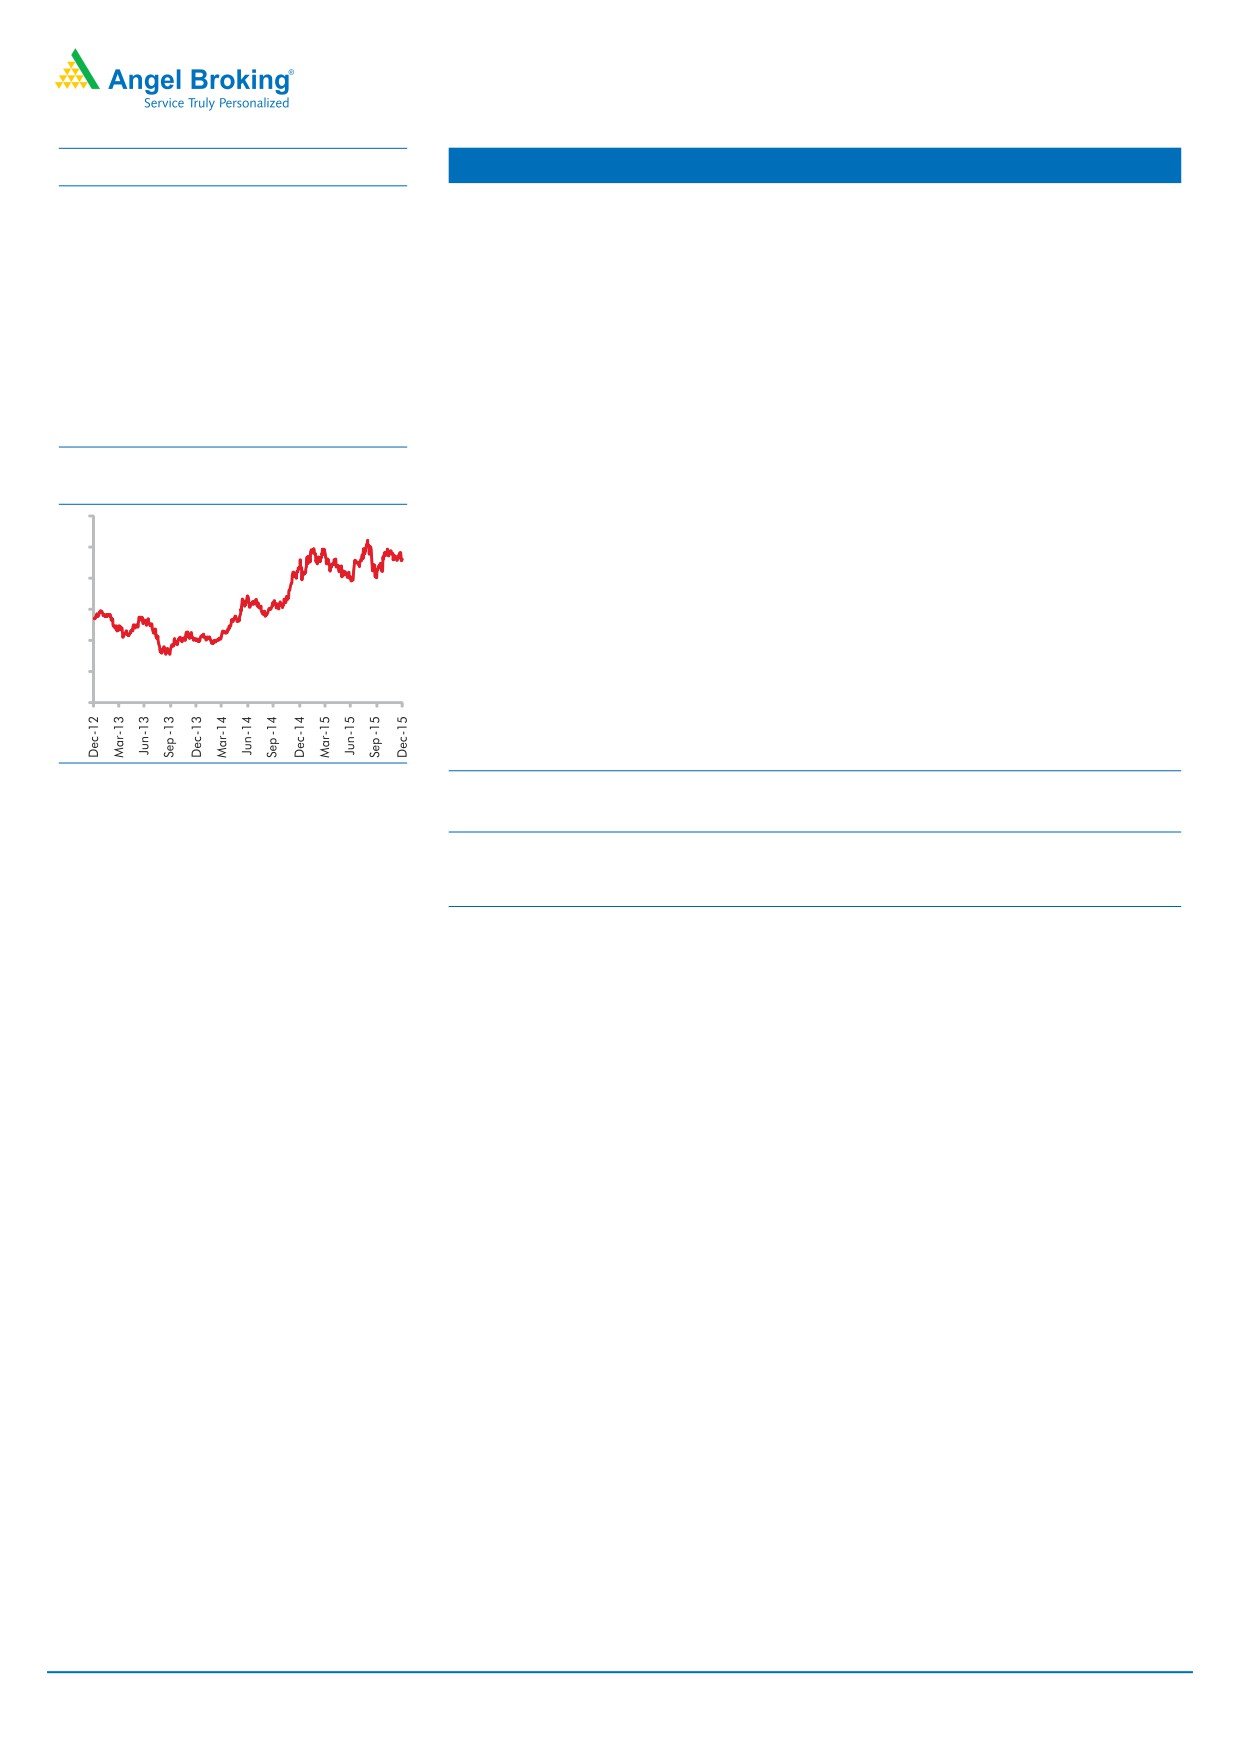
3 year-Chart
Given the economic recovery and market share gains, ARBL revenues are likely to
grow strongly 18% over the next two years as against industry growth of 10-12%.
1,000
ARBL is a well diversified auto ancillary player having presence across the automotive
800
and the industrial segment and a broad OEM as well as replacement customer
600
base. We believe ARBL is a high quality stock to play the auto sector revival. We
400
assign a P/E multiple of 28x to FY2017E earnings and arrive at a target price of
200
`1,040/share.
0
Y/E
Sales OPM PAT
EPS
RoE
P/E P/BV EV/EBITDA EV/Sales
March
(` cr)
(%)
(` cr)
(`)
( %)
(x)
(x)
(x)
(x)
Source: Company, Angel Research
FY2016E
4,892
17.4
492
28.8
23.4
29.4
6.9
16.8
2.9
FY2017E
5,871
17.6
634
37.1
24.1
22.8
5.5
13.6
2.4
Stock Info
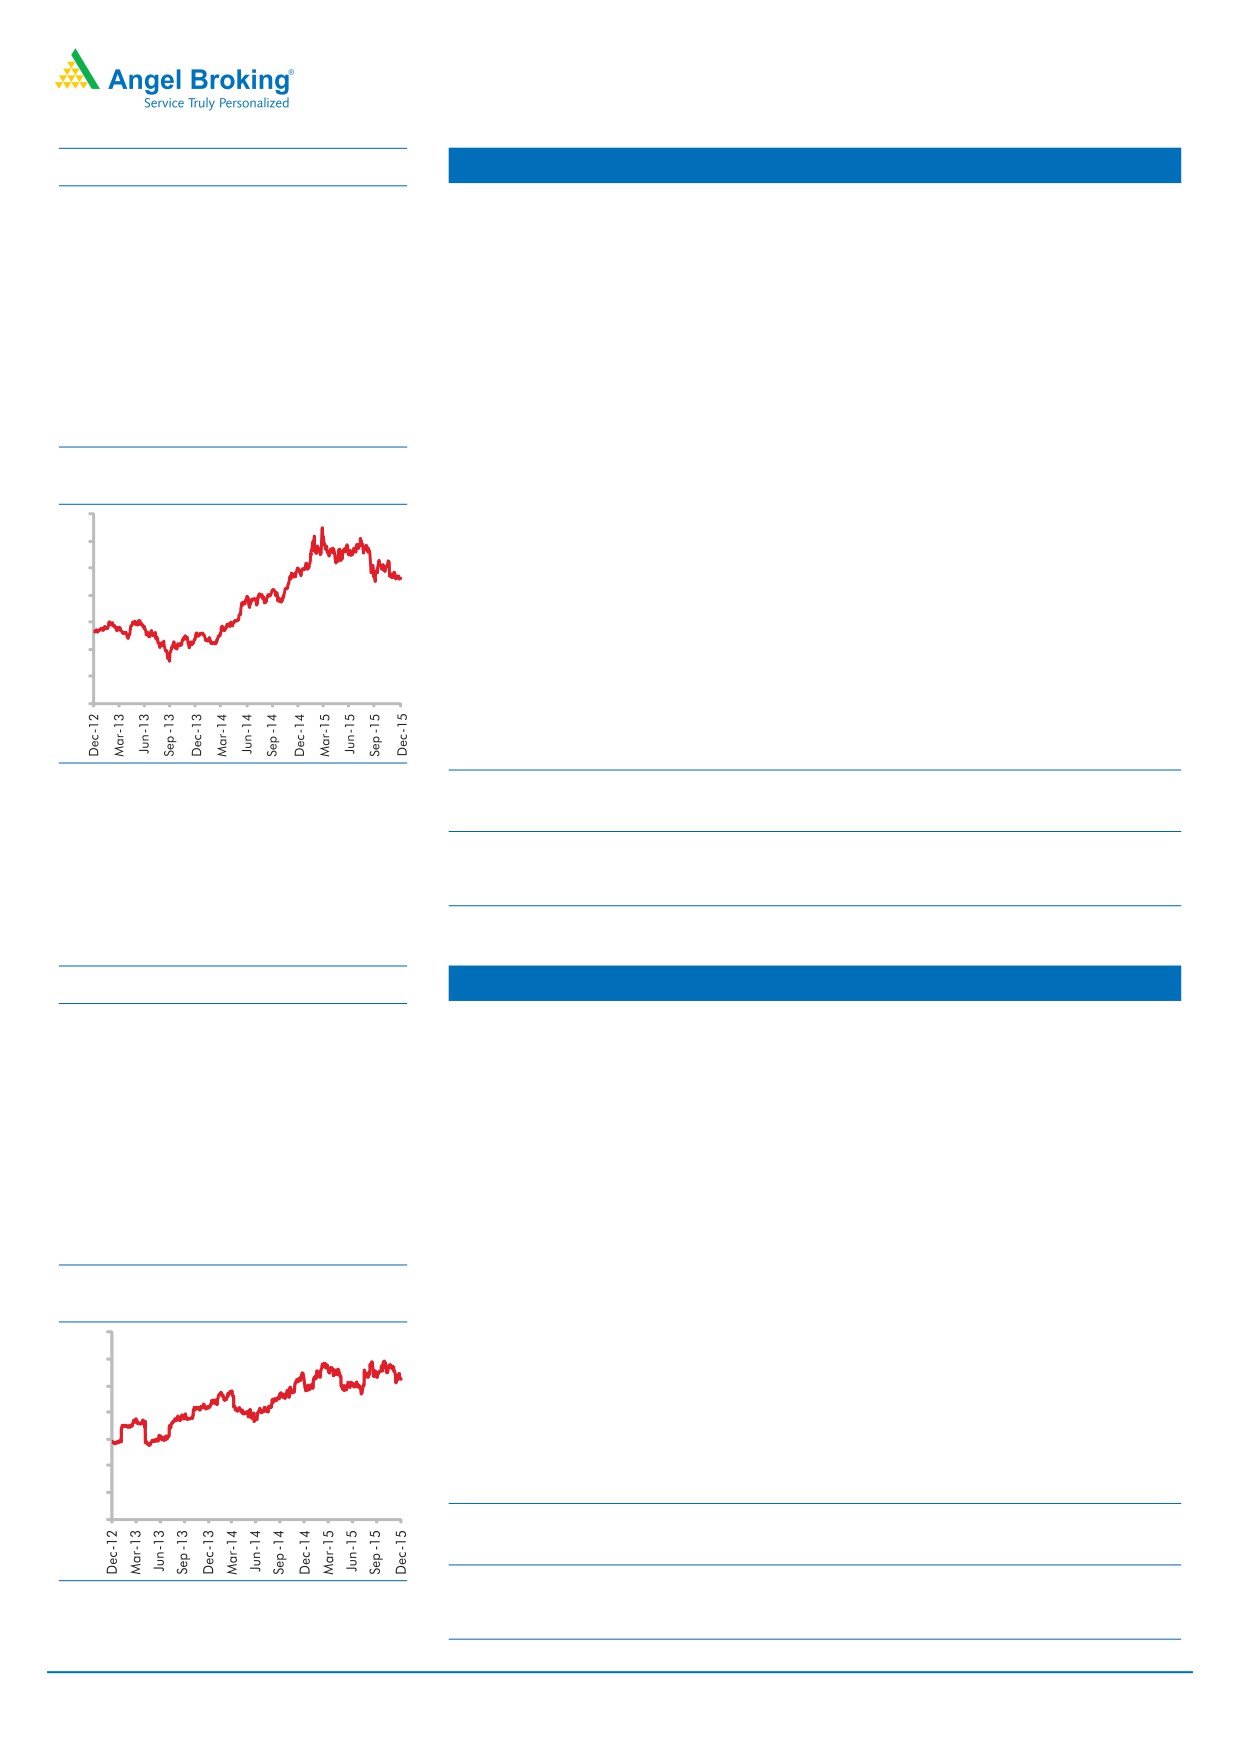
Ashok Leyland
CMP (`)
90
Ashok Leyland Ltd (ALL) is the second largest medium and heavy commercial vehicle
TP (`)
111
(MHCV) manufacturer in the country, commanding a market share of about 28%.
The MHCV segment is in an upcycle, given the uptick in economic growth which
Upside
23%
should result in better freight movement. Further, improvement in fleet operators
Sector
Automobile
profitability on account of firm freight rates and decline in diesel prices has led to
Market Cap (` cr)
25,641
huge pent up demand getting converted into sales. We expect the MHCV segment
Beta
1.3
to post a 15% CAGR over FY2015-2018, thereby benefiting ALL.
In order to reduce cyclicality, ALL is also focusing on increasing light commercial
52 Week High / Low
100/43
vehicles (LCVs) and exports. ALL-Nissan JV developed LCV - "Dost" has been received
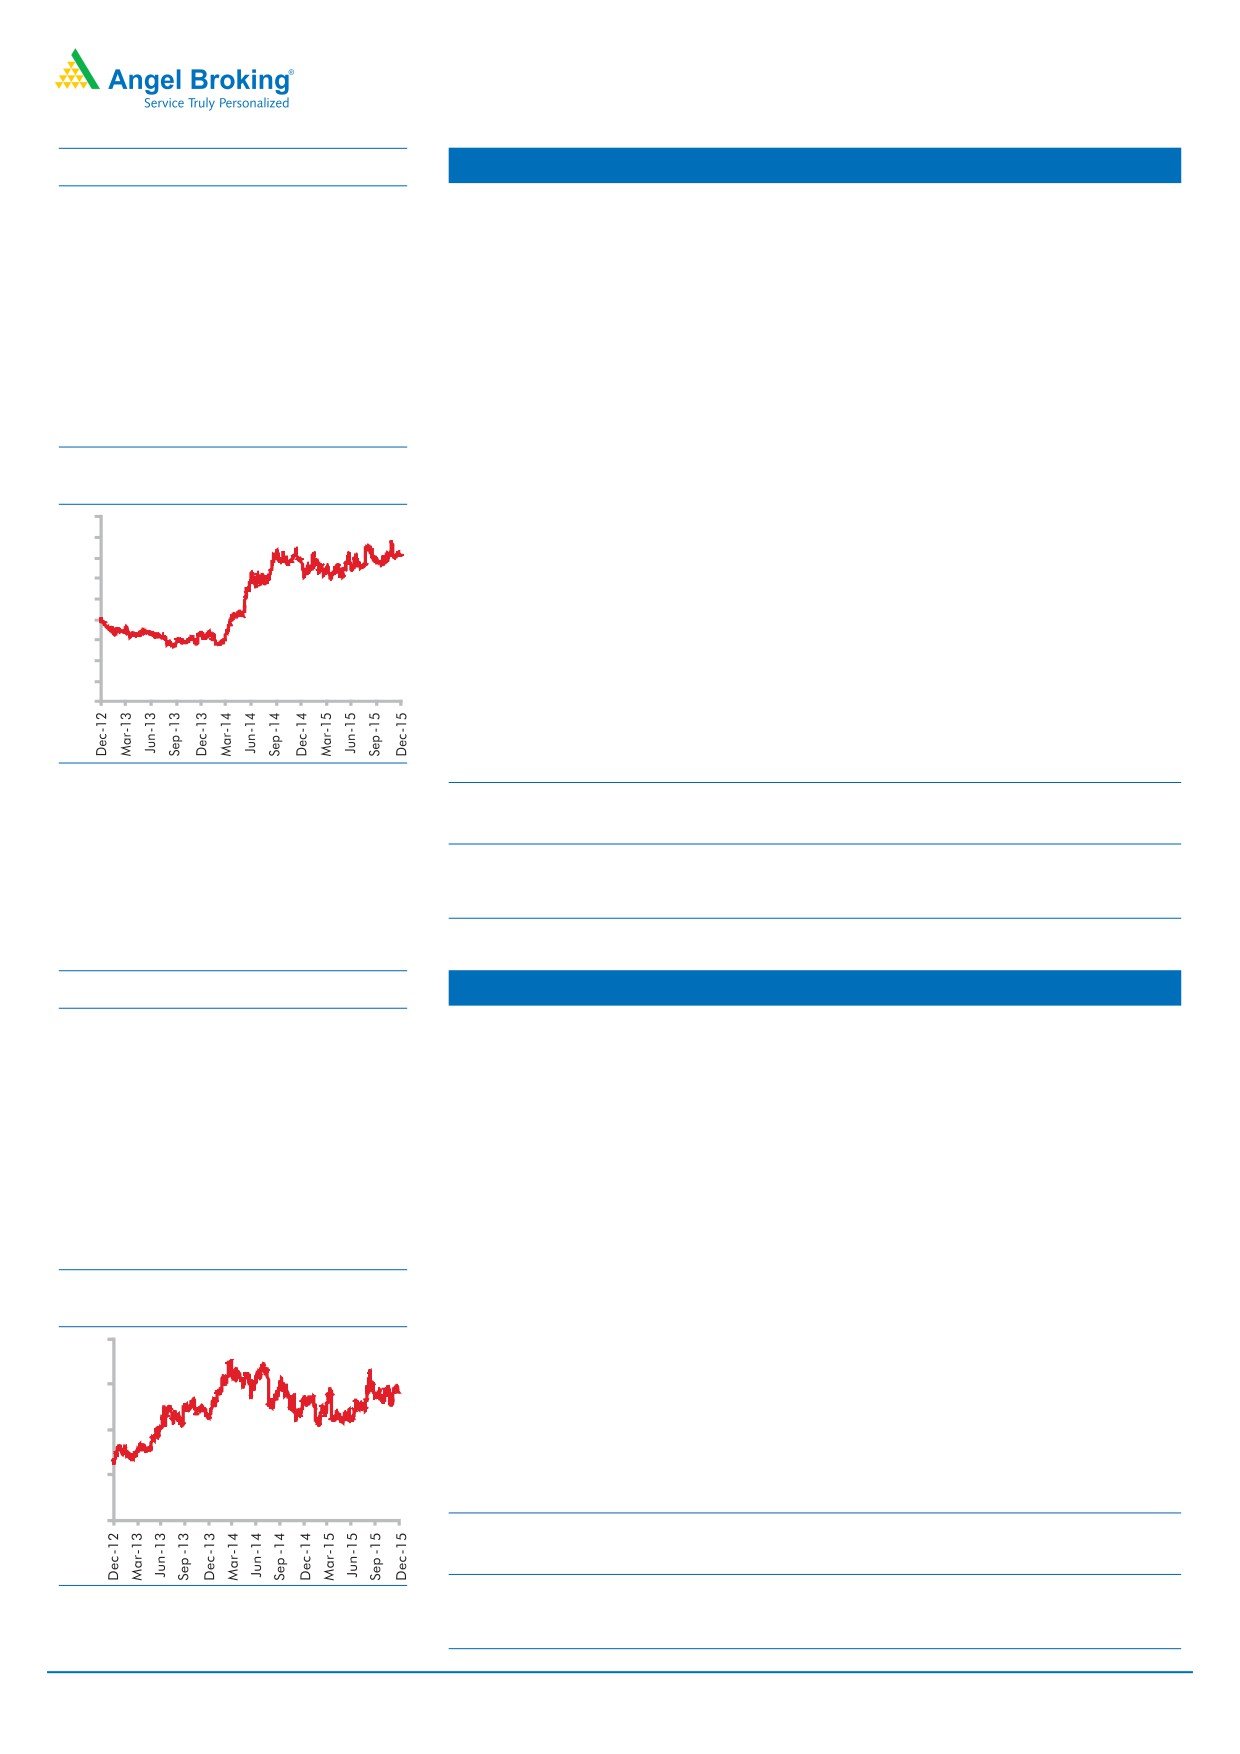
3 year-Chart
well and has captured a market share of 6% within three years of its launch. Also,
ALL is targeting new markets in Africa and Middle East to increase export contribution
100
from the current 15% to 33% over the next five years.
80
ALL's margins are likely to improve 400 bp yoy over FY2015-17 period on account
60
of double-digit growth in MHCVs and reduced discounting.
40
We are positive on ALL, given the cyclical upturn in MHCVs and on account of
20
additional growth avenues. We assign EV/EBIDTA multiple of 13x to FY2017E
0
EBIDTA to arrive at a target price of `111/share.
Y/E
Sales OPM PAT
EPS
RoE
P/E P/BV EV/EBITDA EV/Sales
Source: Company, Angel Research
March
(` cr)
(%)
(` cr)
(`)
( %)
(x)
(x)
(x)
(x)
FY2016E
17,995
11.4
979
3.4
17.7
26.5
4.6
13.3
1.4
FY2017E
21,544
11.6
1,331
4.7
22.2
19.2
4.3
10.7
1.1
December 8, 2015
Please refer to important disclosures at the end of this report.
3
Top Picks Report
December 2015
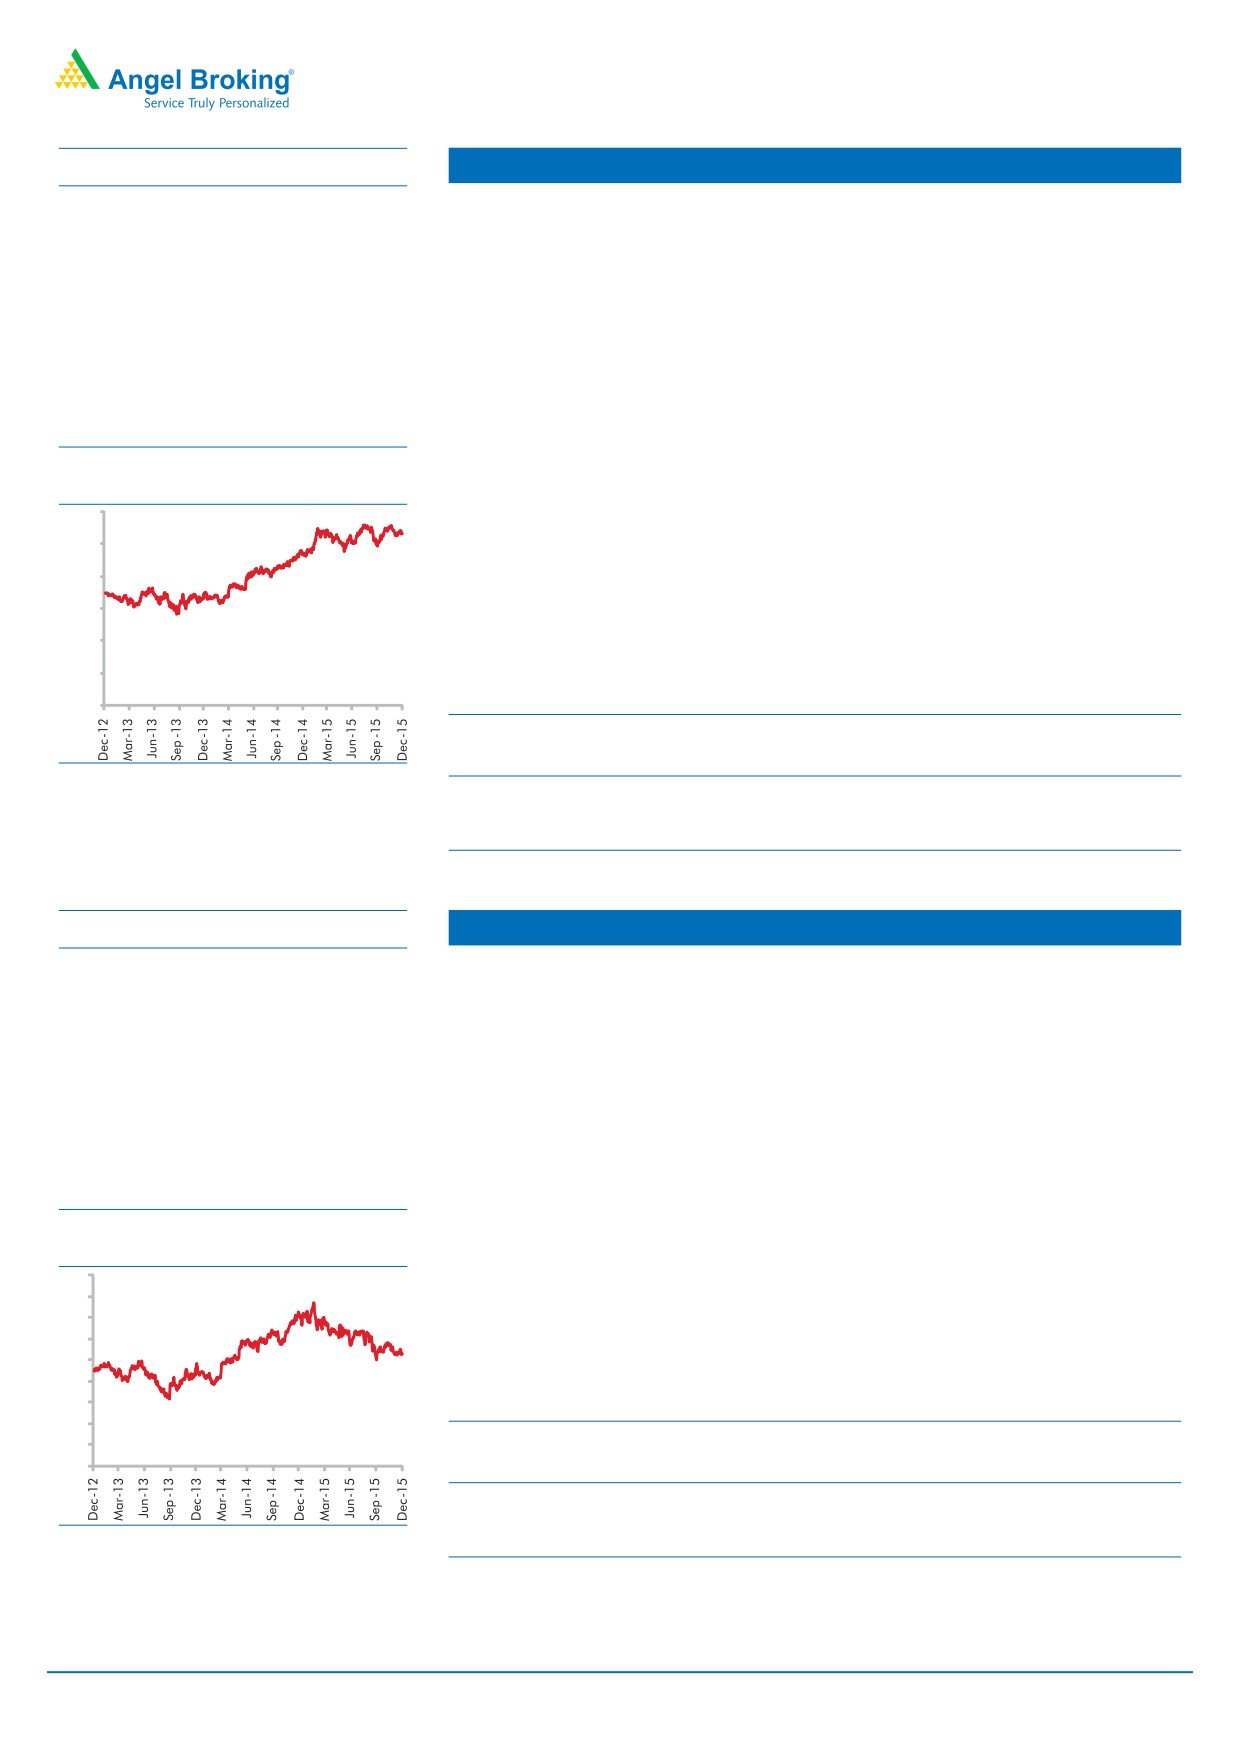
Stock Info
Axis Bank
CMP (`)
462
Consistent earnings growth along with expansion: The bank has been reporting
TP (`)
630
robust NII growth, backed by strong retail loan growth, coupled with healthy growth
in CASA deposits. Over the past five years, Axis Bank has expanded its branch
Upside
36%
network at around 21.2% CAGR (~2,743 branches as of 2QFY2016). In its deposit
Sector
Banking
mix as well, CASA and Retail Term Deposits now comprise a healthy 80%. Retail
Market Cap (` cr)
109,853
advances to total advances stands at ~40% as of 2015 against ~20% in FY2011.
Beta
1.4
Healthy Asset quality: Sectors like engineering, iron & steel, infrastructure (including
power) and textile have contributed a large part of the stressed assets for the banking
52 Week High / Low
655/446
industry. While Axis Bank's exposure to these sectors is at around 17%, the bank has
been able to manage its asset quality relatively better than its public sector peers and
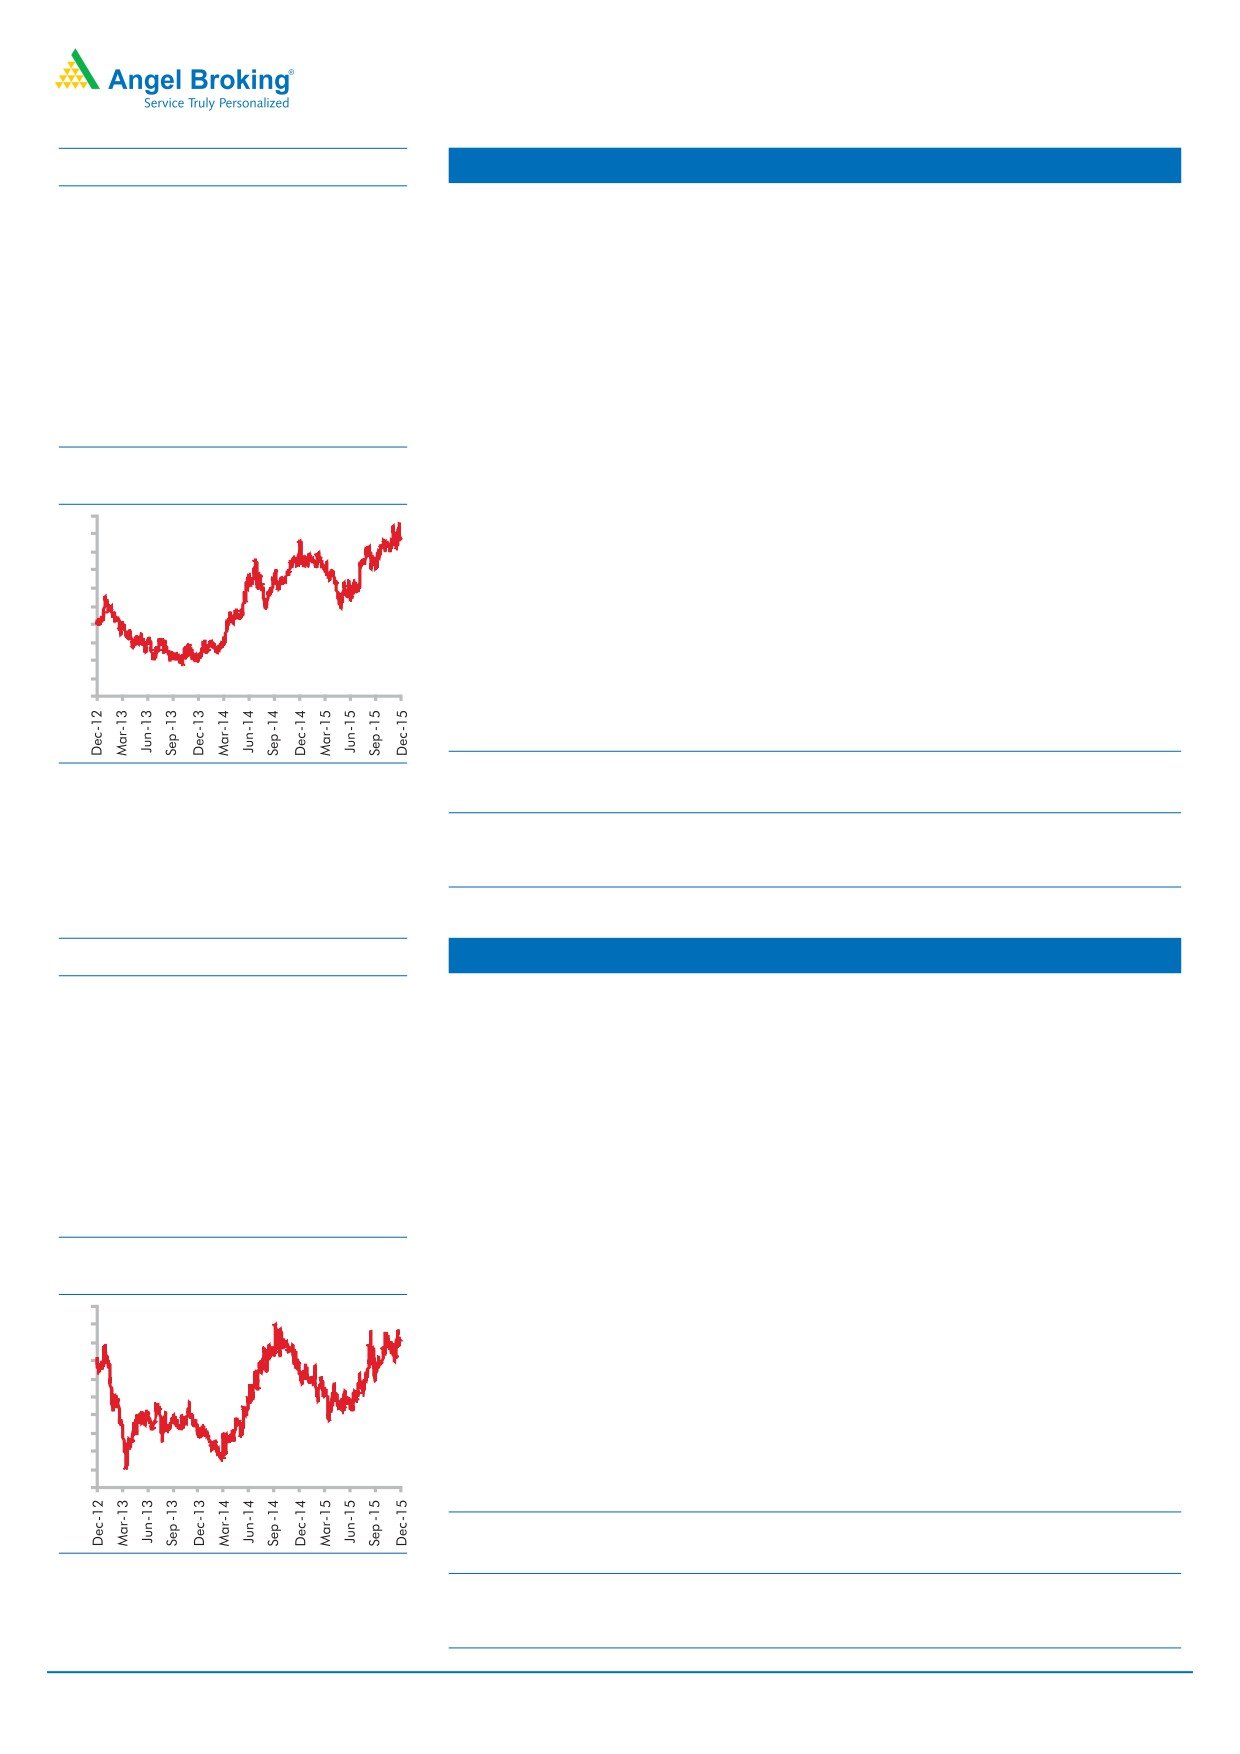
3 year-Chart
has been able to keep its Gross as well as Net NPAs within control. The bank has
700
guided at addition of stressed assets being lower in FY2016, than in FY2015.
600
500
Outlook: Healthy pace of branch expansion and a strong distribution network
400
continue to be the driving force for the bank's retail business. While the near term
300
asset quality environment remains challenging, the bank in our view will be able to
200
absorb the credit costs given the adequate profitability. Further, given its strong
100
CASA and retail network, the bank is positioned strongly to benefit once the macros
0
revive. The stock currently trades at 1.9x P/ABV FY2017E. We recommend a Buy
rating on the stock with a target price of `630.
Source: Company, Angel Research
Y/E
Op Inc. NIM
PAT
EPS
ABV
RoA RoE
P/E P/ABV
March
( ` cr)
(%)
(` cr)
(`)
(`)
(%)
(%)
(x)
(x)
FY2016E
26,473
3.5
8,472
35.7
213.1
1.7
17.9
12.9
2.2
FY2017E
31,527
3.6
10,309
43.5
246.9
1.8
18.9
10.6
1.9
Stock Info
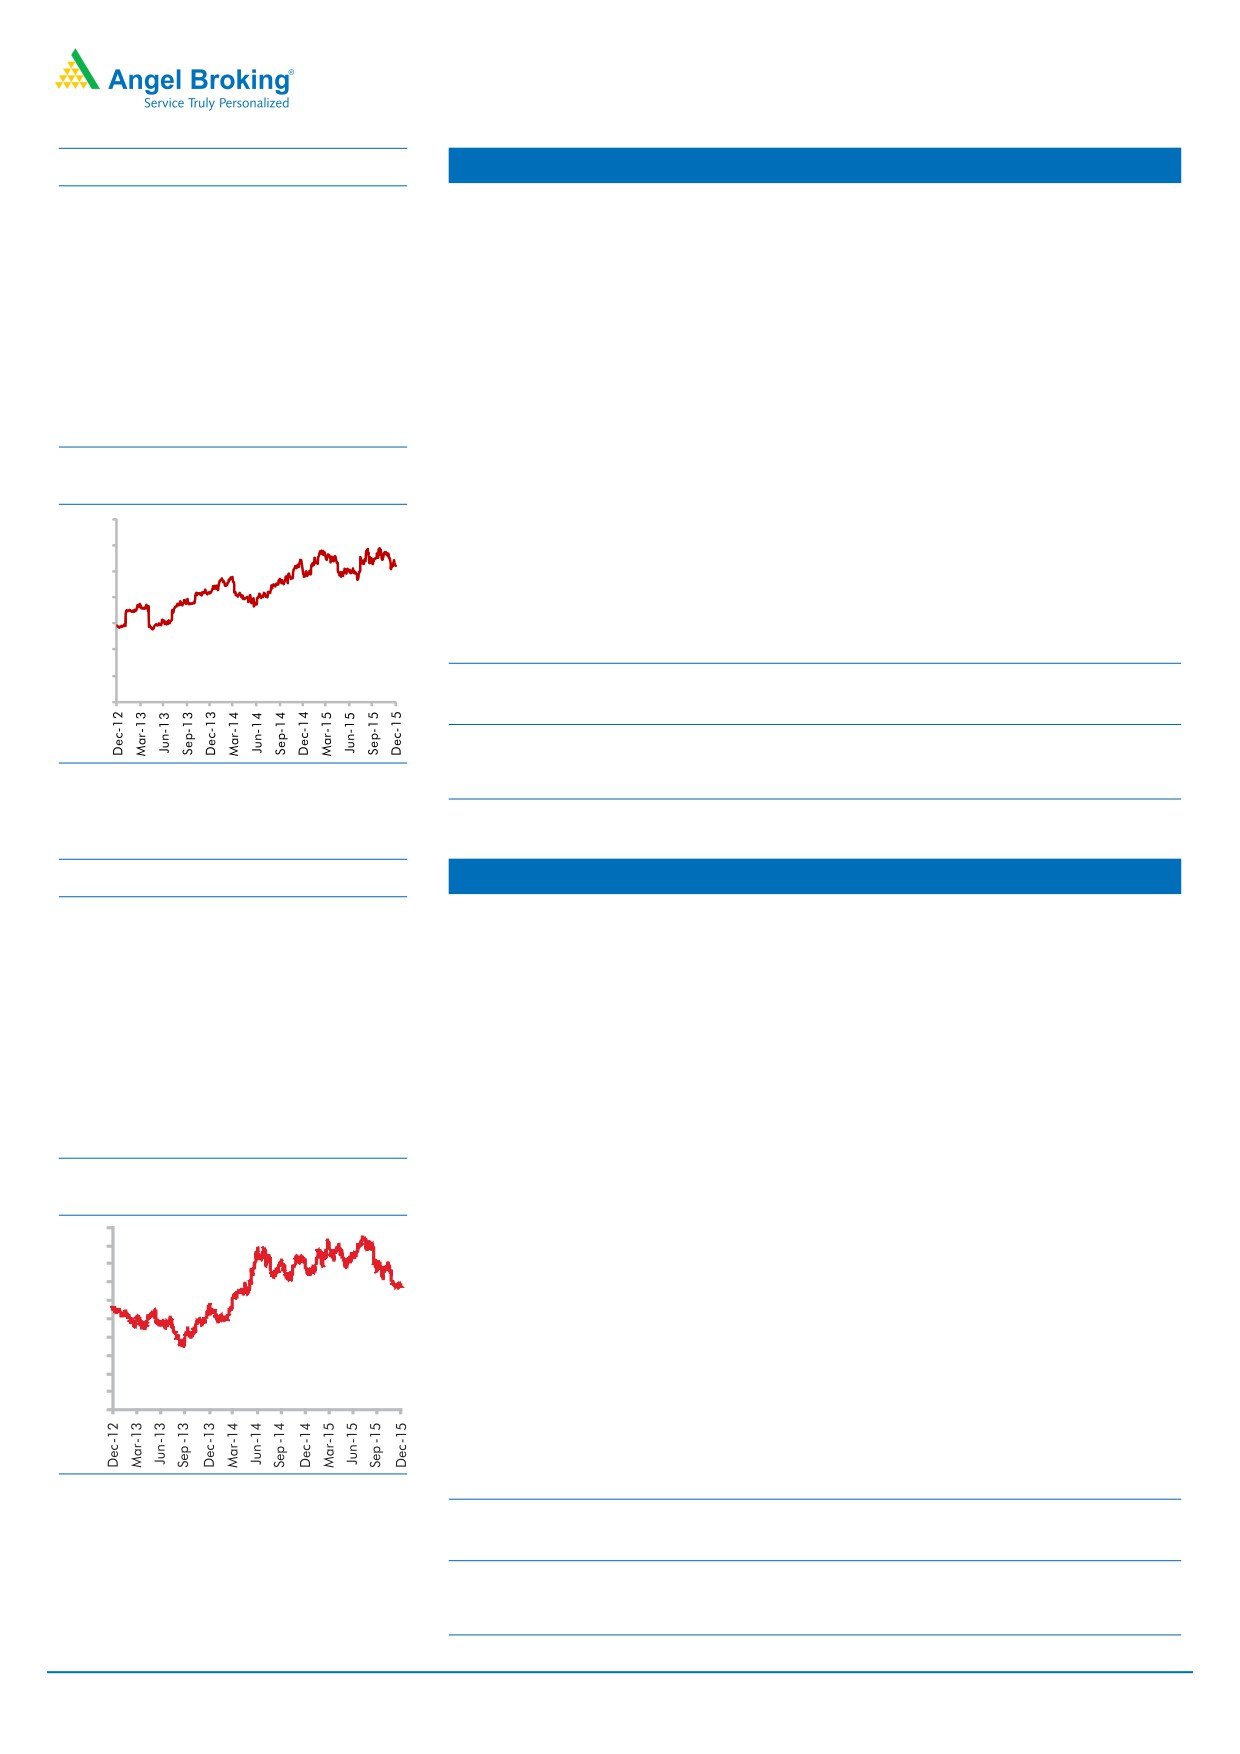
HCL Technologies
CMP (`)
841
Healthy pipeline: In terms of order flow in FY2015, HCL Tech has signed
TP (`)
1,132
58 transformational engagements with US$5bn+ of TCV. During 1QFY2016, the
company has signed in excess of US$1bn worth of orders and has indicated that its
Upside
35%
order book is 10% higher than its highest order book. These bookings saw significant
Sector
IT
momentum driven by Next-gen ITO, Engineering Services Outsourcing, Digital and
Market Cap (` cr)
118,437
Modern Apps deals, each of which had a component of new technology constructs
like Digitalization, Cloud etc.
Beta
0.6
Robust outlook: We expect HCL Tech to post a USD and INR revenue CAGR of
52 Week High / Low
1,058/725
13.0% and 13.2%, respectively, over FY2015-17E. On the operating front, HCL
Tech's EBIT margin has been around 22.3% in FY2015, a dip of 185bp over the
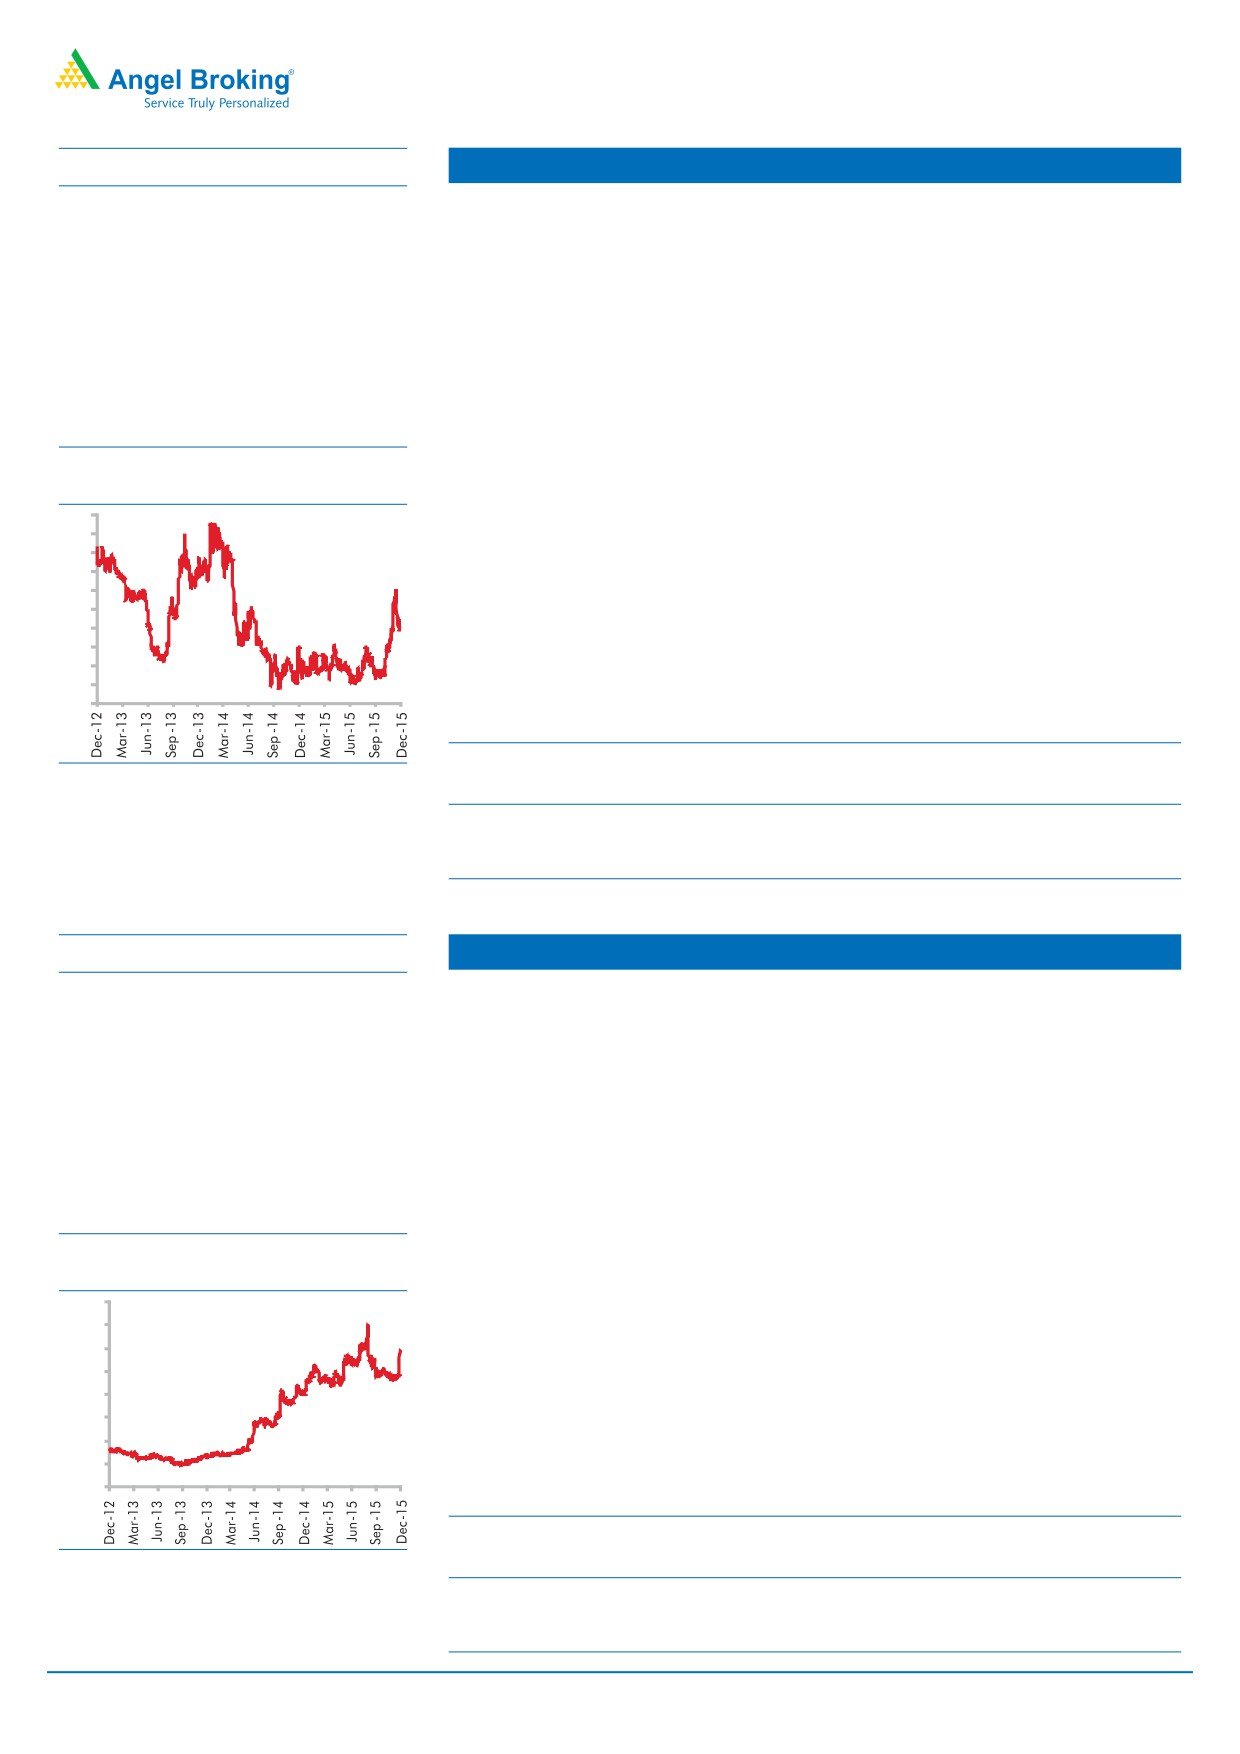
3 year-Chart
previous financial year. Going ahead, the Management expects EBIT margins to
1,400
1,200
sustain at 21-22%, driven by moving work offshore and efficiency-led gains. We
1,000
expect the EBIT and PAT to post a 12.9% and 10.6% CAGR, respectively, over
800
FY2015-17E.
600
Outlook and Valuations: At current valuations, the stock is attractively valued and
400
hence we maintain our buy with a price target of `1,132.
200
0
Y/E
Sales OPM PAT
EPS
RoE
P/E P/BV EV/EBITDA EV/Sales
March
(` cr)
(%)
(` cr)
(`)
( %)
(x)
(x)
(x)
(x)
FY2016E
42,038
23.2
7,862
55.8
23.0
15.1
3.5
10.4
2.4
Source: Company, Angel Research
FY2017E
47,503
23.5
8,862
62.9
19.8
13.4
2.6
8.2
1.9
December 8, 2015
Please refer to important disclosures at the end of this report.
4
Top Picks Report
December 2015
Stock Info
HDFC Bank
CMP (`)
1,062
Strong capital adequacy, expanding network, to sustain traction in market share:
TP (`)
1,262
HDFC Bank's capital adequacy ratio as of 2QFY2016 stood strong at 15.5%, with
Tier1 ratio at 12.8%, which positions the bank to continue on its growth path and
Upside
19%
increase its market share. During the past one year, the bank has added 627
Sector
Banking
branches which should aid it in maintaining above system-average retail loan
Market Cap (` cr)
268,055
growth on the asset side and CASA accretion on the liability side.
Beta
0.9
Asset quality rock-solid: The bank has been able to maintain its asset quality
consistently. Asset quality continued to remain healthy with the Gross NPA rate at
52 Week High / Low
1,128/916
0.91% in a challenging macro environment while the Net NPA rate stands at 0.25%.
3 year-Chart
Outlook: The bank's credit and deposit growth continues to beat the industry growth
1,200
rate, driven by dominant market position in most retail business segments, healthy
1,000
CASA and continued network expansion. This provides strong visibility for a robust
800
20% earnings trajectory, coupled with high quality of earnings on account of high
quality retail business and strategic focus on highly rated corporates. This in our
600
view justifies a premium valuation multiple. At the current market price, the bank is
400
trading at 3.2x FY2017E ABV. We recommend a Buy rating on the stock, with a
200
target price of `1,262.
0
Y/E
Op Inc. NIM
PAT
EPS
ABV
RoA RoE
P/E P/ABV
March
( ` cr)
(%)
(` cr)
(`)
(`)
(%)
(%)
(x)
(x)
Source: Company, Angel Research
FY2016E
38,309
4.3
12,363
49.3
285.4
1.9
18.5
21.5
3.7
FY2017E
47,302
4.3
15,302
61.0
332.2
1.9
19.7
17.4
3.2
Stock Info
ICICI Bank
CMP (`)
263
Strong CASA provides comfort: ICICI Bank has strategically transformed itself over
TP (`)
354
the past few years, which has resulted in a significantly better balance sheet and
earnings quality. The CASA ratio, which was at 29% at the end of FY2009, has
Upside
35%
improved to around 45.5% as of FY2015. Apart from the paradigm shift in the
Sector
Banking
deposit mix reflected in its healthy CASA ratio, the bank has gradually reduced its
Market Cap (` cr)
152,967
international business, which has led to sustainable improvement in its NIM.
Beta
1.5
Well positioned for cyclical revival: The bank's substantial branch expansion from
1,438 branches at the end of FY2009 to nearly 4,050 branches by FY2015, and
52 Week High / Low
393/248
strong capital adequacy (Tier-I at 12.6%) has positioned it to grow its loan book at
a faster clip as and when the business environment turns conducive.
3 year-Chart
450
Outlook: At the current market price, the bank's core banking business (after
400
adjusting `67/share towards value of subsidiaries) is trading at 1.4x FY2017E ABV.
350
300
The valuation discount in our view vis-à-vis other private banks adequately factors
250
in the relatively higher stressed assets that the bank is facing in the near term. We
200
recommend a Buy rating on the stock, with a target price of `354.
150
100
Y/E
Op Inc. NIM
PAT
EPS
ABV
RoA RoE
P/E P/ABV*
50
0
March
( ` cr)
(%)
(` cr)
(`)
(`)
(%)
(%)
(x)
(x)
FY2016E
35,168
3.4
12,479
21.4
124.9
1.6
14.7
12.5
2.1
Source: Company, Angel Research
FY2017E
40,517
3.4
14,680
25.2
149.8
1.6
15.2
10.8
1.8
Note: * without adjustment for subsidiaries
December 8, 2015
Please refer to important disclosures at the end of this report.
5
Top Picks Report
December 2015
Stock Info
Infosys
CMP (`)
1,046
Guidance - to achieve a 10-12% CC growth in FY2016: During 2QFY2016 Infosys
TP (`)
1,306
has reinforced its USD revenue growth guidance of 10-12% on CC basis in FY2016;
it has decreased its growth guidance for the current financial year from 7.2%-9.2%
Upside
25%
in US$ terms (given in 1QFY2016) to 6.4%-8.4% qoq in US$ terms. This change in
Sector
IT
the dollar revenue is mainly to factor in the anticipated currency movement. We
Market Cap (` cr)
240,226
expect the company to post ~10.7% USD revenue growth in FY2016.
Beta
0.7
Aims to be US$20bn company by FY2020: The company expects its revenue to
rise to US$20bn by FY2020, up from US$8.7bn now, as it focuses on acquisitions
52 Week High / Low
1,219/933
and win more new technology services, implying a 14% CAGR over the period.
Over the near term, we expect Infosys to post a 10.7% USD revenue growth in
3 year-Chart
FY2016. Over FY2015-17E, we expect USD and INR revenue to grow at a CAGR
1,400
of 10.7% and 11.2%, respectively. The Management expects to lead industry growth
1,200
from FY2017 onwards.
1,000
800
Outlook and Valuations: The stock trades at current valuations of 16.4x FY2017E
600
earnings. We recommend a Buy on the stock with a price target of `1,306.
400
200
Y/E
Sales OPM PAT
EPS
RoE
P/E P/BV EV/EBITDA EV/Sales
0
March
(` cr)
(%)
(` cr)
(`)
( %)
(x)
(x)
(x)
(x)
FY2016E
60,250
28.0
13,391
58.3
20.9
17.9
3.8
11.8
3.3
Source: Company, Angel Research
FY2017E
66,999
28.0
14,632
63.7
19.7
16.4
3.2
10.0
2.8
Stock Info
Larsen & Toubro
CMP (`)
1,341
L&T's Management sees a bid pipeline of `3,70,000cr (`1,00,000cr of this would
TP (`)
1,646
be from the international markets), which are at different stages of awarding.
Considering the huge bid-pipeline and the company's wide presence across sub-
Upside
23%
verticals, it should attain its 5-7% revised order inflow growth guidance for FY2016E.
Sector
Infrastructure
L&T, as of 2QFY2016-end, is sitting on an order book of `2,44,097cr, which gives
Market Cap (` cr)
124,862
revenue visibility for over the next 30 months. Considering the huge order book,
Beta
1.2
we expect L&T to report a 12.5% yoy top-line growth for FY2016E.
With legacy Hydro-carbons projects in Middle-East nearing completion, we expect
52 Week High / Low
1,893/1,326
the Hydro-carbons business to show signs of turn-around by 4QFY2016.
3 year-Chart
Accordingly, L&T could see consol. EBITDA margin expansion, in FY2017E.
2,000
The standalone D/E ratio (2QFY2016) stands at 0.41x. Divestment of non-strategic
1,800
1,600
holdings, further equity infusion in infra projects and listing of L&T InfoTech would
1,400
address the IDPL equity requirements to a certain extent.
1,200
1,000
Ascribing separate values to the parent business (on P/E basis) and to investments
800
600
in subsidiaries (using P/E, P/BV and M-cap basis), we arrive at a FY2017E based
400
target price of `1,646. At the current market price of `1,341, the standalone entity
200
0
is trading at an implied P/E multiple of 13.2x (FY2017), which is attractive. We are
of the view that L&T is a proxy play for investors wanting to ride on the revival of the
Indian infrastructure growth story. We recommend a Buy on the stock.
Source: Company, Angel Research
Y/E
Sales OPM PAT
EPS
RoE
P/E P/BV EV/EBITDA EV/Sales
March
(` cr)
(%)
(` cr)
(`)
( %)
(x)
(x)
(x)
(x)
FY2016E
64,148
11.5
5,776
61.5
13.4
21.8
2.2
18.6
2.1
FY2017E
73,241
11.7
6,155
65.6
14.0
20.4
2.0
16.1
1.8
December 8, 2015
Please refer to important disclosures at the end of this report.
6
Top Picks Report
December 2015
Stock Info
LIC Housing Fin.
CMP (`)
462
Significant under penetration of mortgages in India: India is expected to witness a
TP (`)
571
robust housing finance growth going forward as the mortgage penetration in India
remains at very low levels at 8% to GDP as compared to the developed countries
Upside
24%
where it is in the range of 60-100%. Given the strong growth outlook (amongst the
Sector
HFC
fastest growing loan segments at the industry levels, while overall credit growth
Market Cap (` cr)
23,332
remains sub-10%) as well as relatively healthy asset quality, in our view, make
mortgage finance one of the most attractive BFSI segments.
Beta
1.4
NIM expansion visible: LIC Housing Finance is able to raise funds from low-cost
52 Week High / Low
526/377
NCDs due to its strong AAA credit rating and backing by strong promoters like LIC.
The company has seen a significant reduction in its cost of funds to 9.29% as
3 year-Chart
against 9.68% a year ago. In a declining interest rate environment, NBFC's like LIC
600
Housing are well-placed to increase margins in our view.
500
Outlook: Despite competition in mortgages, volume growth in the individual loans
400
segment remains fairly strong. LICHF continues to grow its retail loan book at a
300
healthy pace with healthy asset quality. We expect the company to post a healthy
200
loan book CAGR of 18.7% over 2015-17E which is likely to reflect in an earnings
100
CAGR of 20.5%, over the same period. At the current market price, it is trading at
0
2.2x FY2017E ABV. We recommend a Buy rating on the stock, with a target price
of `571.
Source: Company, Angel Research
Y/E
Op Inc. NIM
PAT
EPS
ABV
RoA RoE
P/E P/ABV
March
( ` cr)
(%)
(` cr)
(`)
(`)
(%)
(%)
(x)
(x)
FY2016E
3,101
2.5
1,664
33.0
176.7
1.4
19.7
14.0
2.6
FY2017E
3,745
2.5
2,029
40.2
207.6
1.4
20.5
11.5
2.2
December 8, 2015
Please refer to important disclosures at the end of this report.
7
Top Picks Report
December 2015
Top Picks - Mid Cap
December 8, 2015
Please refer to important disclosures at the end of this report.
8
Top Picks Report
December 2015
Stock Info
Blue Star
CMP (`)
357
Blue Star is one of the largest air-conditioning companies in India. The overall
TP (`)
429
outlook for the room air-conditioner (RAC) market in India is favourable as India
has one of the lowest penetration rates in the world. As per the Management,
Upside
20%
penetration rate of ACs in India is a mere 3% vs 25% in China. With rising income
Sector
Cons. Durable
levels, the penetration level is expected to improve which augurs well for Blue Star's
Cooling Products Division (CPD).
Market Cap (` cr)
3,208
Its RAC business has been outgrowing the industry by ~10% points over the last
Beta
0.7
few quarters, resulting in the company consistently increasing its market share
52 Week High / Low
395/274
(~7% in FY2014 to 10% at present), a trend that the Management is confident of
maintaining in the near future. This has resulted in CPD's share in overall revenues
increasing from~23% in FY2010 to ~42% in FY2015 (expected to improve to
3 year-Chart
~47% in FY2017E). With strong brand equity and higher share in split ACs, we
450
400
expect the CPD to continue to drive growth.
350
Aided by increasing contribution from the CPD, we expect the overall top-line to
300
post a revenue CAGR of 11.8% over FY2015-17E and margins to improve from
250
200
5.3% in FY2015 to 6.9% in FY2017E. Moreover, the proposed merger with Blue
150
Star Infotech will provide cash influx and thus strengthen the balance sheet.
100
50
At the current market price, the stock trades at 20.8x its FY2017E earnings and
-
0.8x its FY2017E EV/sales v/s its close peer Voltas, which trades a 1.5x its FY2017E
EV/sales. At target P/E multiple of 25.0x, the implied FY2017E EV/sales multiple
works out to 1.1x, which is comforting. Hence we recommend a Buy on the stock.
Source: Company, Angel Research
Y/E
Sales OPM PAT
EPS
RoE
P/E P/BV EV/EBITDA EV/Sales
March
(` cr)
(%)
(` cr)
(`)
( %)
(x)
(x)
(x)
(x)
FY2016E
3,548
6.3
123
13.7
26.1
26.0
6.6
15.9
1.0
FY2017E
3,977
6.9
164
17.2
25.4
20.8
4.3
12.3
0.8
Stock Info
Ipca Labs.
CMP (`)
757
Domestic formulations business - the cash cow: IPCA has been successful in
TP (`)
900
changing its business focus to the high-margin chronic and lifestyle segments from
the low-margin anti-malarial segment. The chronic and lifestyle segments,
Upside
19%
comprising CVS, anti-diabetics, pain-management, CNS and dermatology products,
Sector
Pharmaceutical
constitute more than 50% of the company's domestic formulation sales.
Market Cap (` cr)
9,557
Exports under pressure: On the formulations front, IPCA has been increasing its
Beta
0.5
penetration in regulated markets, viz Europe and the US, by expanding the list of
generic drugs backed by its own API. However, after the USFDA inspection at the
52 Week High / Low
888/667
company's 3 manufacturing facilies, the company has received import alerts,
consequent to which the company had voluntarily decided to temporarily suspend
3 year-Chart
shipments from these manufacturing facility to the US markets till this issue was
1,000
addressed. These developments have impacted FY2015/FY2016.
800
Outlook and Valuations: For FY2016, the Management has given a guidance of
7-8% yoy growth on the sales front. While the problems are likely to persist in
600
FY2016, still, given the valuations and improvement expected from FY2017E
400
onwards, we maintain our Buy rating on the stock with a price target of `900.
200
Y/E
Sales OPM PAT
EPS
RoE
P/E P/BV EV/EBITDA EV/Sales
March
(` cr)
(%)
(` cr)
(`)
( %)
(x)
(x)
(x)
(x)
Source: Company, Angel Research
FY2016E
3,363
12.9
169
13.4
7.4
56.6
4.0
24.3
3.1
FY2017E
3,909
18.6
353
28.0
14.0
27.0
3.5
14.4
2.7
December 8, 2015
Please refer to important disclosures at the end of this report.
9
Top Picks Report
December 2015
Stock Info
Jagran Prakashan
CMP (`)
146
We expect Jagran Prakashan (JPL) to register a healthy net sales CAGR of ~15%
TP (`)
169
over FY2015-17E, on back of (a) strong growth in advertising revenue due to
improvement in GDP growth, (b) improvement in circulation revenue owing to
Upside
16%
combination of increase in cover price and volume growth.
Sector
Media
Further the acquisition of a radio business (Radio City) would also boost the
Market Cap (` cr)
4,943
company's revenue going ahead. Radio City has ~20 stations across 7 states in
Beta
0.6
the country and is second only to ENIL in all its operating circles, ie Delhi, Mumbai,
Bengaluru, Chennai, Ahmedabad, Hyderabad, Pune and Lucknow. The company
52 Week High / Low
108/157
covers ~51% (~66mn people) of the total radio population.
3 year-Chart
Raw material prices (newsprint costs) have been declining over the past 5 quarters
160
and are expected to remain stable, going forward. Thus, considering lower news
150
print costs, healthy sales, and higher margins in the radio business, we expect the
140
130
company to post a adj. net profit CAGR of ~20% over FY2015-17E to `325cr.
120
110
Considering Dainik Jagran's status as the most read Hindi newspaper and its strong
100
presence in the rapidly growing Hindi markets of Bihar, Haryana, Jharkhand, Punjab,
90
80
Madhya Pradesh and Uttar Pradesh, we expect JPL to benefit from an eventual
70
60
recovery in the Indian economy. Hence, we maintain an Accumulate rating on the
stock with a target price of `169.
Y/E
Sales OPM Adj. PAT EPS
RoE
P/E P/BV EV/EBITDA EV/Sales
Source: Company, Angel Research
March
(` cr)
(%)
(` cr)
(`)
( %)
(x)
(x)
(x)
(x)
FY2016E
2,170
27.2
290
8.9
20.9
16.4
3.4
7.8
2.1
FY2017E
2,355
26.2
325
9.9
20.4
14.8
3.0
7.4
1.9
Stock Info
MT Educare
CMP (`)
140
MT Educare has strong positioning in the Secondary School and Higher Secondary
TP (`)
169
School coaching business in Mumbai location (contributes ~80% to the overall
revenue). The company , this year, has introduced a technology, the unique - Learning
Upside
21%
Management System (LMS) - for strengthening its offering in its core business.
Sector
Education
We expect MT Educare to report a healthy top-line performance, going forward,
Market Cap (` cr)
553
on the back of strong growth across the pre-university (PU) college business, Shri
Beta
1.0
Gayatri Educational Society (SGES), and the Lakshya business. Further, we also
expect the company to report a strong growth in the CA segment in Tamil Nadu
52 Week High / Low
152/96
and Mumbai.
3 year-Chart
We expect strong revenue from government projects. In this segment, MT Educare
160
provides coaching for competitive exams like Engineering, Medical, CA etc. to
150
backward classes and poor students who can't afford coaching fees, while the fees
140
130
are subsidised by the government.
120
110
We estimate MT Educare to report net sales CAGR of ~27% to ~`366cr and adj.net
100
profit CAGR of ~20% to `37cr over FY2015-17E. At the current market price, MT
90
80
Educare trades at a P/E of 15.0x its FY2017E earnings. We have a Buy rating on
70
60
the stock and target price of `169 (18x FY2017E EPS).
Y/E
Sales OPM Adj. PAT EPS
RoE
P/E P/BV EV/EBITDA EV/Sales
March
(` cr)
(%)
(` cr)
(`)
( %)
(x)
(x)
(x)
(x)
Source: Company, Angel Research
FY2016E
286
18.3
31
7.7
20.2
18.2
3.8
10.3
1.9
FY2017E
366
17.7
37
9.4
21.1
15.0
3.2
8.1
1.4
December 8, 2015
Please refer to important disclosures at the end of this report.
10
Top Picks Report
December 2015
Stock Info
Radico Khaitan
CMP (`)
109
The IFML segment is under penetrated and leaves scope for growth for domestic
TP (`)
156
liquor companies. Going forward, increase in income levels would lead to higher
growth in IFML brands. RKL has strong brands in the premium liquor category,
Upside
43%
which should lead to higher revenue for the company. The company's premium
Sector
Breweries & Distilleries
offerings reported a CAGR of ~26% over the last seven-year period, and we expect
Market Cap (` cr)
1,424
the growth momentum to continue.
We expect the price of ENA (key raw material) to remain stable and potentially
Beta
0.8
even decline, going forward. This is because sugar production during the year has
52 Week High / Low
131/78
risen by ~16% yoy and demand for ethanol from Indian oil marketing companies for
blending with petrol is also expected to be lower due to an unfavourable price differential.
3 year-Chart
We expect a significant hike in liquor prices in the coming financial year as there
170
160
haven't been any significant ones in recent times. Also, we believe that industry
150
leader - United Spirit would shift focus on profitability over volume growth considering
140
130
the debt on its Balance Sheet, which in turn, would lead to increased scope for
120
other liquor companies to hike prices.
110
100
RKL is trading at 1-year forward EV/Sales multiple of 1.3 x, which is at huge
90
80
discount to its close peer, United Spirits (4.6x). We have a Buy rating on the stock
70
and target price of `156 (22x FY2017E EPS).
Y/E
Sales OPM PAT
EPS
RoE
P/E P/BV EV/EBITDA EV/Sales
Source: Company, Angel Research
March
(` cr)
(%)
(` cr)
(`)
( %)
(x)
(x)
(x)
(x)
FY2016E
1,565
12.2
75
5.7
8.3
19.1
1.6
11.3
1.4
FY2017E
1,687
13.0
95
7.1
9.5
15.3
1.5
9.7
1.3
Stock Info
Siyaram Silk
CMP (`)
1,165
SSML has strong brands which cater to premium as well as popular mass segments
TP (`)
1,354
of the market. The company's brands include Siyaram's Mistair, J. Hampstead,
Royal Linen, Casa, Moda, Zenesis ,Moretti etc. Further, in FY2014, SSML entered
Upside
16%
the ladies' salwar kameez and ethnic wear segment with its brand Siya. Going
Sector
Textile
forward, we believe that the company would be able to leverage its brand equity
Market Cap (` cr)
1,092
and continue to post strong performance.
The company has a nationwide network of about 1,600 dealers and business
Beta
0.8
partners, which enables it to scale the entire country. The company has a retail
52 Week High / Low
1,400/780
network of 160 stores and plans to add another 300-350 stores over the next three
or four years. Further, the company's brands are sold across 3,00,000 multi brand
3 year-Chart
outlets in the country.
1,600
Going forward, we expect SSML to report a net sales CAGR of ~10% to ~`1,815cr
1,400
1,200
and adj.net profit CAGR of ~12% to `98cr over FY2015-17E on back of market
1,000
leadership in blended fabrics, strong brand building, wide distribution channel,
800
strong presence in tier II and tier III cities and emphasis on latest designs and
600
affordable pricing points. At the current market price, SSML trades at an inexpensive
400
valuation (at a P/E of 11.2x its FY2017E earnings). We have a Buy rating on the
200
stock and target price of `1,354.
0
Y/E
Sales OPM PAT
EPS
RoE
P/E P/BV EV/EBITDA EV/Sales
Source: Company, Angel Research
March
(` cr)
(%)
(` cr)
(`)
( %)
(x)
(x)
(x)
(x)
FY2016E
1,636
11.5
84
89.9
17.9
13.0
2.1
6.7
0.8
FY2017E
1,815
11.5
98
104.1
17.8
11.2
1.9
6.0
0.7
December 8, 2015
Please refer to important disclosures at the end of this report.
11
Top Picks Report
December 2015
Stock Info
Surya Roshni
CMP (`)
135
To benefit from structural shift in lighting industry: We expect SRL to benefit from
TP (`)
183
the structural shift in the lighting industry towards LED lighting, which is expected to
grow at a CAGR of 28% over FY2015E-21E. SRL is the second largest lighting
Upside
36%
company in India with a market share of ~ 25%. With demand for LEDs expected
Sector
Cons. Durable
to rise, the company would be a key beneficiary, given that the company's "Surya"
Market Cap (` cr)
590
brand is well recognized and has superior market reach comprising of 2 lakh plus
retailers.
Beta
1.8
Higher contribution from lighting division to boost margins: SRL's other business,
52 Week High / Low
163/89
Steel Pipes, entails low profitability and has higher debt, thus having resulted in
high overall debt/equity for the company. The Lighting business' contribution to the
3 year-Chart
overall top-line of the company has increased from 30% in FY2012 to 40% in
180
160
FY2015. The Lighting business commands higher margins (10.7%) vs. the steel
140
business (2.9%) and contributes 70% to the profitability. We expect the Lighting
120
business's contribution to rise on account of growth coming in from LEDs, thus
100
80
enhancing overall profitability.
60
40
Declining interest rates to assist in reducing debt burden: We expect SRL to benefit
20
from a reduction in interest rates by the RBI (75bp FY2016). With interest rates
-
expected to reduce further, SRL's interest expense will be lower and we expect the
company to use its healthy cash flows from the Lighting business to slowly reduce
its debt.
Source: Company, Angel Research
Outlook and Valuations: In our view, SRL would benefit from a higher contribution
from the Lighting business and a lower interest rate environment, going forward.
SRL trades at 7.4x its FY2017 earnings. We have a Buy rating on the stock with a
target price of `183.
Y/E
Sales OPM PAT
EPS
RoE
P/E P/BV EV/EBITDA EV/Sales
March
(` cr)
(%)
(` cr)
(`)
( %)
(x)
(x)
(x)
(x)
FY2016E
2,992
8.1
64
14.7
9.7
9.2
0.9
5.9
0.5
FY2017E
3,223
8.4
80
18.3
11.0
7.3
0.8
5.2
0.4
December 8, 2015
Please refer to important disclosures at the end of this report.
12
Top Picks Report
December 2015
Macro watch
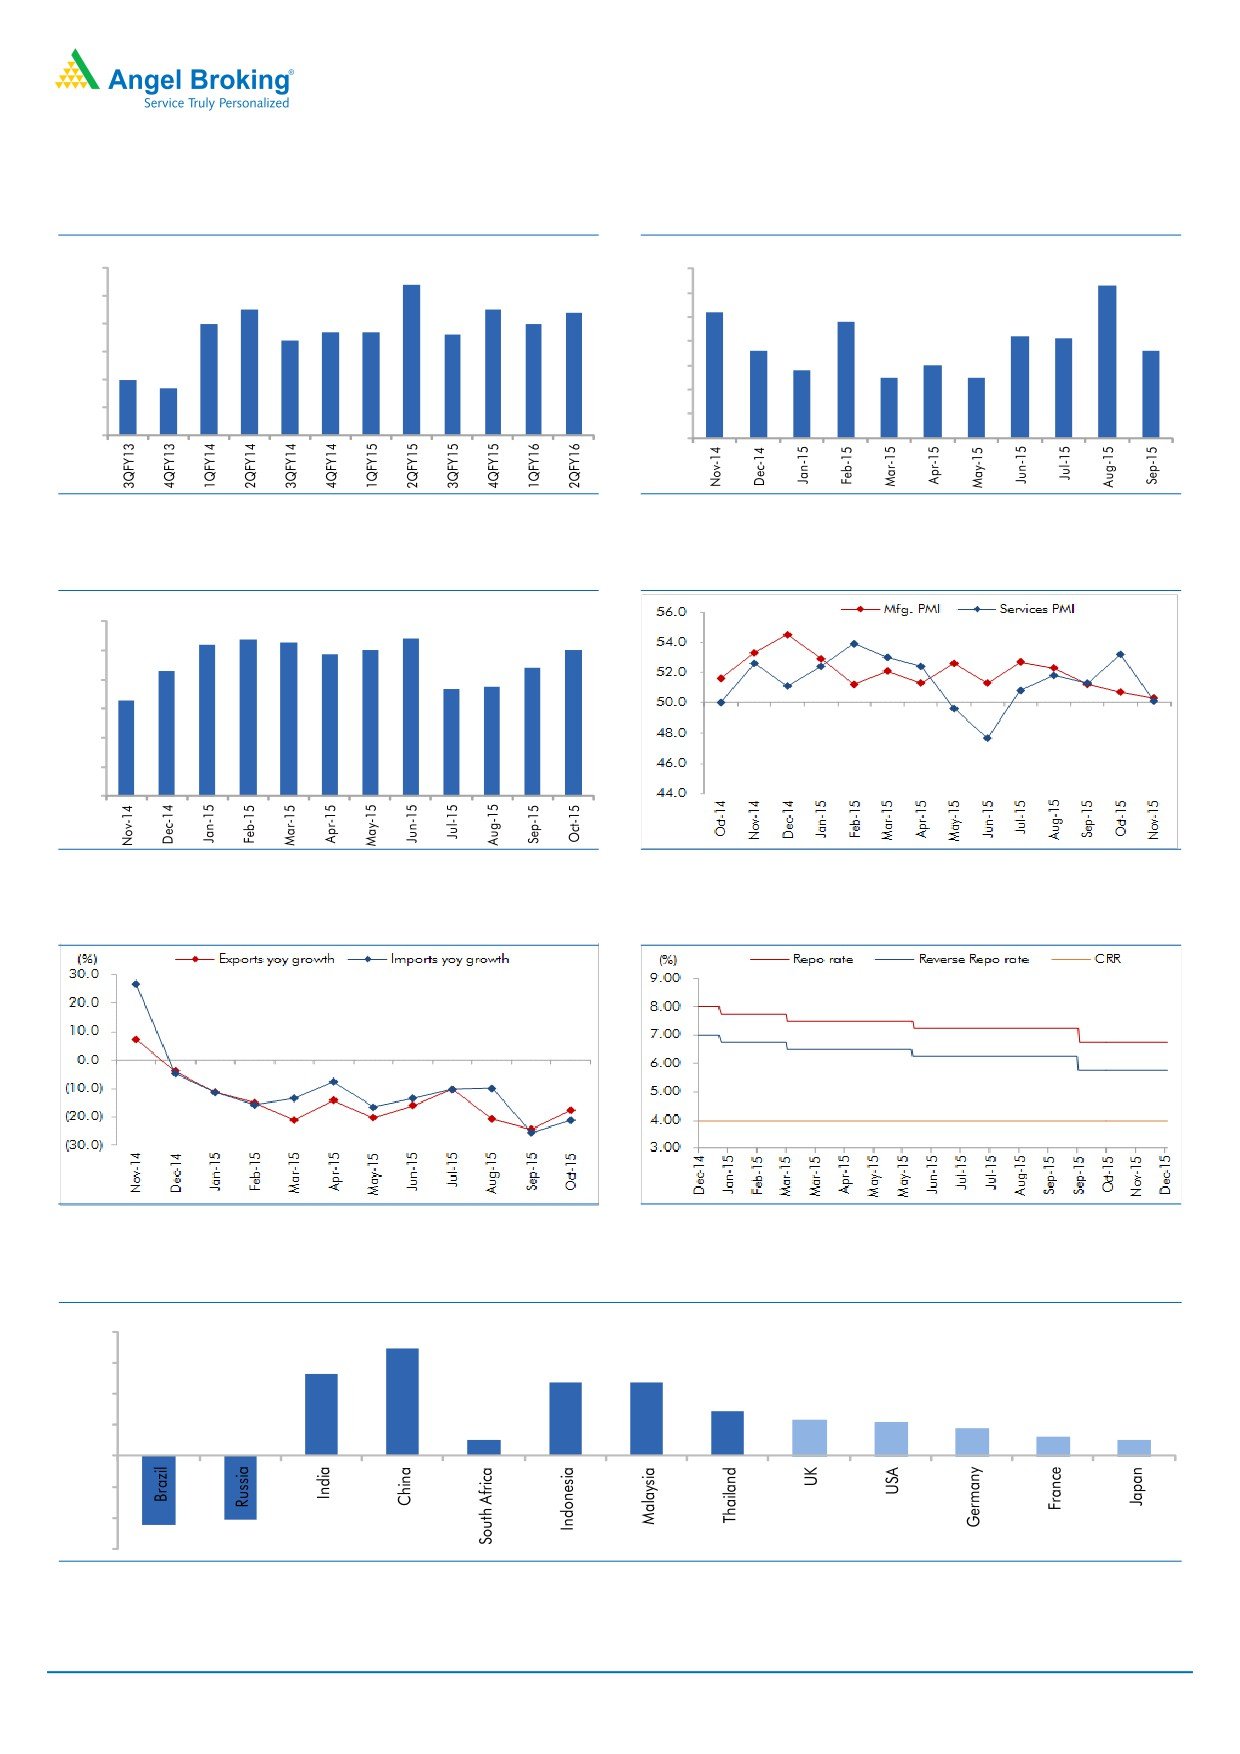
Exhibit 1: Quarterly GDP trends
Exhibit 2: IIP trends
(%)
(%)
9.0
8.4
7.0
6.3
7.5
7.5
6.0
8.0
7.4
5.2
7.0
7.0
4.8
6.7
6.7
6.6
5.0
7.0
6.4
4.2
4.1
4.0
3.6
3.6
6.0
2.8
3.0
5.0
3.0
2.5
2.5
4.7
5.0
2.0
4.0
1.0
3.0
-
Source: CSO, Angel Research
Source: Ministry of Commerce, Angel Research
Exhibit 3: Monthly CPI inflation trends
Exhibit 4: Manufacturing and services PMI
(%)
6.0
5.4
5.2
5.4
5.3
4.9
5.0
5.0
5.0
4.4
4.3
3.7
3.7
4.0
3.3
3.0
2.0
1.0
-
Source: Ministry of Commerce, Angel Research
Source: Ministry of Commerce, Angel Research
Exhibit 5: Exports and imports growth trends
Exhibit 6: Key policy rates
Source: Ministry of Commerce, Angel Research
Source: Ministry of Commerce, Angel Research
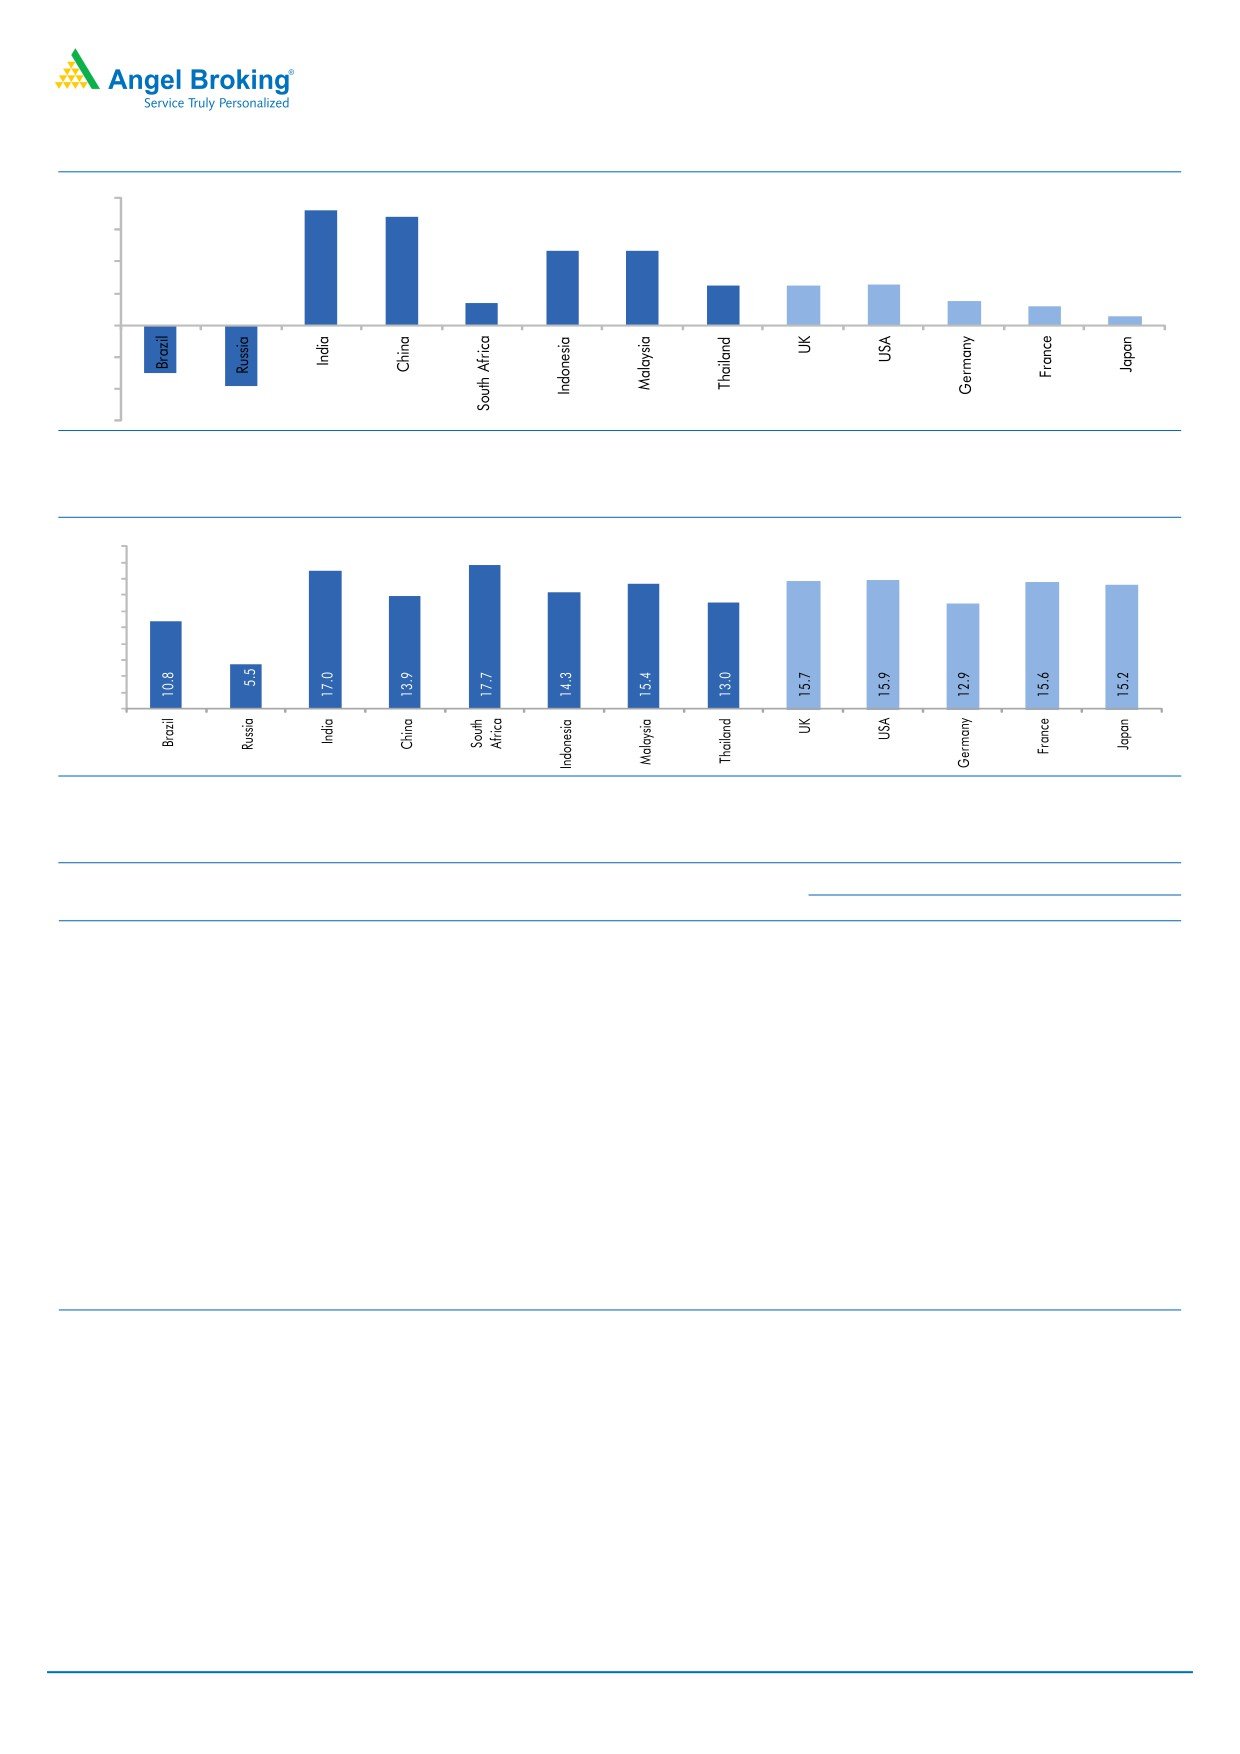
Exhibit 7: Latest quarterly GDP Growth (%, yoy) across select developing and developed countries
(%)
8.0
6.9
6.0
5.3
4.7
4.7
4.0
2.9
2.3
2.2
1.8
2.0
1.0
1.2
1.0
-
(2.0)
(4.0)
(4.1)
(4.5)
(6.0)
Source: Bloomberg, Angel Research
December 8, 2015
Please refer to important disclosures at the end of this report.
13
Top Picks Report
December 2015
Exhibit 8: 2015 GDP Growth projection by IMF (%, yoy) across select developing and developed countries
(%)
8.0
7.3
6.8
6.0
4.7
4.7
4.0
2.5
2.5
2.6
1.4
1.5
2.0
1.2
0.6
-
(2.0)
(3.0)
(4.0)
(3.8)
(6.0)
Source: IMF, Angel Research
Exhibit 9: One year forward P-E ratio across select developing and developed countries
(x)
20.0
18.0
16.0
14.0
12.0
10.0
8.0
6.0
4.0
2.0
-
Source: IMF, Angel Research
Exhibit 10: Relative performance of indices across globe
Returns (%)
Country
Name of index
Closing price
1M
3M
1YR
Brazil
Bovespa
45,361
(5.6)
(0.3)
(17.1)
Russia
Micex
1,755
(0.5)
3.4
9.2
India
Nifty
7,782
(3.3)
(2.7)
(9.0)
China
Shanghai Composite
3,525
1.9
14.3
37.3
South Africa
Top 40
44,347
(9.6)
1.8
0.3
Mexico
Mexbol
42,994
(5.2)
0.1
(0.3)
Indonesia
LQ45
777
(2.2)
3.2
(12.1)
Malaysia
KLCI
1,668
(0.6)
3.6
(8.4)
Thailand
SET 50
856
(7.1)
(4.1)
(19.5)
USA
Dow Jones
17,848
(0.4)
9.0
(0.6)
UK
FTSE
6,238
(2.7)
2.7
(6.5)
Japan
Nikkei
19,504
4.4
1.9
12.0
Germany
DAX
10,752
(0.9)
6.4
6.6
France
CAC
4,715
(4.7)
3.6
11.5
Source: Bloomberg, Angel Research
December 8, 2015
Please refer to important disclosures at the end of this report.
14
Top Picks Report
December 2015
Stock Watch
December 8, 2015
Please refer to important disclosures at the end of this report.
15
Stock Watch | December 2015
Company Name
Reco
CMP
Target
Mkt Cap
Sales (` cr)
OPM (%)
EPS (`)
PER (x)
P/BV (x)
RoE (%)
EV/Sales (x)
(`)
Price (`)
(` cr)
FY16E
FY17E
FY16E
FY17E
FY16E
FY17E
FY16E
FY17E
FY16E
FY17E
FY16E
FY17E
FY16E
FY17E
Agri / Agri Chemical
Rallis
Neutral
180
-
3,497
2,075
2,394
14.4
14.4
9.5
11.0
18.9
16.3
3.8
3.3
21.1
21.3
1.7
1.5
United Phosphorus
Buy
415
510
17,779
13,698
15,752
17.6
17.6
32.1
38.5
12.9
10.8
2.5
2.1
21.4
21.3
1.4
1.1
Auto & Auto Ancillary
Ashok Leyland
Buy
90
111
25,641
17,995
21,544
11.4
11.6
3.4
4.7
26.5
19.2
4.6
4.3
17.7
22.2
1.4
1.1
Bajaj Auto
Accumulate
2,449
2,728
70,866
23,695
27,298
21.3
20.4
134.6
151.5
18.2
16.2
5.8
4.9
31.8
30.6
2.5
2.2
Bharat Forge
Buy
834
1,016
19,405
8,013
9,250
20.0
20.3
35.2
43.1
23.7
19.3
4.7
3.8
21.6
21.8
2.5
2.1
Eicher Motors
Buy
16,231
19,036
44,073
15,379
16,498
15.6
16.6
473.2
574.8
34.3
28.2
12.7
9.4
36.7
33.2
2.8
2.5
Hero Motocorp
Accumulate
2,621
2,774
52,345
28,561
31,559
14.7
14.7
151.1
163.2
17.3
16.1
6.7
5.7
38.7
35.6
1.7
1.5
Jamna Auto Industries Neutral
124
-
990
1,292
1,486
9.3
9.8
6.0
7.5
20.7
16.5
4.3
3.6
20.7
21.8
0.8
0.7
L G Balakrishnan & Bros Neutral
506
-
794
1,254
1,394
11.6
11.8
35.9
41.7
14.1
12.1
1.9
1.7
13.5
13.8
0.7
0.7
Mahindra and Mahindra Accumulate
1,325
1,449
82,285
39,031
44,440
13.8
13.9
57.9
67.6
22.9
19.6
3.7
3.3
16.1
16.6
1.8
1.5
Maruti
Neutral
4,564
-
137,880
57,865
68,104
16.4
16.7
176.3
225.5
25.9
20.2
5.0
4.3
19.4
21.2
2.2
1.8
Minda Industries
Neutral
868
-
1,376
2,567
2,965
8.0
8.3
46.1
57.8
18.8
15.0
3.1
2.6
16.7
17.3
0.6
0.5
Motherson Sumi
Accumulate
280
313
37,043
39,343
45,100
8.8
9.1
10.1
12.5
27.7
22.4
8.8
6.9
35.3
34.4
1.0
0.9
Rane Brake Lining
Accumulate
340
366
269
454
511
11.1
11.4
23.8
28.1
14.3
12.1
2.0
1.8
14.2
15.3
0.7
0.7
Setco Automotive
Neutral
223
-
595
594
741
12.7
13.7
8.4
15.8
26.5
14.1
2.8
2.4
10.4
16.9
1.4
1.2
Tata Motors
Neutral
399
-
115,185
255,254
301,772
12.9
13.4
23.7
37.3
16.8
10.7
2.0
1.7
7.4
12.1
0.6
0.6
TVS Motor
Buy
282
338
13,388
11,569
13,648
7.3
8.7
10.3
16.1
27.4
17.5
6.8
5.3
24.8
30.5
1.1
0.9
Amara Raja Batteries
Buy
846
1,040
14,447
4,892
5,871
17.4
17.6
28.8
37.1
29.4
22.8
6.9
5.5
23.4
24.1
2.9
2.4
Exide Industries
Accumulate
141
162
11,989
6,950
7,784
14.4
14.8
6.6
7.3
21.4
19.3
2.7
2.5
12.6
12.8
1.4
1.3
Apollo Tyres
Accumulate
157
171
7,992
12,146
12,689
16.8
16.0
21.2
19.0
7.4
8.3
1.2
1.1
16.5
13.0
0.7
0.8
Ceat
Accumulate
1,038
1,119
4,200
6,041
6,597
14.1
13.7
99.5
111.9
10.4
9.3
2.1
1.7
19.6
18.5
0.8
0.7
JK Tyres
Neutral
107
-
2,419
7,446
7,669
15.2
14.0
19.6
18.4
5.4
5.8
1.4
1.1
25.2
19.5
0.7
0.6
Swaraj Engines
Neutral
910
-
1,130
552
630
14.2
14.7
44.6
54.1
20.4
16.8
4.7
4.3
23.2
25.6
1.9
1.6
Subros
Neutral
99
-
592
1,268
1,488
11.6
11.9
3.7
6.6
26.7
14.9
1.8
1.6
6.8
11.4
0.8
0.6
Indag Rubber
Neutral
226
-
593
283
329
17.0
17.2
13.0
15.4
17.5
14.7
3.8
3.2
21.8
21.6
1.8
1.5
Banking
Allahabad Bank
Neutral
73
-
4,375
8,569
9,392
2.8
2.9
16.3
27.5
4.5
2.6
0.4
0.33
7.6
11.9
-
-
Axis Bank
Buy
462
630
109,845
26,473
31,527
3.5
3.6
35.7
43.5
12.9
10.6
2.5
2.17
17.9
18.9
-
-
Bank of Baroda
Neutral
166
-
38,214
18,485
21,025
1.9
2.0
13.5
21.1
12.3
7.8
1.0
0.9
7.3
10.6
-
-
Bank of India
Neutral
122
-
9,657
15,972
17,271
1.9
2.0
15.3
33.3
8.0
3.7
0.4
0.3
3.6
7.6
-
-
Canara Bank
Neutral
253
-
13,732
15,441
16,945
2.0
2.1
46.6
70.4
5.4
3.6
0.5
0.4
8.0
11.2
-
-
Dena Bank
Neutral
43
-
2,781
3,440
3,840
2.1
2.3
7.2
10.0
5.9
4.3
0.4
0.4
6.1
7.9
-
-
Federal Bank
Neutral
58
-
9,883
3,477
3,999
3.0
3.0
5.0
6.2
11.5
9.2
1.2
1.0
10.5
11.9
-
-
HDFC
Neutral
1,186
-
187,166
10,358
11,852
3.3
3.3
41.1
47.0
28.9
25.2
5.5
5.0
24.7
24.9
-
-
HDFC Bank
Buy
1,062
1,262
268,055
38,309
47,302
4.3
4.3
49.3
61.0
21.5
17.4
3.7
3.20
18.5
19.7
-
-
ICICI Bank
Buy
263
354
152,967
34,279
39,262
3.3
3.3
21.0
24.4
12.5
10.8
2.1
1.8
14.4
14.7
-
-
IDBI Bank
Neutral
92
-
14,732
9,625
10,455
1.8
1.8
8.5
14.2
10.8
6.5
0.7
0.6
5.9
9.3
-
-
May 2011
Please refer to important disclosures at the end of this report.
16
Stock Watch | December 2015
Company Name
Reco
CMP
Target
Mkt Cap
Sales (` cr)
OPM (%)
EPS (`)
PER (x)
P/BV (x)
RoE (%)
EV/Sales (x)
(`)
Price (`)
(` cr)
FY16E
FY17E
FY16E
FY17E
FY16E
FY17E
FY16E
FY17E
FY16E
FY17E
FY16E
FY17E
FY16E
FY17E
Indian Bank
Neutral
127
-
6,080
6,160
6,858
2.4
2.5
24.5
29.8
5.2
4.2
0.4
0.4
7.7
8.6
-
-
LIC Housing Finance
Buy
462
571
23,333
3,101
3,745
2.5
2.5
33.0
40.2
14.0
11.5
2.6
2.2
19.7
20.5
-
-
Oriental Bank
Neutral
143
-
4,301
7,643
8,373
2.4
2.4
37.2
45.4
3.9
3.2
0.3
0.3
8.2
9.4
-
-
Punjab Natl.Bank
Neutral
134
-
26,312
23,638
26,557
2.8
2.8
17.9
27.2
7.5
4.9
0.7
0.6
8.5
12.0
-
-
South Ind.Bank
Neutral
20
-
2,734
1,965
2,185
2.5
2.5
2.5
3.3
8.1
6.1
0.8
0.7
9.5
11.6
-
-
St Bk of India
Buy
239
283
185,647
82,520
93,299
2.7
2.8
20.0
24.5
11.9
9.8
1.3
1.2
11.5
12.8
-
-
Union Bank
Neutral
166
-
11,377
12,646
14,129
2.3
2.4
31.0
39.1
5.3
4.2
0.6
0.5
9.8
11.4
-
-
Vijaya Bank
Neutral
34
-
2,947
3,536
3,827
1.8
1.9
5.5
6.7
6.2
5.2
0.5
0.5
7.8
8.8
-
-
Yes Bank
Buy
735
921
30,815
7,190
9,011
3.2
3.3
58.2
69.7
12.6
10.6
2.3
1.9
19.2
19.6
-
-
Capital Goods
ACE
Neutral
43
-
424
660
839
4.7
8.2
1.0
3.9
42.9
11.0
1.3
1.2
3.2
11.3
0.8
0.6
BEML
Neutral
1,100
-
4,581
3,277
4,006
6.0
8.9
29.2
64.3
37.7
17.1
2.1
1.9
5.7
11.7
1.5
1.2
BGR Energy
Neutral
120
-
864
3,615
3,181
9.5
9.4
16.7
12.4
7.2
9.7
0.7
0.7
10.0
7.0
0.6
0.8
BHEL
Neutral
169
-
41,389
33,722
35,272
10.8
11.7
10.5
14.2
16.1
11.9
1.2
1.1
7.0
9.0
1.3
1.2
Blue Star
Buy
357
429
3,208
3,548
3,977
6.3
6.9
13.7
17.2
26.0
20.8
6.6
4.3
26.1
25.4
1.0
0.8
Crompton Greaves
Accumulate
192
204
12,062
13,484
14,687
4.9
6.2
4.5
7.1
42.8
27.1
3.0
2.8
7.2
10.8
1.0
0.9
Inox Wind
Buy
357
505
7,920
4,980
5,943
17.0
17.5
26.6
31.6
13.4
11.3
4.0
2.9
35.0
30.0
1.7
1.4
KEC International
Neutral
154
-
3,951
8,791
9,716
6.1
6.8
5.4
8.2
28.5
18.7
2.8
2.6
10.0
14.0
0.7
0.6
Thermax
Neutral
895
-
10,669
6,413
7,525
7.4
8.5
30.5
39.3
29.4
22.8
4.5
3.9
15.0
17.0
1.6
1.3
Cement
ACC
Buy
1,350
1,630
25,350
13,151
14,757
16.4
18.3
63.9
83.4
21.1
16.2
2.7
2.5
13.3
16.1
1.8
1.5
Ambuja Cements
Buy
196
233
30,402
11,564
12,556
19.4
20.7
8.9
10.1
22.0
19.4
2.8
2.6
12.8
13.8
2.3
2.1
HeidelbergCement
Neutral
75
-
1,697
1,772
1,926
13.3
15.4
1.0
3.0
74.9
25.0
1.9
1.8
2.6
7.9
1.5
1.3
India Cements
Buy
86
112
2,633
4,216
4,840
18.0
19.5
4.0
9.9
21.4
8.7
0.9
0.8
4.0
9.5
0.9
0.8
JK Cement
Accumulate
654
744
4,573
3,661
4,742
10.1
15.8
18.0
61.0
36.3
10.7
2.6
2.3
7.5
22.9
1.7
1.3
J K Lakshmi Cement
Buy
331
430
3,900
2,947
3,616
16.7
19.9
11.5
27.2
28.8
12.2
2.7
2.4
9.8
20.8
1.7
1.4
Mangalam Cements
Neutral
211
-
562
1,053
1,347
10.5
13.3
8.4
26.0
25.1
8.1
1.1
1.0
4.3
12.5
0.9
0.7
Orient Cement
Accumulate
163
183
3,335
1,854
2,524
21.2
22.2
7.7
11.1
21.1
14.7
3.0
2.6
13.3
15.7
2.5
1.8
Ramco Cements
Neutral
372
-
8,848
4,036
4,545
20.8
21.3
15.1
18.8
24.6
19.8
3.0
2.7
12.9
14.3
2.7
2.3
Shree Cement^
Neutral
11,193
-
38,993
7,150
8,742
26.7
28.6
228.0
345.5
49.1
32.4
7.2
6.1
15.7
20.3
5.2
4.2
UltraTech Cement
Accumulate
2,864
3,282
78,582
25,021
30,023
19.1
21.6
89.0
132.0
32.2
21.7
3.7
3.2
12.2
15.9
3.2
2.7
Construction
ITNL
Neutral
84
-
2,758
7,360
8,825
34.0
35.9
7.0
9.0
12.0
9.3
0.4
0.4
3.2
3.7
3.7
3.6
KNR Constructions
Accumulate
614
673
1,727
937
1,470
14.3
14.0
33.5
38.6
18.3
15.9
2.8
2.4
15.4
15.4
1.9
1.2
Larsen & Toubro
Buy
1,341
1,646
124,862
65,065
77,009
11.5
11.7
61.5
65.6
21.8
20.4
2.2
2.0
13.4
14.0
2.1
1.8
Gujarat Pipavav Port
Neutral
158
-
7,619
629
684
51.0
52.2
6.4
5.9
24.6
26.7
3.2
3.0
15.9
12.7
11.8
10.6
MBL Infrastructures
Buy
216
285
893
2,313
2,797
12.2
14.6
19.0
20.0
11.3
10.8
1.2
1.1
11.3
10.6
1.1
1.0
Nagarjuna Const.
Neutral
78
-
4,342
7,892
8,842
8.8
9.1
3.0
5.3
26.0
14.7
1.3
1.2
5.0
8.5
0.8
0.7
PNC Infratech
Neutral
533
-
2,732
1,873
2,288
13.2
13.5
24.0
32.0
22.2
16.6
2.2
1.9
12.1
12.3
1.6
1.3
Simplex Infra
Neutral
327
-
1,615
5,955
6,829
10.3
10.5
16.0
31.0
20.4
10.5
1.1
1.0
5.3
9.9
0.8
0.7
Power Mech Projects
Neutral
610
-
897
1,539
1,801
12.8
12.7
59.0
72.1
10.3
8.5
1.6
1.3
18.6
16.8
0.6
0.5
Sadbhav Engineering
Neutral
337
-
5,784
3,481
4,219
10.7
10.8
8.0
12.0
42.2
28.1
3.9
3.4
10.3
13.5
1.9
1.6
NBCC
Accumulate
973
1,089
11,680
7,382
9,506
7.7
8.6
39.8
54.4
24.5
17.9
5.9
4.7
26.7
29.1
1.3
1.0
SIPL
Neutral
100
-
3,531
675
1,042
62.4
64.7
-
-
-
-
3.8
4.3
-
-
16.9
11.4
May 2011
Please refer to important disclosures at the end of this report.
17
Stock Watch | December 2015
Company Name
Reco
CMP
Target
Mkt Cap
Sales (` cr)
OPM (%)
EPS (`)
PER (x)
P/BV (x)
RoE (%)
EV/Sales (x)
(`)
Price (`)
(` cr)
FY16E
FY17E
FY16E
FY17E
FY16E
FY17E
FY16E
FY17E
FY16E
FY17E
FY16E
FY17E
FY16E
FY17E
FMCG
Asian Paints
Neutral
871
-
83,537
16,553
19,160
16.0
16.2
17.7
21.5
49.3
40.5
13.1
11.8
29.4
31.2
4.9
4.2
Britannia
Neutral
2,880
-
34,554
8,065
9,395
9.6
10.2
47.2
65.5
61.0
44.0
20.3
19.2
38.3
41.2
4.1
3.5
Colgate
Neutral
992
-
26,988
4,836
5,490
19.5
19.7
48.5
53.2
20.5
18.6
15.0
13.1
99.8
97.5
5.5
4.8
Dabur India
Neutral
276
-
48,614
9,370
10,265
17.1
17.2
7.3
8.1
37.7
34.1
11.4
9.2
33.7
30.6
5.1
4.6
GlaxoSmith Con*
Neutral
6,044
-
25,416
4,919
5,742
17.2
17.4
168.3
191.2
35.9
31.6
10.2
8.7
28.8
28.9
4.7
4.0
Godrej Consumer
Neutral
1,228
-
41,804
10,168
12,886
16.1
16.1
32.1
38.4
38.3
32.0
7.8
7.2
19.7
21.0
4.2
3.3
HUL
Neutral
832
-
179,980
34,940
38,957
17.5
17.7
20.8
24.7
40.0
33.7
44.5
35.5
110.5
114.2
5.0
4.4
ITC
Buy
314
382
251,857
41,068
45,068
37.8
37.4
13.9
15.9
22.5
19.7
7.5
6.6
34.1
33.8
5.8
5.2
Marico
Neutral
426
-
27,503
6,551
7,766
15.7
16.0
10.4
12.5
41.1
34.1
11.9
9.9
33.2
32.4
4.1
3.5
Nestle*
Accumulate
5,898
6,646
56,869
11,291
12,847
22.2
22.3
158.9
184.6
37.1
32.0
19.4
17.5
55.0
57.3
4.9
4.2
Tata Global
Accumulate
135
144
8,542
8,635
9,072
9.8
9.9
6.5
7.6
20.8
17.8
2.1
2.0
6.8
7.4
0.9
0.9
IT
HCL Tech^
Buy
841
1,132
118,437
42,038
47,503
23.2
23.5
55.8
62.9
15.1
13.4
3.5
2.6
23.0
19.8
2.4
1.9
Infosys
Buy
1,046
1,306
240,226
60,250
66,999
28.0
28.0
58.3
63.7
17.9
16.4
3.8
3.2
20.9
19.7
3.3
2.8
TCS
Buy
2,324
3,165
457,947
111,274
126,852
28.4
28.7
125.4
143.9
18.5
16.2
7.3
6.8
39.9
42.2
3.7
3.2
Tech Mahindra
Buy
544
646
52,569
25,566
28,890
16.0
17.0
26.3
31.9
20.7
17.0
3.7
3.2
17.9
18.6
1.8
1.5
Wipro
Buy
575
719
142,048
52,414
58,704
23.7
23.8
38.4
42.3
15.0
13.6
2.9
2.6
19.5
18.0
2.3
1.9
Media
D B Corp
Accumulate
338
356
6,207
2,241
2,495
27.8
27.9
21.8
25.6
15.5
13.2
4.0
3.6
26.7
28.5
2.7
2.4
HT Media
Neutral
79
-
1,845
2,495
2,603
11.2
11.2
7.3
8.6
10.9
9.2
0.9
0.8
7.4
8.1
0.2
0.2
Jagran Prakashan
Buy
146
169
4,781
2,170
2,355
27.2
26.2
8.9
9.9
16.4
14.8
3.4
3.0
20.9
20.4
2.1
1.9
Sun TV Network
Neutral
378
-
14,900
2,779
3,196
70.2
70.5
22.8
27.3
16.6
13.8
4.1
3.7
26.7
28.3
5.1
4.4
Hindustan Media Ven.
Neutral
276
-
2,024
920
1,031
20.0
20.0
19.2
20.9
14.4
13.2
2.4
2.0
16.4
15.3
1.7
1.5
Metal
Coal India
Buy
328
380
206,893
76,167
84,130
19.9
22.3
22.4
25.8
14.6
12.7
5.3
5.1
35.5
41.0
2.0
1.8
Hind. Zinc
Buy
147
175
62,007
14,641
14,026
50.4
50.4
17.7
16.0
8.3
9.2
1.3
1.2
16.2
13.2
1.8
1.7
Hindalco
Neutral
79
-
16,386
104,356
111,186
8.7
9.5
6.7
11.1
11.8
7.2
0.4
0.4
3.5
5.9
0.7
0.6
JSW Steel
Neutral
975
-
23,557
42,308
45,147
16.4
20.7
(10.3)
49.5
-
19.7
1.1
1.0
(1.0)
5.6
1.6
1.5
NMDC
Neutral
91
-
35,881
8,237
10,893
46.6
44.5
9.9
11.7
9.1
7.8
1.0
0.9
12.4
13.0
4.1
3.2
SAIL
Neutral
47
-
19,226
45,915
53,954
7.2
10.5
1.5
4.4
30.9
10.6
0.4
0.4
2.3
4.1
1.1
0.9
Vedanta
Neutral
91
-
27,053
71,445
81,910
26.2
26.2
12.9
19.2
7.1
4.8
0.5
0.4
7.2
8.9
0.8
0.6
Tata Steel
Neutral
244
-
23,654
126,760
137,307
8.9
11.3
6.4
23.1
38.3
10.6
0.8
0.7
2.0
7.1
0.8
0.7
Oil & Gas
Cairn India
Neutral
136
-
25,433
11,323
12,490
49.4
51.0
20.7
20.6
6.5
6.6
0.4
0.4
6.4
6.1
1.3
0.7
GAIL
Neutral
358
-
45,354
64,856
70,933
9.1
9.6
24.0
28.9
14.9
12.4
1.3
1.2
8.8
9.6
0.9
0.8
ONGC
Neutral
224
-
191,729
154,564
167,321
36.8
37.4
28.6
32.5
7.8
6.9
1.0
0.9
12.7
13.5
1.4
1.3
Petronet LNG
Neutral
244
-
18,289
29,691
31,188
5.8
6.2
12.8
13.4
19.1
18.2
2.8
2.5
15.8
14.8
0.7
0.6
Indian Oil Corp
Accumulate
429
455
104,086
359,607
402,760
5.9
6.1
42.5
48.7
10.1
8.8
1.3
1.2
14.1
14.3
0.4
0.3
Reliance Industries
Accumulate
954
1,050
308,909
304,775
344,392
12.6
13.4
91.3
102.6
10.5
9.3
1.2
1.1
11.8
12.0
0.9
0.8
May 2011
Please refer to important disclosures at the end of this report.
18
Stock Watch | December 2015
Company Name
Reco
CMP
Target
Mkt Cap
Sales (` cr)
OPM (%)
EPS (`)
PER (x)
P/BV (x)
RoE (%)
EV/Sales (x)
(`)
Price (`)
(` cr)
FY16E
FY17E
FY16E
FY17E
FY16E
FY17E
FY16E
FY17E
FY16E
FY17E
FY16E
FY17E
FY16E
FY17E
Pharmaceuticals
Alembic Pharma
Neutral
688
-
12,973
2,658
3,112
24.1
20.2
24.6
23.9
28.0
28.8
10.0
7.7
42.5
30.2
4.9
4.1
Aurobindo Pharma
Accumulate
803
872
46,866
14,923
17,162
23.0
23.0
38.2
43.6
21.0
18.4
6.5
4.9
36.0
30.2
3.5
3.0
Aventis*
Neutral
4,297
-
9,895
2,082
2,371
17.4
20.8
118.2
151.5
36.3
28.4
5.3
4.3
19.9
25.5
4.4
3.7
Cadila Healthcare
Neutral
393
-
40,274
10,224
11,840
21.0
22.0
14.6
17.6
26.9
22.4
7.4
5.8
30.8
29.0
4.0
3.4
Cipla
Neutral
645
-
51,800
14,211
16,611
20.6
19.0
27.0
28.9
23.9
22.3
4.1
3.5
18.4
16.8
3.6
3.0
Dr Reddy's
Buy
3,180
3,933
54,231
16,838
19,575
25.0
23.1
167.5
178.8
19.0
17.8
4.0
3.3
23.1
20.4
3.1
2.7
Dishman Pharma
Neutral
335
-
2,701
1,733
1,906
21.5
21.5
17.0
19.9
19.7
16.8
2.0
1.8
10.5
11.2
2.1
1.8
GSK Pharma*
Neutral
3,266
-
27,667
2,870
3,158
20.0
22.1
59.5
68.3
54.9
47.8
16.2
16.6
28.5
34.3
9.1
8.4
Indoco Remedies
Neutral
314
-
2,893
1,033
1,199
15.9
18.2
9.4
13.6
33.4
23.1
5.0
4.2
15.7
19.7
2.9
2.5
Ipca labs
Buy
757
900
9,554
3,363
3,909
12.9
18.6
13.4
28.0
56.5
27.0
4.0
3.5
7.4
14.0
3.1
2.7
Lupin
Neutral
1,831
-
82,483
13,092
16,561
25.0
27.0
50.4
68.3
36.3
26.8
7.5
5.9
22.8
24.7
6.0
4.6
Sun Pharma
Buy
777
950
187,067
28,163
32,610
25.8
30.7
17.4
26.9
44.7
28.9
4.2
3.7
13.0
16.6
6.1
5.1
Power
Tata Power
Neutral
64
-
17,350
35,923
37,402
22.6
22.8
4.1
5.2
15.8
12.5
1.2
1.1
7.5
9.3
1.4
1.3
NTPC
Buy
130
157
107,438
87,064
98,846
23.4
23.5
11.7
13.2
11.1
9.9
1.2
1.2
11.4
12.1
2.3
2.0
Power Grid
Buy
131
170
68,534
20,702
23,361
86.7
86.4
12.1
13.2
10.8
9.9
1.6
1.4
15.6
15.1
8.2
7.7
Telecom
Bharti Airtel
Neutral
321
-
128,117
101,748
109,191
32.1
31.7
12.0
12.5
26.7
25.6
1.8
1.7
6.9
6.7
1.9
1.7
Idea Cellular
Neutral
137
-
49,392
34,282
36,941
32.0
31.5
5.9
6.2
23.3
22.1
2.1
1.9
9.9
9.3
2.0
1.9
Others
Abbott India
Neutral
5,302
-
11,266
2,715
3,153
14.5
14.1
134.3
152.2
39.5
34.8
9.9
8.1
27.4
25.6
3.9
3.3
Bajaj Electricals
Buy
214
341
2,161
4,719
5,287
5.2
5.8
8.6
12.7
25.0
16.9
2.9
2.5
11.4
14.8
0.5
0.4
Banco Products (India)
Neutral
134
-
957
1,208
1,353
10.9
12.3
10.8
14.5
12.4
9.2
1.4
1.3
11.9
14.5
0.8
0.7
Coffee Day Enterprises
Neutral
253
-
5,217
2,692
2,964
17.0
18.6
-
4.7
-
53.4
3.1
2.9
0.1
5.5
2.3
2.2
Competent Automobiles Neutral
151
-
92
1,040
1,137
3.2
3.1
25.7
28.0
5.8
5.4
0.9
0.8
15.0
14.3
0.1
0.1
Elecon Engineering
Neutral
87
-
945
1,369
1,533
13.7
14.9
3.3
6.1
26.1
14.3
1.7
1.6
6.6
11.4
1.0
0.9
Finolex Cables
Neutral
244
-
3,726
2,520
2,883
12.2
12.0
12.7
14.2
19.2
17.2
2.6
2.3
13.6
13.5
1.2
1.0
Garware Wall Ropes
Accumulate
379
423
830
861
967
10.9
10.9
24.0
28.2
15.8
13.5
2.3
2.0
14.6
14.9
1.0
0.8
Goodyear India*
Accumulate
565
622
1,303
1,888
1,680
12.1
11.9
62.2
56.6
9.1
10.0
2.1
1.8
25.9
19.7
0.5
0.5
Hitachi
Neutral
1,312
-
3,567
1,779
2,081
7.8
8.8
21.8
33.4
60.2
39.2
9.7
7.9
17.4
22.1
2.1
1.7
HSIL
Neutral
308
-
2,230
2,123
2,384
16.1
16.5
15.0
18.9
20.5
16.3
1.6
1.5
8.0
9.4
1.4
1.2
Interglobe Aviation
Neutral
1,045
-
37,641
17,022
21,122
20.7
14.5
63.9
53.7
16.3
19.5
24.5
20.1
149.9
103.2
2.2
1.8
Jyothy Laboratories
Neutral
307
-
5,567
1,620
1,847
11.5
11.5
7.3
8.5
42.2
36.3
5.4
5.0
13.3
14.4
3.3
2.8
Kirloskar Engines India
Neutral
263
-
3,806
2,471
2,826
8.8
10.4
9.1
13.3
28.8
19.7
2.7
2.6
9.7
13.4
1.2
1.0
Linc Pen & Plastics
Neutral
176
-
261
340
371
8.3
8.9
10.8
13.2
16.3
13.4
2.6
2.3
16.0
17.1
0.8
0.7
M M Forgings
Buy
533
614
643
511
615
21.7
21.6
43.1
55.8
12.4
9.6
2.3
1.8
19.9
21.2
1.5
1.1
MRF
Buy
39,167
45,575
16,611
20,316
14,488
21.4
21.1
5,488.0
3,797.9
7.1
10.3
2.4
2.0
41.1
21.2
0.8
1.0
MT Educare
Buy
141
169
560
286
366
18.3
17.7
7.7
9.4
18.2
15.0
3.8
3.2
20.2
21.1
1.9
1.4
May 2011
Please refer to important disclosures at the end of this report.
19
Stock Watch | December 2015
Company Name
Reco
CMP
Target
Mkt Cap
Sales (` cr)
OPM (%)
EPS (`)
PER (x)
P/BV (x)
RoE (%)
EV/Sales (x)
(`)
Price (`)
(` cr)
FY16E
FY17E FY16E FY17E FY16E
FY17E FY16E
FY17E FY16E FY17E FY16E FY17E FY16E FY17E
Navneet Education
Accumulate
86
97
2,050
998
1,062
24.1
24.0
5.8
6.1
15.0
14.1
3.3
2.9
22.0
20.5
2.1
2.0
Nilkamal
Neutral
1,043
-
1,556
1,910
2,083
10.5
10.3
63.3
69.2
16.5
15.1
2.7
2.3
17.6
16.5
0.9
0.8
Page Industries
Neutral
12,839
-
14,321
1,929
2,450
19.8
20.1
229.9
299.0
55.8
42.9
24.6
17.1
52.1
47.0
7.4
5.8
Radico Khaitan
Buy
109
156
1,445
1,565
1,687
12.2
13.0
5.7
7.1
19.1
15.3
1.6
1.5
8.3
9.5
1.4
1.3
Relaxo Footwears
Neutral
491
-
5,889
1,767
2,152
12.3
12.5
19.2
25.1
25.5
19.6
6.3
4.8
27.7
27.8
3.4
2.8
Siyaram Silk Mills
Buy
1,165
1,354
1,092
1,636
1,815
11.5
11.5
89.9
104.1
13.0
11.2
2.1
1.9
17.9
17.8
0.8
0.7
Styrolution ABS India*
Neutral
719
-
1,264
1,271
1,440
8.6
9.2
32.0
41.1
22.4
17.5
2.3
2.1
10.7
12.4
1.0
0.8
Surya Roshni
Buy
135
183
590
2,992
3,223
8.1
8.4
14.7
18.3
9.2
7.3
0.9
0.8
9.7
11.0
0.5
0.4
The Byke Hospitality
Accumulate
165
181
661
222
287
20.5
20.5
5.6
7.6
29.2
21.8
5.5
4.5
18.8
20.7
3.0
2.3
Transport Corp. of India Neutral
337
-
2,564
2,830
3,350
8.8
9.0
14.4
18.3
23.5
18.4
3.6
3.1
15.4
17.1
1.0
0.9
TVS Srichakra
Accumulate
2,851
3,240
2,183
2,101
2,338
15.7
15.0
248.6
270.0
11.5
10.6
5.0
3.6
43.6
34.0
1.1
0.9
Visaka Industries
Accumulate
129
144
205
1,086
1,197
9.9
10.2
21.5
28.7
6.0
4.5
0.6
0.5
9.6
11.6
0.4
0.3
Wonderla Holidays
Neutral
390
-
2,205
206
308
44.0
43.6
9.0
12.9
43.4
30.3
5.9
5.4
13.7
17.8
10.6
7.1
Source: Company, Angel Research, Note: *December year end; #September year end; &October year end; ^June year end; Price as of December 7, 2015; Sesa Goa's numbers reflect the standalone Sesa Goa business only. We will revise our numbers once
the consolidated entity Sesa- Sterlite is formed
May 2011
Please refer to important disclosures at the end of this report.
20
Disclaimer
Angel Broking Private Limited (hereinafter referred to as "Angel") is a registered Member of National Stock Exchange of India Limited,
Bombay Stock Exchange Limited and Metropolitan Stock Exchange of India Limited. It is also registered as a Depository Participant with CDSL
and Portfolio Manager with SEBI. It also has registration with AMFI as a Mutual Fund Distributor. Angel Broking Private Limited is a registered
entity with SEBI for Research Analyst in terms of SEBI (Research Analyst) Regulations, 2014 vide registration number INH000000164. Angel
or its associates has not been debarred/ suspended by SEBI or any other regulatory authority for accessing /dealing in securities Market.
Angel or its associates including its relatives/analyst do not hold any financial interest/beneficial ownership of more than 1% in the company
covered by Analyst. Angel or its associates/analyst has not received any compensation / managed or co-managed public offering of
securities of the company covered by Analyst during the past twelve months. Angel/analyst has not served as an officer, director or employee
of company covered by Analyst and has not been engaged in market making activity of the company covered by Analyst.
This document is solely for the personal information of the recipient, and must not be singularly used as the basis of any investment decision.
Nothing in this document should be construed as investment or financial advice. Each recipient of this document should make such investigations
as they deem necessary to arrive at an independent evaluation of an investment in the securities of the companies referred to in this
document (including the merits and risks involved), and should consult their own advisors to determine the merits and risks of such an
investment.
Reports based on technical and derivative analysis center on studying charts of a stock's price movement, outstanding positions and trading
volume, as opposed to focusing on a company's fundamentals and, as such, may not match with a report on a company's fundamentals.
The information in this document has been printed on the basis of publicly available information, internal data and other reliable sources
believed to be true, but we do not represent that it is accurate or complete and it should not be relied on as such, as this document is for
general guidance only. Angel Broking Pvt. Limited or any of its affiliates/ group companies shall not be in any way responsible for any loss
or damage that may arise to any person from any inadvertent error in the information contained in this report. Angel Broking Pvt. Limited
has not independently verified all the information contained within this document. Accordingly, we cannot testify, nor make any representation
or warranty, express or implied, to the accuracy, contents or data contained within this document. While Angel Broking Pvt. Limited endeavors
to update on a reasonable basis the information discussed in this material, there may be regulatory, compliance, or other reasons that
prevent us from doing so.
This document is being supplied to you solely for your information, and its contents, information or data may not be reproduced, redistributed
or passed on, directly or indirectly.
Neither Angel Broking Pvt. Limited, nor its directors, employees or affiliates shall be liable for any loss or damage that may arise from or in
connection with the use of this information.
Note: Please refer to the important 'Stock Holding Disclosure' report on the Angel website (Research Section). Also, please refer to the latest
update on respective stocks for the disclosure status in respect of those stocks. Angel Broking Pvt. Limited and its affiliates may have
investment positions in the stocks recommended in this report.
Buy (> 15%)
Accumulate (5% to 15%)
Neutral (-5 to 5%)
Ratings (Returns) :
Reduce (-5% to -15%)
Sell (< -15%)
6th Floor, Ackruti Star, Central Road, MIDC, Andheri (E), Mumbai - 400 093. Tel: (022) 39357800
Research Team
Fundamental:
Sarabjit Kour Nangra
VP-Research (Pharmaceutical, IT)
Vaibhav Agrawal
VP-Research (Banking)
Amarjeet Maurya
Analyst (FMCG, Media, Mid-Cap)
Bharat Gianani
Analyst (Automobile)
Chintan Shah
Analyst (Banking)
Milan Desai
Analyst (Mid-Cap)
Rahul Dholam
Analyst (Metal, Oil & Gas, Power)
Santosh Yellapu
Analyst (Infrastructure)
Tejas Vahalia
Research Editor
Technicals and Derivatives:
Siddarth Bhamre
Head - Technical & Derivatives
Sameet Chavan
Technical Analyst
Ruchit Jain
Technical Analyst
Jay Kumar Purohit
Technical Analyst
Sneha Seth
Associate (Derivatives)
Production Team:
Dilip Patel
Production Incharge
CSO & Registered Office: G-1, Ackruti Trade Centre, Rd. No. 7, MIDC, Andheri (E), Mumbai - 400 093.Tel.: (022) 3083 7700. Angel Broking Pvt. Ltd: BSE Sebi Regn No: INB010996539 / PMS Regd Code: PM/INP000001546 / CDSL Regn No:
IN - DP - CDSL - 234 - 2004 / NSE Sebi Regn Nos: Cash: INB231279838 / NSE F&O: INF231279838 / Currency: INE231279838 / MCX Currency Sebi Regn No: INE261279838 / Member ID: 10500 / Angel Commodities Broking Pvt. Ltd: MCX
Member ID: 12685 / FMC Regn No: MCX / TCM / CORP / 0037 NCDEX : Member ID 00220 / FMC Regn No: NCDEX / TCM / CORP / 0302