October
3
1
, 2023
www.angelone.in
Technical & Derivatives Report
8
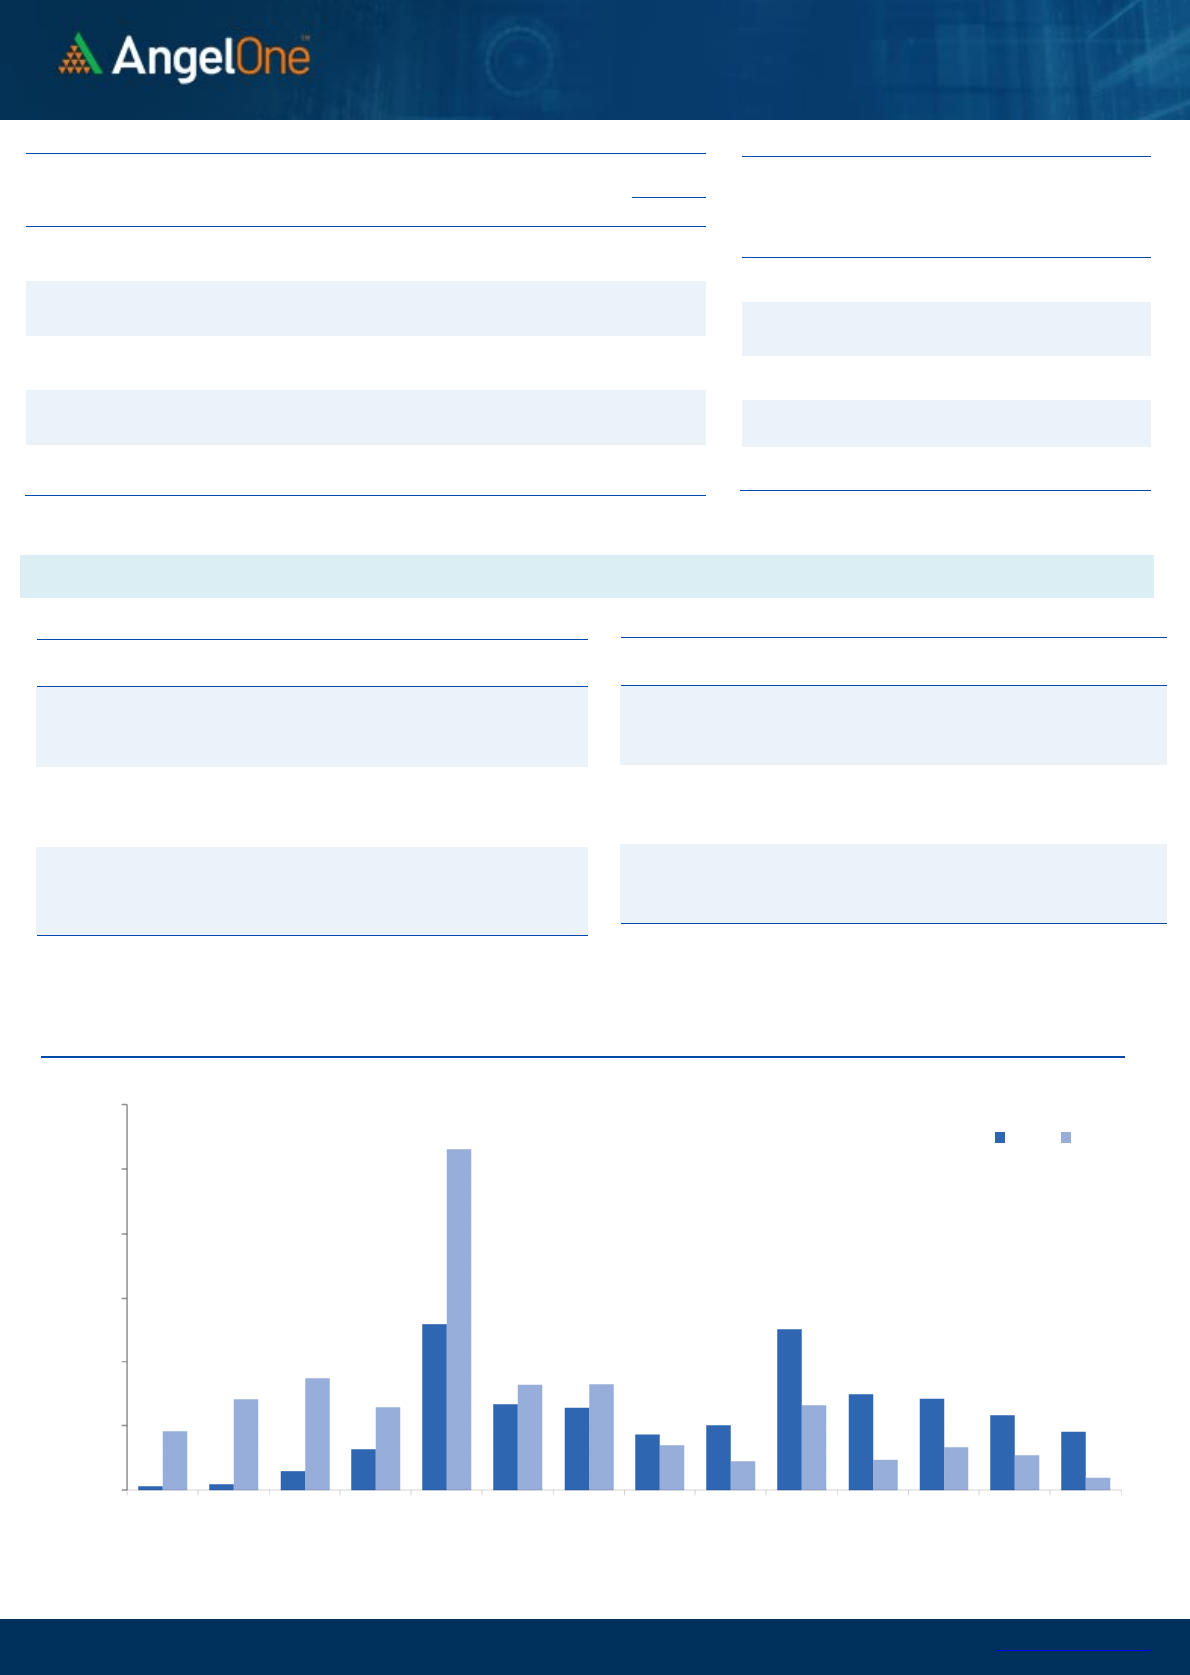
Nifty Bank Outlook (
4
3039
)
In contrast to the benchmark index, the banking index opened the
week with a modestly negative stance. Fresh selling pressure was
evident right from the beginning, testing 42400 in the initial thirty
minutes of trade. Nevertheless, the index quickly stabilized,
demonstrating a robust recovery that not only fully recouped the
initial losses but also surpassed the psychological threshold of
43000. With a final surge towards the end of the trading session, the
banking index settled the second consecutive session in positive
territory, achieving gains of six-tenth of a percent to Friday’s close.
The initial selling observed was indeed alarming as the index even
tested Friday's low of 42482.75. Fortunately, the Bulls made a strong
comeback and capitalized on these intraday dips. However, it is vital
to keep a close tab on a follow-up move beyond the hurdles at 43100
and 43400 in the upcoming trading sessions. It's worth noting that only
a sustainable move beyond 44000 would confirm the completion of
the corrective phase.
Key Levels
Support 1 – 42500 Resistance 1 – 43100
Support 2 – 42300 Resistance 2 – 43400
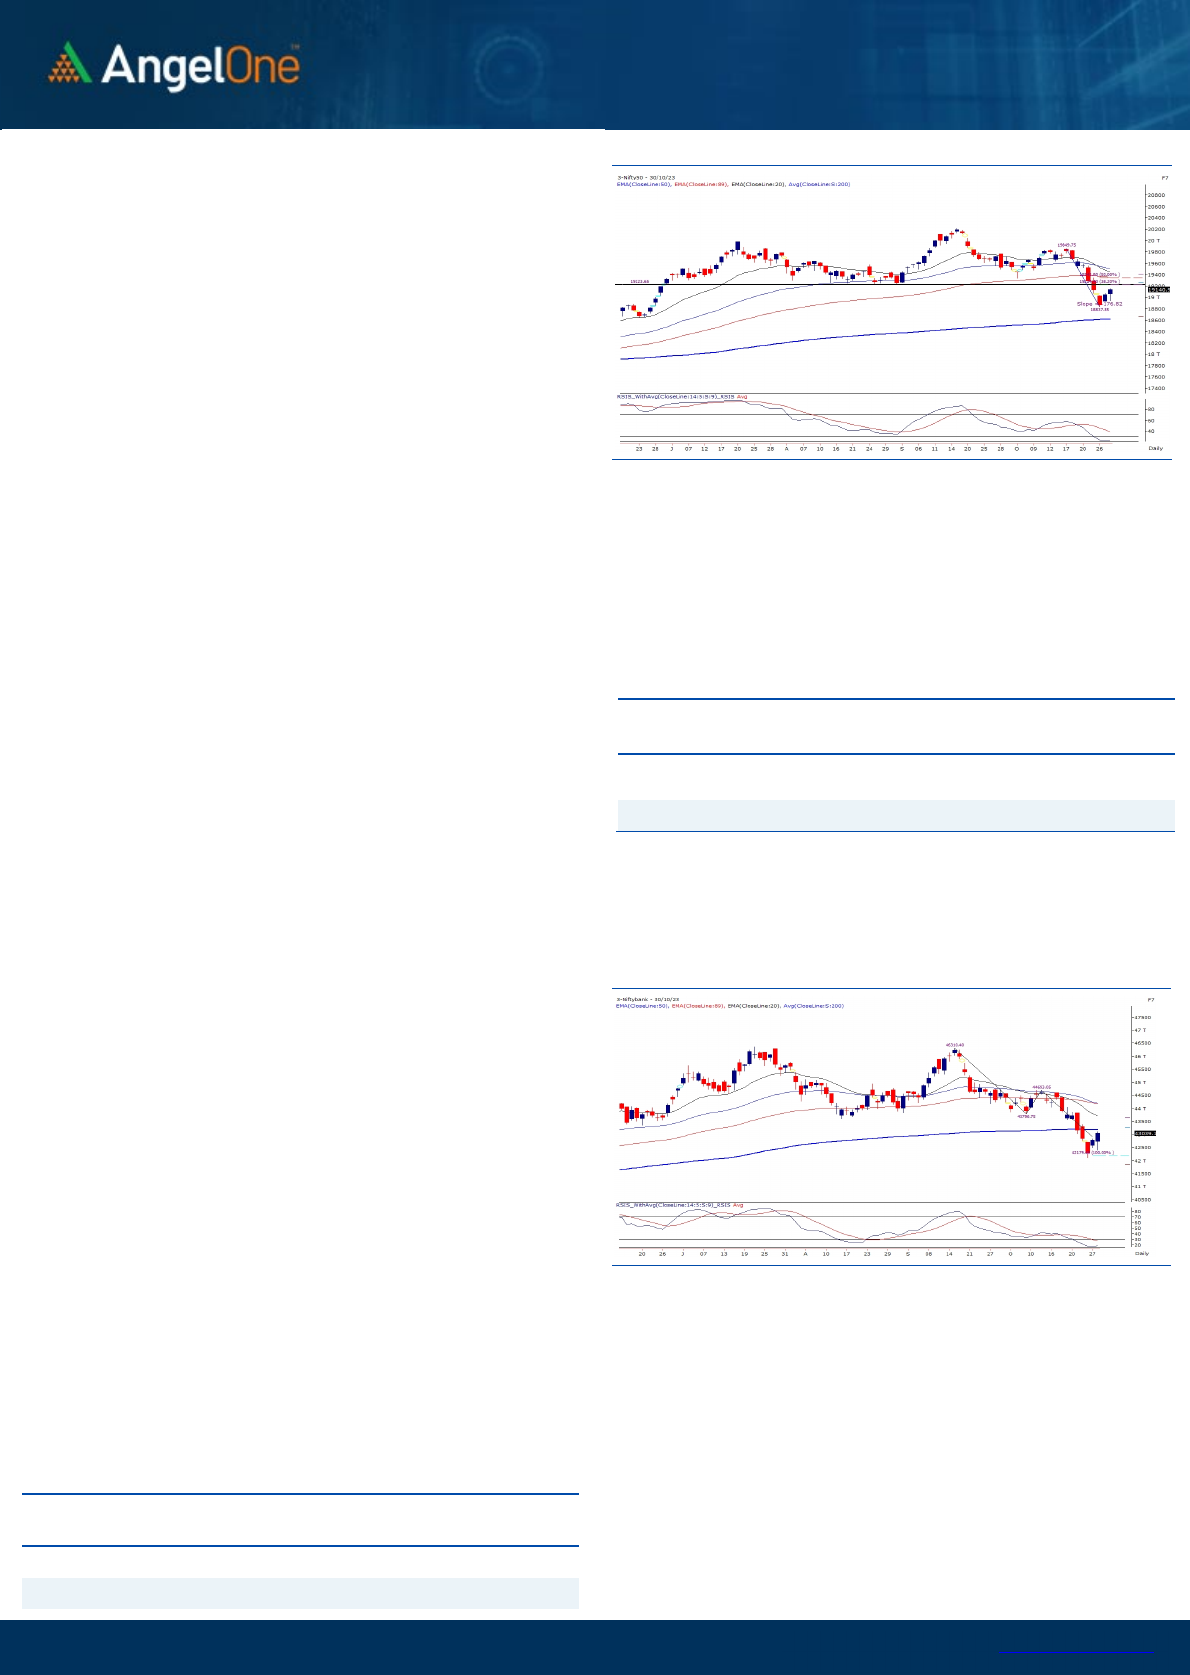
Exhibit 1: Nifty Daily Chart
Exhibit 2: Nifty Bank Daily Chart
Sensex (
6
4113
) / Nifty (
1
9
141
)
In the morning, the Asian bourses and Gift Nifty experienced a shaky
beginning, but despite these signs of weakness, the benchmark index
had a stable start. However, as the day progressed, there was a
significant drop in prices during the initial hour. Later in the day, there
was a strong recovery, and Nifty maintained a positive trend for the
most part of the session, closing at 19141 with half-percent gain.
Following the turmoil seen during the fag end of October contract, the
November series has started on a strong note, witnessing decent price
increases over the last two sessions. Nevertheless, caution is advised as
we believe that uncertainties persist. It's important not to become too
complacent with long positions, as strong overhead resistance is seen
at higher levels at regular intervals. Last week, prices experienced a
significant breakdown, falling below the crucial 19200 level, which
triggered a substantial sell-off. Now, prices are nearing the same key
area, ranging from 19200 to 19250, which has transitioned into a
formidable resistance zone. The current rebound is attributed to
oversold conditions, and the extent to which prices may rise remains
uncertain. Traders are advised to adopt a cautious, step-by-step
approach and closely monitor how prices react to this resistance in the
upcoming sessions. Furthermore, the 89EMA coinciding with
50% retracement level of the recent fall around 19350 is also a key
resistance level to watch. On the downside, there was buying during
intraday dip, and a higher bottom formation on the hourly chart around
18940 now acts as immediate support, before which 19000 is also a
significant support level.
Going ahead, we sense, the market may consolidate within a range
in the near term, and traders should keep a close eye on these levels
when planning their trades. We witnessed trading opportunities in
individual stocks on both sides of the trend, traders should focus on
same, but caution is advised, and aggressive overnight positions
should be avoided due to global uncertainties looming in the
background.
Key Levels
Support 1 – 19000 Resistance 1 – 19250
Support 2 – 18950 Resistance 2 – 19350
Until such confirmation is achieved, we recommend avoiding
aggressive bets in the index and adhering to a one step at a time
approach. As for support levels, consider 42500 to 42300 as
immediate support zones.

www.angelone.in
Technical & Derivatives Report
October
3
1
,
2023
View
The Indian Equity started the Nov month series on a
positive note amidst global stability. The benchmark
index Nifty50 surged nearly 0.50 percent at the start
of the week and settled near 19150.
FIIs were net sellers in the cash market segment to
the tune of Rs. 1762 cr. Simultaneously, they sold
worth Rs. 298 cr in Index futures with an increase in
open interest, indicating short addition.
On the derivatives front, net longs were seen in the
key indices at the start of the week. On the options
front, a decent piling of OI is seen at 19100-19000
put strikes, suggesting primary support for Nifty.
While on the higher end, some unwinding was seen
in 19200 CE, indicating call writers shifting positions.
However, FIIs remained net sellers in equities and
the index futures segments; Long Short Ratio
remains unchanged at 12%. Considering the recent
data, our market seems to consolidate in the near
period; hence, it is advisable to stay very selective
among stock preferences and avoid aggressive bets
on either side for the time being.
Comments
The Nifty futures open interest has increased by 2.17%
and Bank Nifty futures open interest has increased by
6.14% as the market closed at 19140.90.
The Nifty November future closed with a premium of
80 points against a premium of 84.10 points in the last
trading session. The December series closed at a
premium of 185.15 points.
The INDIA VIX has increased from 10.91 to 11.49. At the
same time, the PCR-OI of Nifty has increased from 0.96
to 1.10.
A few of the liquid counters where we have seen high
cost of carry are PETRONET, M&MFIN, SBICARD,
INDIAMART and COROMANDEL.
Historical Volatility
SCRIP HV
IGL 38.31
MGL 37.27
HAVELLS 30.22
ITC 23.52
MPHASIS 37.47
Nifty Vs OI
18200
18400
18600
18800
19000
19200
19400
19600
19800
20000
20200
9,000
10,000
11,000
12,000
13,000
14,000
10-12 10-16 10-18 10-23 10-26 10-28
Openinterest Nifty
OI Gainers
SCRIP OI
OI
CHG. (%)
PRICE
PRICE
CHG. (%)
SBICARD 11277600 32.24 750.35 -6.52
PETRONET 29157000 32.11 201.70 -8.56
COROMANDEL 1500100 32.04 1040.80 -4.02
AUBANK 14176000 22.43 665.95 -4.39
M&MFIN 40118000 20.60 245.50 -11.98
INDIAMART 737400 14.81 2634.35 -6.42
UPL 35176700 12.05 538.65 -3.67
DLF 35253900 10.56 554.45 3.64
OI Losers
SCRIP OI
OI
CHG. (%)
PRICE
PRICE
CHG. (%)
DIXON 17600 -12.00 5104.10 -5.15
MGL 2498400 -9.29 1017.15 3.11
CIPLA 9793550 -8.44 1193.45 1.39
INDHOTEL 24580000 -6.03 382.10 1.95
TATACOMM 7008000 -4.49 1647.70 2.09
SRF 3749625 -4.31 2181.45 0.20
PAGEIND 146820 -4.11 37555.80 0.08
ZYDUSLIFE 6731100 -3.53 580.25 0.91
Put-Call Ratio
SCRIP PCR (OI) PCR (VOL)
NIFTY 1.10 0.88
BANKNIFTY 1.18 0.78
RELIANCE 0.77 0.42
ICICIBANK 0.70 0.49
INFY 0.57 0.40
www.angelone.in
Technical & Derivatives Report
October
3
1
,
2023
Note: Above mentioned Bullish or Bearish Spreads in Nifty (Nov Series) are given as an information and not as a recommendation.
Nifty Spot =
1
9
140
.
90
FII Statistics for
October
30
, 2023
Detail Buy
Contracts
OI Value
(in Cr.)
Sell Net
CHANGE
INDEX
FUTURES
3525.68 3823.49 (297.81) 209752 17066.25 3.51
INDEX
OPTIONS
1285606.07 1316229.32 (30623.25) 4395740 357165.29 19.06
STOCK
FUTURES
13599.33 15257.38 (1658.05) 2504368 170636.60 0.34
STOCK
OPTIONS
16270.23 16065.46 204.77
120421 8320.49 22.66
Total
1319001.31
1351375.65
(32374.34) 7230281
553188.63
11.43
Turnover on
October
30
, 2023
Instrument
No. of
Contracts
Turnover
(in Cr.)
Change
(%)
Index Futures
338993 26080.71
21.95
Index Options
377466766
58371.16
37.27
Stock Futures
910907 62226.70
-0.89
Stock Options
3498924 4126.12 -8.83
Total
34,98,924 4126.12 14.92
Bull-Call Spreads
Action Strike Price Risk Reward BEP
Buy
19100
309.15 60.30
39.70
19160.30
Sell
19200
248.85
Buy
19100 309.15 113.10
86.90
19213.10
Sell
19300 196.05
Buy
19200
248.85 52.80 47.20 19252.80
Sell
19300 196.05
Bear-Put Spreads
Action Strike Price Risk Reward BEP
Buy
19300 268.65
42.20
57.80
19257.80
Sell 19200 226.45
Buy 19300 268.65
82.45
117.55
19217.55
Sell
19100 186.20
Buy
19200 226.45
40.25 59.75 19159.75
Sell 19100 186.20
Nifty Put
-
Call Analysis
,0
1000,000
2000,000
3000,000
4000,000
5000,000
6000,000
18600 18700 18800 18900 19000 19100 19200 19300 19400 19500 19600 19700 19800 19900
Call Put

www.angelone.in
Technical & Derivatives Report
October
3
1
,
2023
`
Daily Pivot Levels for Nifty Constituents
Scrips S2 S1 PIVOT R1 R2
ADANIENT 2,230 2,264 2,285 2,319 2,340
ADANIPORTS 772 778 786 793 801
APOLLOHOSP 4,746 4,794 4,831 4,879 4,916
ASIANPAINT 2,913 2,940 2,966 2,993 3,019
AXISBANK 967 978 990 1,002 1,014
BAJAJ-AUTO 5,204 5,257 5,327 5,379 5,450
BAJFINANCE 7,286 7,395 7,461 7,569 7,635
BAJAJFINSV 1,510 1,536 1,553 1,579 1,597
BPCL 333 340 344 352 356
BHARTIARTL 901 914 923 935 944
BRITANNIA 4,403 4,432 4,470 4,500 4,538
CIPLA 1,160 1,177 1,194 1,211 1,229
COALINDIA 310 312 314 316 318
DIVISLAB 3,349 3,376 3,412 3,439 3,474
DRREDDY 5,127 5,236 5,315 5,424 5,503
EICHERMOT 3,283 3,321 3,373 3,410 3,463
GRASIM 1,809 1,844 1,863 1,898 1,917
HCLTECH 1,246 1,256 1,265 1,274 1,284
HDFCBANK 1,451 1,468 1,479 1,496 1,507
HDFCLIFE 592 600 609 617 626
HEROMOTOCO 3,024 3,067 3,098 3,141 3,172
HINDALCO 450 453 457 461 465
HINDUNILVR 2,448 2,464 2,478 2,493 2,507
ICICIBANK 902 913 920 931 938
INDUSINDBK 1,415 1,435 1,448 1,468 1,481
INFY 1,356 1,367 1,374 1,384 1,391
ITC 423 427 432 436 441
JSW STEEL 722 728 732 739 743
KOTAKBANK 1,676 1,697 1,709 1,729 1,741
LT 2,829 2,878 2,905 2,954 2,981
LTIMINDTREE 5,042 5,096 5,137 5,190 5,231
M&M 1,440 1,469 1,492 1,521 1,544
MARUTI 9,993 10,195 10,448 10,650 10,903
NESTLEIND 23,711 23,941 24,096 24,326 24,481
NTPC 227 231 235 238 242
ONGC 183 186 188 190 192
POWERGRID 196 198 200 203 205
RELIANCE 2,247 2,280 2,302 2,335 2,358
SBILIFE 1,295 1,311 1,321 1,336 1,346
SBIN 553 559 563 569 573
SUNPHARMA 1,097 1,106 1,113 1,122 1,129
TCS 3,316 3,347 3,365 3,396 3,414
TATACONSUM
874 884 890 900 906
TATAMOTORS 609 619 631 641 653
TATASTEEL 117 118 120 121 122
TECHM 1,104 1,115 1,127 1,139 1,151
TITAN 3,058 3,087 3,104 3,134 3,151
ULTRACEMCO 8,120 8,261 8,338 8,479 8,557
UPL 513 526 545 557 576
WIPRO 378 380 382 384 386

www.angelone.in
Technical & Derivatives Report
October
3
1
,
2023
Technical and Derivatives Team:
Sameet Chavan Head Research – Technical & Derivatives sameet.chavan@angelone.in
Sneha Seth Senior Analyst – Technical & Derivatives sneha.seth@angelone.in
Rajesh Bhosale Analyst - Technical rajesh.bhosle@angelone.in
Osho Krishan Senior Analyst – Technical & Derivatives osho.krishan@angelone.in
Hitesh Rathi Analyst – Technical & Derivatives hitesh.rathi@angelone.in
Research Team Tel: 022 – 39357600 Website: www.angelone.in
For Technical Queries E-mail: technicalresearch-cso@angelone.in
For Derivatives Queries E-mail: derivatives.desk@angelone.in
DISCLAIMER
We, Angel One Limited (hereinafter referred to as “Angel”) a company duly incorporated under the provisions of the Companies Act, 1956 with
its registered office at 601, 6th Floor, Ackruti Star, Central Road, MIDC, Andheri East, Mumbai – 400093, CIN: (L67120MH1996PLC101709) and
duly registered as a member of National Stock Exchange of India Limited, Bombay Stock Exchange Limited, Metropolitan Stock Exchange Limited,
Multi Commodity Exchange of India Ltd and National Commodity & Derivatives Exchange Ltd. Angel One limited is a company engaged in
diversified financial services business including securities broking, DP services, distribution of Mutual Fund products. It is also registered as a
Depository Participant with CDSL and Portfolio Manager and Investment Adviser with SEBI. It also has registration with AMFI as a Mutual Fund
Distributor. Angel One Limited is a registered entity with SEBI for Research Analyst in terms of SEBI (Research Analyst) Regulations, 2014 vide
registration number INH000000164 and also registered with PFRDA as PoP ,Registration No.19092018. Angel Group does not have any joint
ventures or associates. Angel One Limited is the ultimate parent company of the Group. Angel or its associates has not been debarred/ suspended
by SEBI or any other regulatory authority for accessing /dealing in securities Market.
AOL was merged with Angel Global Capital Private Limited and subsequently name of Angel Global Capital Private Limited was changed to Angel
Broking Private Limited (AOL) pursuant to scheme of Amalgamation sanctioned by the Hon'ble High Court of Judicature at Bombay by Orders
passed in Company Petition No 710 of 2011 and the approval granted by the Registrar of Companies. Further, name of Angel Broking Private
Limited again got changed to Angel Broking Limited (AOL) pursuant to fresh certificate of incorporation issued by Registrar of Companies (ROC)
dated June 28, 2018. Further name of Angel Broking name changed to Angel One Ltd pursuant to fresh certificate of incorporation issued by
Registrar of Companies (ROC) dated 23-09-21.
In case of any grievances please write to: support@angelone.in, Compliance Officer Details: Name : Hiren Thakkar, Tel No. –08657864228, Email
id - compliance@angelone.in
Registration granted by SEBI and certification from NISM in no way guarantee performance of the intermediary or provide any assurance of returns
to investors.
This document is solely for the personal information of the recipient, and must not be singularly used as the basis of any investment decision.
Nothing in this document should be construed as investment or financial advice. Each recipient of this document should make such investigations
as they deem necessary to arrive at an independent evaluation of an investment in the securities of the companies referred to in this document
(including the merits and risks involved), and should consult their own advisors to determine the merits and risks of such an investment.
Angel or its associates or research analyst or his relative may have actual/beneficial ownership of 1% or more in the securities of the subject
company at the end of the month immediately preceding the date of publication of the research report. Neither Angel or its associates nor
Research Analysts or his relative has any material conflict of interest at the time of publication of research report.
Angel or its associates might have received any compensation from the companies mentioned in the report during the period preceding twelve
months from the date of this report for services in respect of managing or co-managing public offerings, corporate finance, investment banking or
merchant banking, brokerage services or other advisory service in a merger or specific transaction in the normal course of business. Angel or its
associates did not receive any compensation or other benefits from the companies mentioned in the report or third party in connection with the
research report. Neither research entity nor research analyst has been engaged in market making activity for the subject company.

www.angelone.in
Technical & Derivatives Report
October
3
1
,
2023
*
Reports based on technical and derivative analysis center on studying charts of a stock's price movement, outstanding positions and trading
volume, as opposed to focusing on a company's fundamentals and, as such, may not match with a report on a company's fundamentals. Investors
are advised to refer the Fundamental and Technical Research Reports available on our website to evaluate the contrary view, if any.
The information in this document has been printed on the basis of publicly available information, internal data and other reliable sources believed
to be true, but we do not represent that it is accurate or complete and it should not be relied on as such, as this document is for general guidance
only. Angel One Limited or any of its affiliates/ group companies shall not be in any way responsible for any loss or damage that may arise to any
person from any inadvertent error in the information contained in this report. Angel One Limited does not warrant the accuracy, adequacy or
completeness of the service, information and materials and expressly disclaims liability for errors or omissions in the service, information and
materials. While Angel One Limited endeavours to update on a reasonable basis the information discussed in this material, there may be
regulatory, compliance, or other reasons that prevent us from doing so.
This document is being supplied to you solely for your information, and its contents, information or data may not be reproduced, redistributed or
passed on, directly or indirectly.
Neither Angel One Limited, nor its directors, employees or affiliates shall be liable for any loss or damage that may arise from or in connection
with the use of this information. Angel or its associates or Research Analyst or his relative might have financial interest in the subject company.
Research analyst has not served as an officer, director or employee of the subject company.
Investment in securities market are subject to market risks. Read all the related documents carefully before investing.
Any communication sent to clients on phone numbers or e-mail ids registered with the Trading Member is meant for client consumption and such
material should not be redistributed. Brokerage will not exceed SEBI prescribed limit. Any Information provided by us through any medium based
on our research or that of our affiliates or third parties or other external sources is subject to domestic and international market conditions and
we do not guarantee the availability or otherwise of any securities or other instruments and such Information is merely an estimation of certain
investments, and we have not and shall not be deemed to have assumed any responsibility for any such Information. You should seek independent
professional advice and/or tax advice regarding the suitability of any investment decision whether based on any Information provided by us
through the Site from inhouse research or third party reports or otherwise.
The report and information contained herein is strictly confidential and meant solely for the selected recipient and may not be altered in any way,
transmitted to, copied or distributed, in part or in whole, to any other person or to the media or reproduced in any form, without prior written
consent.
