OCT 31, 2022
www.angelone.in
Technical & Derivatives Report
xOOOOOOOO
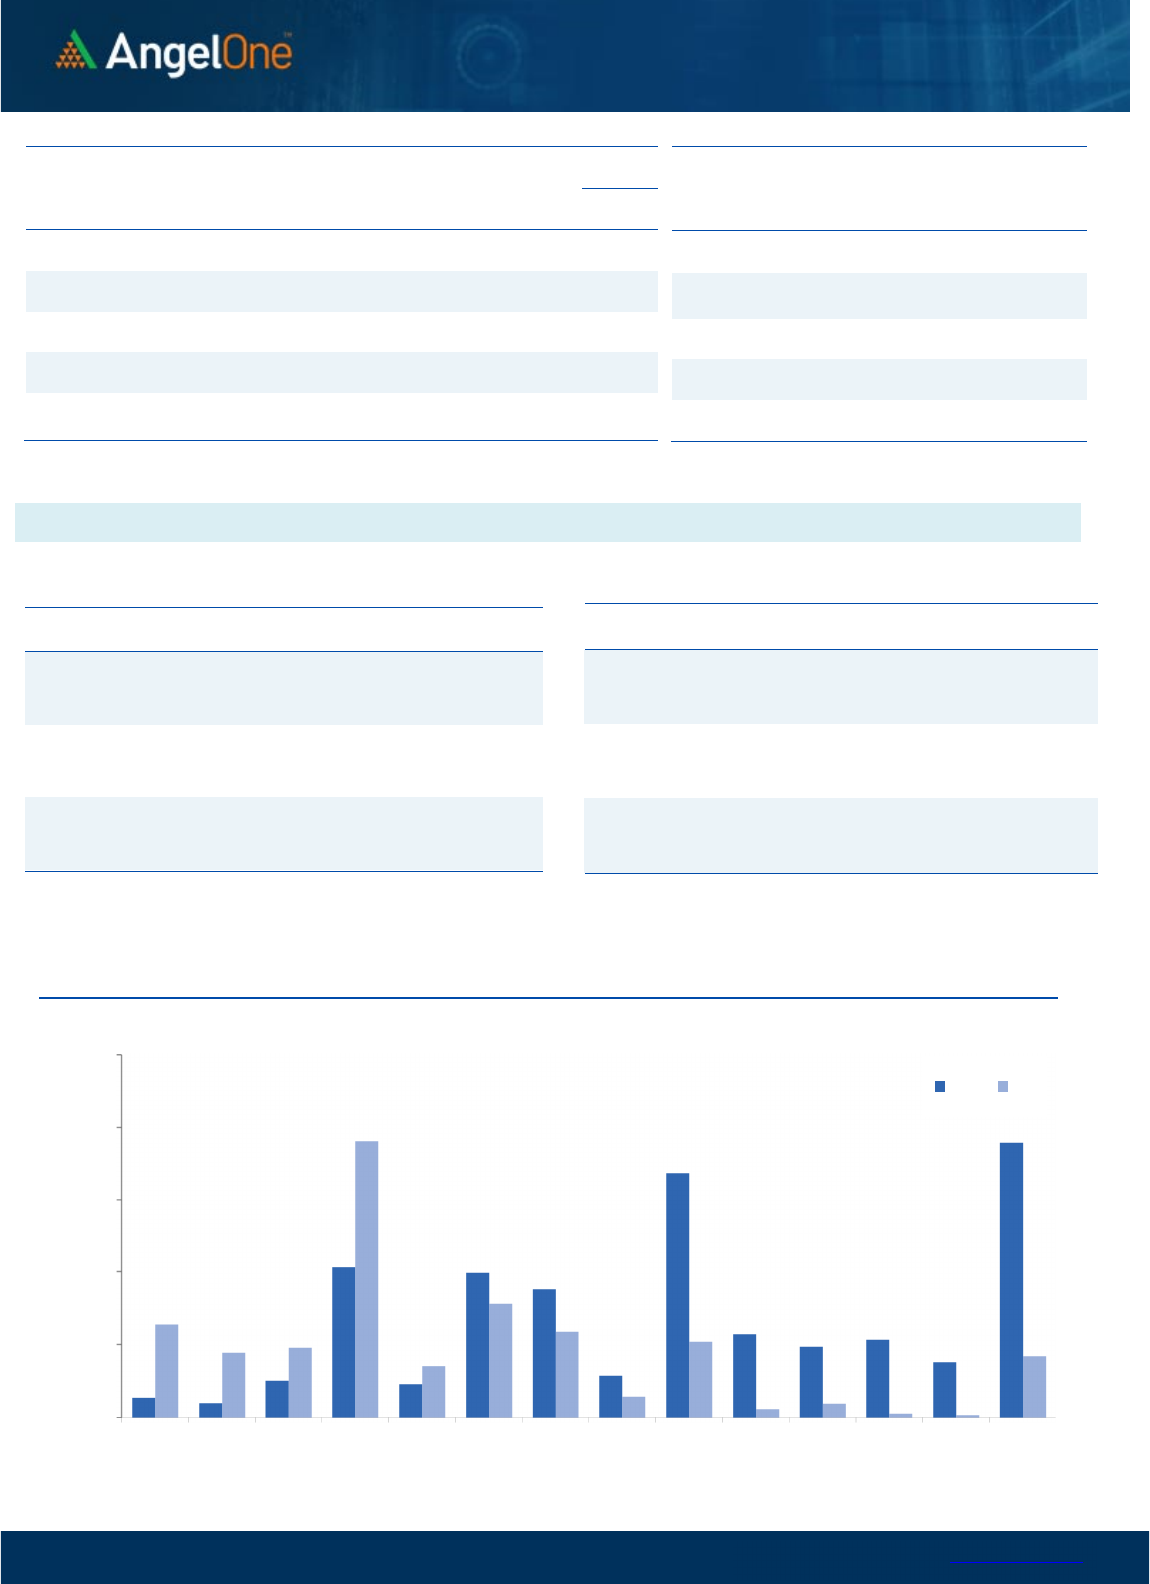
Nifty Bank Outlook (40911)
The Bank Nifty index has witnessed a subdued move throughout
the week and has slightly underperformed the benchmark index.
On weekly basis, the index has surged 0.51 percent and maintained
its positive stature for the fourth consecutive week. The index has
sustained at higher grounds throughout the truncated week and
settled a tad below the 41000 mark.
On the technical aspect, the banking index is still in the bullish
trajectory as it hovers well above all its major exponential moving
averages on the daily chart. However, some tentativeness was
evident as the index hesitated to re-test the lifetime highs post a
promising start of the week. Meanwhile, the undertone is strongly
upbeat, wherein any minor correction could be seen as an
opportunity to add fresh longs. As far as levels are concerned, the
unfilled gap placed around 40350-40200 is likely to act as the
sacrosanct support zone in this week. While on the flip side, the
lifetime highs of the 41800-41850 odd zone is to be seen as
intermediate resistance, and any breach above the same could
trigger the next leg of a rally in the banking space.
Key Levels
Support 1 – 40500 Resistance 1 – 41600
Support 2 – 40350 Resistance 2 – 41850
Exhibit 1: Nifty
Daily
Chart
Exhibit 2: Nifty Bank
Daily
Chart
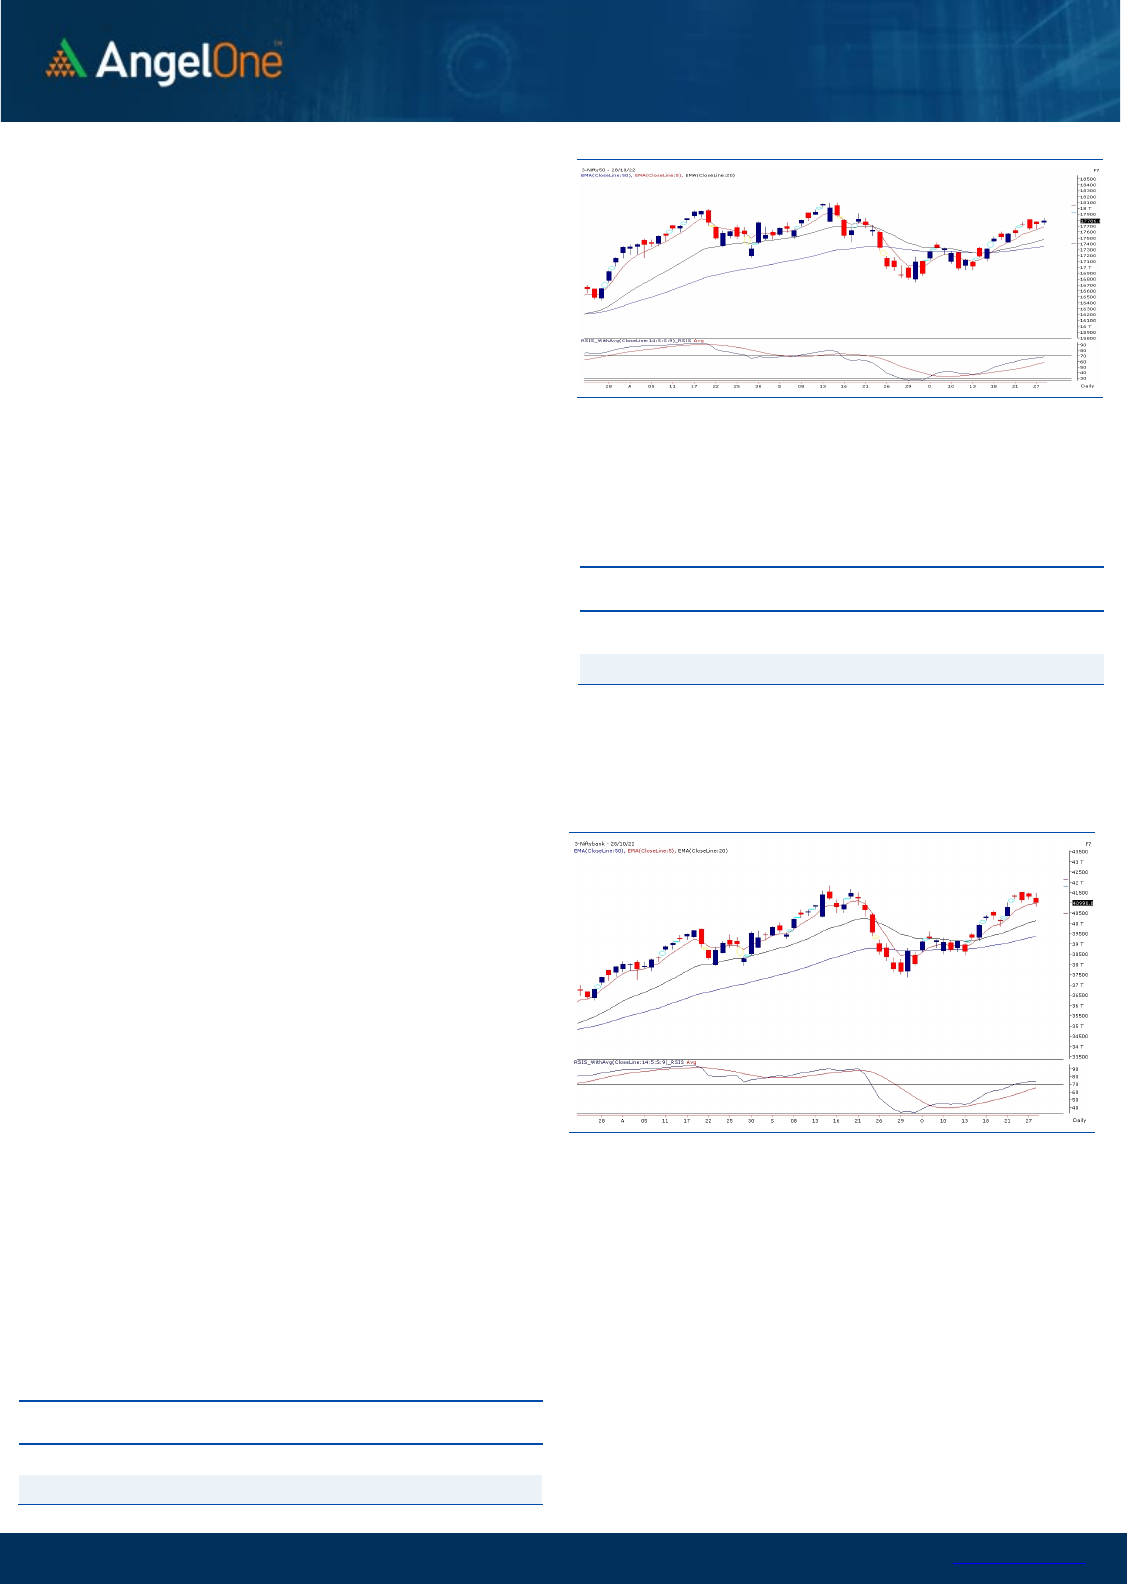
Sensex (59960) / Nifty (17787)
Generally, the Muhurat Trading Day is considered a lull session but
this time, we kicked off the new SAMVAT as well as the week with a
decent bump up on Monday. Importantly, unlike most of the
Muhurat sessions, the gains were here to stay as we managed to
hold the initial lead convincingly. This was followed by back to back
gap up openings but the follow up was clearly missing. Eventually,
the range bound week ended with more than a percent gains on a
weekly basis.
Although, despite being a truncated week, we managed to add
something on week-on-week basis; practically, the trading action
was very dull. Market failed to capitalise on all head-starts as we
saw some challenges around the 17800 mark. On the other hand,
the bulls were successfully able to defend 17600, which made the
weekly range to shrink to merely 200 points. In our sense, markets
have opted to take some breather before unfolding the next leg of
the rally. As far as supports are concerned, 17600 - 17500 are to be
treated as key levels and till the time, it remains unbroken, there is
no reason to worry for. On the flipside, it’s a matter of time, we
would see Nifty surpassing 17800 to retest the psychological
junction of 18000.
Traders are advised to remain upbeat and keep a close watch on
thematic moves which may get unfolded in the first half of this
week. The banking has taken a pause after the recent run but
soon it is likely to move beyond all time highs to enter an
uncharted territory.
Key Levels
Support 1 – 17600 Resistance 1 – 17940
Support 2 – 17500 Resistance 2 – 18000

www.angelone.in
Technical & Derivatives Report
OCT 31, 2022
View
The truncated festive week ended on a positive note,
the index reclaimed 17800 and maintained positive
posture despite some profit booking at higher levels.
FIIs were net buyers in the cash market segment to
the tune of Rs. 1569 crores. Simultaneously, in Index
futures, they sold worth Rs. 624 crores with a good
amount of rise in open interest, indicating addition of
shorts.
On Friday, we saw mixed activity in Nifty and short
formation was seen in banking index. Stronger hands
too added few shorts in index futures segment but
preferred buying equities. Their Long Short Ratio has
surged drastically from 13% to 57%, as they covered
decent portion of shorts and rolled over bullish bets
in the month of November. In index options front,
build-up was scattered between 17800-18000 call and
17500-17800 put strikes. At current juncture, 17500-
17600 zone remains a strong demand zone and as long
we manage to sustain above same, traders’ are
advocated to use intraday dips to add fresh longs in
system.
Comments
The Nifty futures open interest has increased by
4.37%. and Bank Nifty futures open interest has
increased by 7.93% as the market closed at 17786.80.
The Nifty November future closed with a premium of
43.40 point against a premium of 52.25 point in the
last trading session. The December series closed at
a premium of 106.30 point.
The INDIA VIX decreased from 16.59 to 15.92. At the
same time, the PCR-OI of Nifty has increased from
1.10 to 1.12.
Few of the liquid counters where we have seen high
cost of carry are IDEA, PETRONET, INDUSTOWER,
FSL and IOC.
Historical Volatility
SCRIP HV
SBICARD 39.46
MARUTI 35.68
BALRAMCHIN 56.52
TATACHEM 46.91
PETRONET 30.96
Nifty Vs OI
16400
16600
16800
17000
17200
17400
17600
17800
18000
,0
2,000
4,000
6,000
8,000
10,000
12,000
14,000
16,000
18,000
10/10 10/12 10/14 10/18 10/20 10/25 10/28
Openinterest Nifty
OI Gainers
SCRIP OI
OI
CHG. (%)
PRICE
PRICE
CHG. (%)
HONAUT 30780 62.99 39543.95 2.90
NMDC 18783650 32.37 100.95 -3.66
CROMPTON 5485500 16.58 353.50 -3.81
BALRAMCHIN 9337600 14.84 310.05 -6.74
MARUTI 3199100 12.66 9492.65 4.84
SYNGENE 2364000 12.09 613.15 3.05
SBICARD 6824000 12.09 810.30 -5.61
PAGEIND 99705 12.02 49225.20 -3.56
OI Losers
SCRIP OI
OI
CHG. (%)
PRICE
PRICE
CHG. (%)
TVSMOTOR 5101600 -6.95 1127.15 -0.12
MFSL 2393300 -5.35 701.70 3.22
RECLTD 43000000 -5.17 99.85 3.29
JINDALSTEL 25863750 -5.07 453.90 -3.52
MGL 3149600 -5.02 855.95 -1.47
BAJAJ-AUTO 1504000 -3.97 3670.55 1.51
SHREECEM 282950 -3.84 21779.60 0.63
IGL 10495375 -3.70 422.50 -0.88
Put-Call Ratio
SCRIP PCR (OI) PCR (VOL)
NIFTY 1.12 0.89
BANKNIFTY 0.71 0.93
RELIANCE 0.58 0.40
ICICIBANK 0.50 0.60
INFY 0.63 0.60
www.angelone.in
Technical & Derivatives Report
OCT 31, 2022
Note: Above mentioned Bullish or Bearish Spreads in Nifty (Nov Series) are given as an information and not as a recommendation.
Nifty Spot =
17
786.80
FII Statistics for
October
2
8
, 2022
Detail Buy
Contracts
Open
Interest
Value
(in Cr.)
Sell
Net
CHANGE
INDEX
FUTURES
3112.28 3736.16 (623.88) 132238 12398.18 4.64
INDEX
OPTIONS
626579.01 622332.19 4246.82
1203127 111880.91 43.67
STOCK
FUTURES
11215.42 12006.24 (790.82) 2139682 142378.08 5.58
STOCK
OPTIONS
9048.49 8903.96 144.53
72029 5145.34 151.19
Total 649955.20
646978.55
2976.65
3547076
271802.51
17.49
Turnover on
October
2
8
, 2022
Instrument
No. of
Contracts
Turnover
( in Cr. )
Change
(%)
Index
Futures
341244 32757.78 -45.56
Index Options
76259339 40232.73 -11.56
Stock
Futures
817765 55903.69 -64.82
Stock Options
2642190 3898.11 27.39
Total
2,642,190 3898.11 -50.38
Bull-Call Spreads
Action Strike Price Risk Reward BEP
Buy
17800 300.80
53.65
46.35
17853.65
Sell
17900 247.15
Buy
17800 300.80
101.45
98.55
17901.45
Sell
18000 199.35
Buy
17900 247.15
47.80 52.20 17947.80
Sell 18000 199.35
Bear
-
Put Spreads
Action Strike Price Risk Reward BEP
Buy 17700 273.60
39.90
60.10
17660.10
Sell
17600 233.70
Buy 17700 273.60
76.60
123.40
17623.40
Sell 17500 197.00
Buy
17600 233.70
36.70 63.30 17563.30
Sell 17500 197.00
Nifty Put
-
Call Analysis
,0
500,000
1000,000
1500,000
2000,000
2500,000
17200 17300 17400 17500 17600 17700 17800 17900 18000 18100 18200 18300 18400 18500
Call Put

www.angelone.in
Technical & Derivatives Report
OCT 31, 2022
`
Daily Pivot Levels for Nifty Constituents
Scrips
S2
S1
PIVOT
R1 R2
ADANIENT 3,246 3,285
3,336
3,375 3,427
ADANIPORTS
807
813
824
831
842
APOLLOHOSP 4,353 4,460
4,522 4,629
4,691
ASIANPAINT 3,023 3,038
3,055 3,070 3,087
AXISBANK
888
895
907
914
926
BAJAJ-AUTO 3,586 3,628
3,674 3,716
3,762
BAJFINANCE
6,916
6,961
7,026
7,071
7,136
BAJAJFINSV
1,624
1,639
1,650
1,664
1,675
BPCL
298
301
305
307
311
BHARTIARTL
804
811
818 824 831
BRITANNIA
3,707
3,742
3,767
3,802 3,827
CIPLA 1,139 1,147
1,159 1,168
1,180
COALINDIA 237 241
244
248
252
DIVISLAB 3,476 3,512
3,576
3,611
3,675
DRREDDY
4,391
4,426
4,464
4,498 4,537
EICHERMOT
3,663
3,704
3,739
3,780
3,815
GRASIM
1,632
1,658
1,698
1,724
1,764
HCLTECH 1,018 1,024
1,032
1,038
1,046
HDFCBANK
1,438
1,448
1,458
1,468
1,477
HDFCLIFE
523
527
532
535
540
HDFC
2,359
2,380
2,400
2,421
2,441
HEROMOTOCO
2,592
2,621
2,648
2,676
2,703
HINDALCO
393
399
406
412
418
HINDUNILVR 2,490 2,507
2,529
2,546 2,568
ICICIBANK
886
897
912
923
939
INDUSINDBK 1,125 1,136
1,149
1,160
1,172
INFY
1,495
1,504
1,516 1,525
1,537
ITC
343
344
347
348
350
JSW STEEL
656
663
671
678
686
KOTAKBANK
1,860
1,872
1,883
1,896
1,907
LT
1,953
1,964
1,975
1,986
1,997
M&M
1,280
1,296
1,306
1,322
1,332
MARUTI 8,866 9,179
9,365
9,678
9,863
NESTLEIND 19,913 20,098
20,235 20,420
20,557
NTPC 168 171
173
176
178
ONGC 130 132
134
136
138
POWERGRID
221
224
226
229
232
RELIANCE
2,431
2,479
2,507 2,554 2,582
SBILIFE
1,233
1,243
1,254
1,264
1,275
SBIN
558
564
573
580
589
SUNPHARMA
978
984
994
1,000
1,010
TCS
3,129
3,146
3,162
3,180
3,196
TATACONSUM
751
756
765
770
779
TATAMOTORS
404
407
409
412
414
TATASTEEL 99 100
102 104
106
TECHM
1,022
1,036
1,058
1,072
1,094
TITAN
2,677
2,707
2,723
2,752
2,769
ULTRACEMCO
6,377
6,412
6,441
6,475
6,504
UPL 699 706
711
719
724
WIPRO
380
382
384
385
388

www.angelone.in
Technical & Derivatives Report
OCT 31, 2022
*
Technical and Derivatives Team:
Sameet Chavan Chief Analyst – Technical & Derivatives sameet.chavan@angelone.in
Sneha Seth Senior Analyst – Technical & Derivatives sneha.seth@angelone.in
Rajesh Bhosale Technical Analyst rajesh.bhosle@angelone.in
Osho Krishan Senior Analyst – Technical & Derivatives osho.krishan@angelone.in
Research Team Tel: 022 – 39357600 Website: www.angelone.in
For Technical Queries E-mail: technicalresearch-cso@angelone.in
For Derivatives Queries E-mail: derivatives.desk@angelone.in
DISCLAIMER
Angel One Limited (hereinafter referred to as “Angel”) is a registered Member of National Stock Exchange of India Limited, Bombay
Stock Exchange Limited and Metropolitan Stock Exchange Limited. It is also registered as a Depository Participant with CDSL and
Portfolio Manager and investment advisor with SEBI. It also has registration with AMFI as a Mutual Fund Distributor. Angel One
Limited is a registered entity with SEBI for Research Analyst in terms of SEBI (Research Analyst) Regulations, 2014 vide registration
number INH000000164. Angel or its associates has not been debarred/ suspended by SEBI or any other regulatory authority for
accessing /dealing in securities Market.
This document is solely for the personal information of the recipient, and must not be singularly used as the basis of any investment
decision. Nothing in this document should be construed as investment or financial advice. Each recipient of this document should
make such investigations as they deem necessary to arrive at an independent evaluation of an investment in the securities of the
companies referred to in this document (including the merits and risks involved), and should consult their own advisors to determine
the merits and risks of such an investment.
Angel or its associates or research analyst or his relative may have actual/beneficial ownership of 1% or more in the securities of
the subject company at the end of the month immediately preceding the date of publication of the research report. Neither Angel or
its associates nor Research Analysts or his relative has any material conflict of interest at the time of publication of research report.
Angel or its associates might have received any compensation from the companies mentioned in the report during the period
preceding twelve months from the date of this report for services in respect of managing or co-managing public offerings, corporate
finance, investment banking or merchant banking, brokerage services or other advisory service in a merger or specific transaction
in the normal course of business. Angel or its associates did not receive any compensation or other benefits from the companies
mentioned in the report or third party in connection with the research report. Neither Angel nor its research analyst entity has been
engaged in market making activity for the subject company.
Reports based on technical and derivative analysis center on studying charts of a stock's price movement, outstanding positions and
trading volume, as opposed to focusing on a company's fundamentals and, as such, may not match with a report on a company's
fundamentals. Investors are advised to refer the Fundamental and Technical Research Reports available on our website to evaluate
the contrary view, if any.
The information in this document has been printed on the basis of publicly available information, internal data and other reliable
sources believed to be true, but we do not represent that it is accurate or complete and it should not be relied on as such, as this
document is for general guidance only. Angel One Limited or any of its affiliates/ group companies shall not be in any way responsible
for any loss or damage that may arise to any person from any inadvertent error in the information contained in this report. Angel One
Limited has not independently verified all the information contained within this document. Accordingly, we cannot testify, nor make
any representation or warranty, express or implied, to the accuracy, contents or data contained within this document. While Angel
One Limited endeavors to update on a reasonable basis the information discussed in this material, there may be regulatory,
compliance, or other reasons that prevent us from doing so.
This document is being supplied to you solely for your information, and its contents, information or data may not be reproduced,
redistributed or passed on, directly or indirectly.
Neither Angel One Limited, nor its directors, employees or affiliates shall be liable for any loss or damage that may arise from or in
connection with the use of this information. Angel or its associates or Research Analyst or his relative might have financial interest
in the subject company. Research analyst has not served as an officer, director or employee of the subject company.
