December 30, 2021
www.angelone.in
Technical & Derivatives Report
Nifty Bank Outlook - (35045)
NIFTY BANK has seen a lackluster day of trade, as it is being
ranged bound from the past two consecutive sessions and
finding difficulties to surge above the long-awaited resistance
zone of its 200 DEMA. However, the index managed to sustain
above the 35000 mark but has lost traction from the market
participants.
On the technical chart, the index is placed at the supporting
trend-line of the previous swing lows, and any breach below the
same could further drag the index towards the 34000 mark. On
the oscillator front, MACD is hovering in a negative trajectory
suggesting inherent weakness. The trend is expected to persist
until a decisive close above the long-term exponential moving
average occurs. At the current juncture, 35500-35700 hold the
crucial resistance zone, while on the flip side, 34000 is expected
to act as an immediate support zone.
Key Levels
Support 1 – 34500 Resistance 1 – 35500
Support 2 – 34400 Resistance 2 – 35700
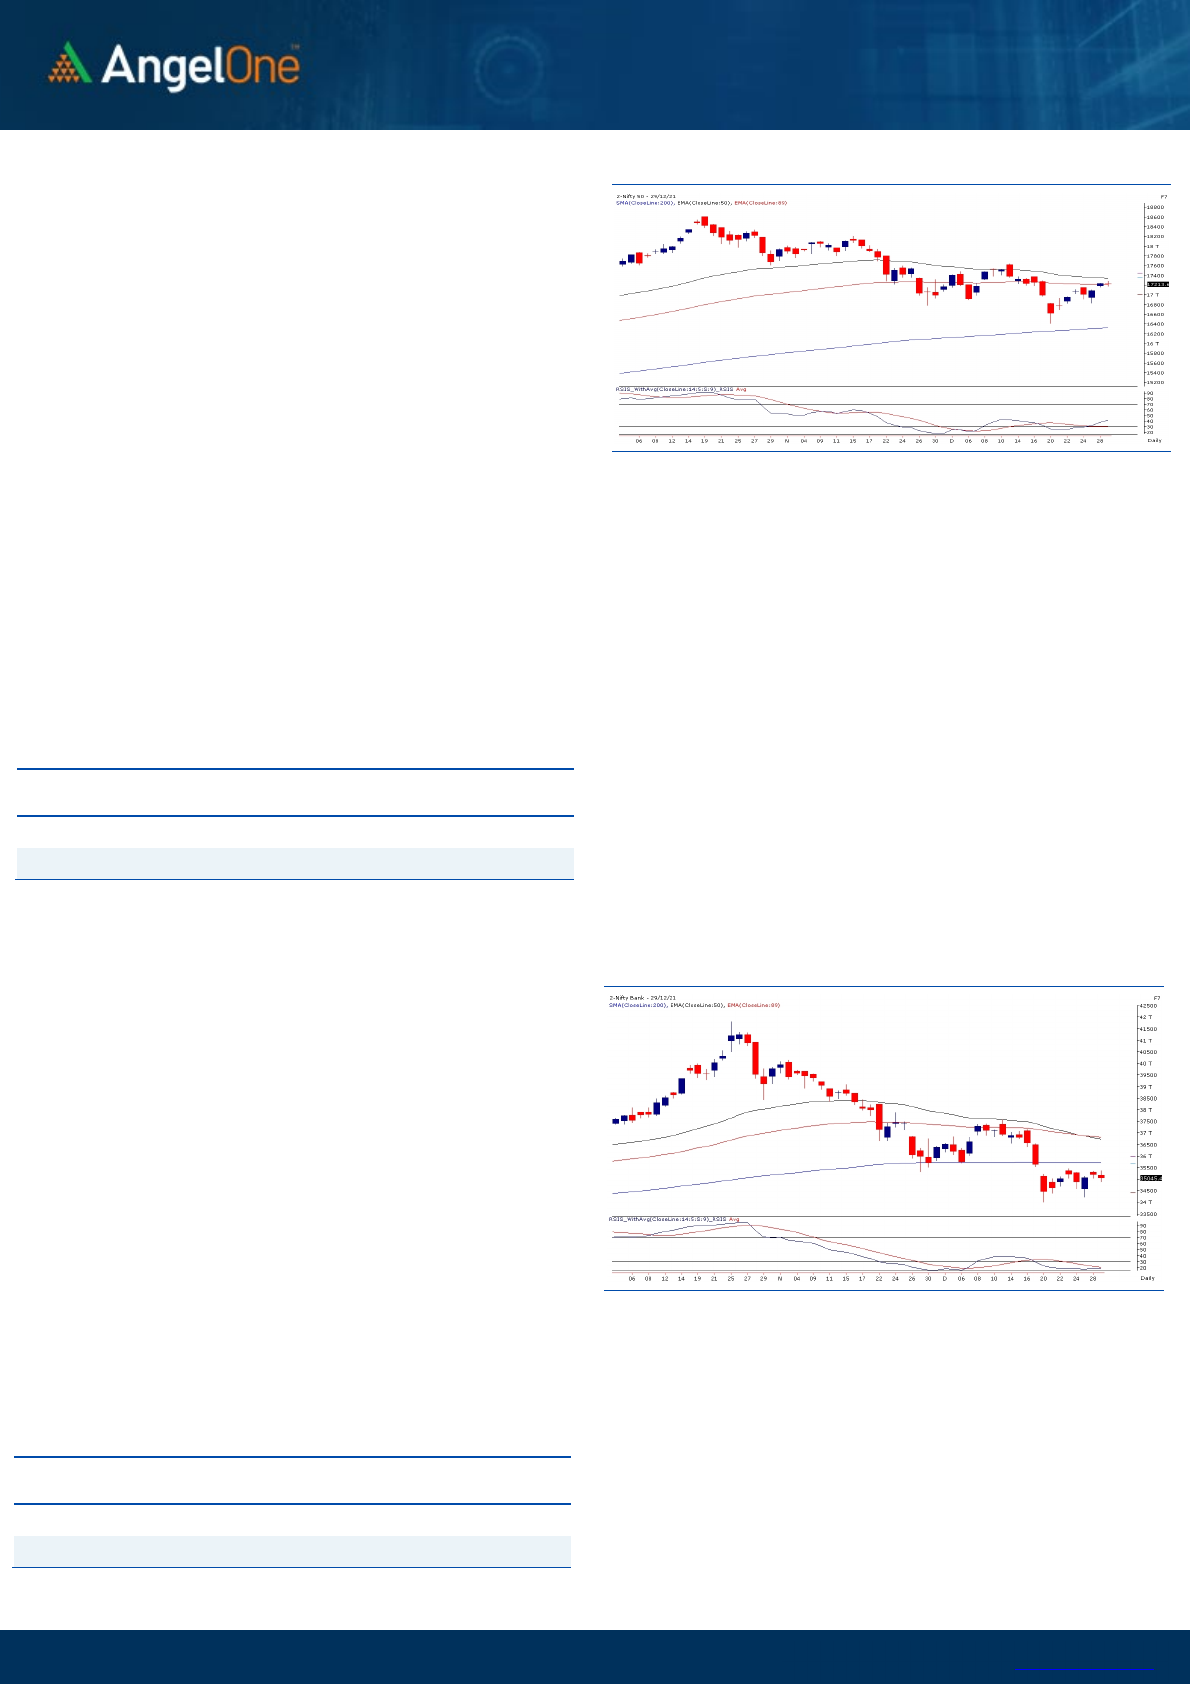
Exhibit 1: Nifty Daily Chart
Exhibit 2: Nifty Bank Daily Chart
Sensex (57806) / Nifty (17214)
We had a muted start to yesterday’s session in the absence of
any major trigger on the global as well as domestic front. In the
initial hour, we did move towards 17300 but this attempt
eventually failed as we witnessed some profit booking at higher
levels. Although, market saw a small dip towards the end, the
Nifty managed to defend the 17200 mark on a closing basis.
Now, as we are approaching the monthly expiry and the year-
end too, we are not seeing any major action in key indices. Since
we have entered a strong resistance zone of 17200 – 17300, there
is no sufficient force available to go beyond it. On the flipside, key
supports are being tested but are defended too successfully. We
expect similar sort of action in the coming session as well and
despite being a monthly expiry, the volatility is likely to remain
on the lower side. As far as supports are concerned, 17160 – 17100
are to be considered as immediate support and resistance
remains at 17300. We advise traders to continue with a stock
specific approach as we are seeing good traction in individual
pockets.
Key Levels
Support 1 – 17100 Resistance 1 – 17300
Support 2 – 17000 Resistance 2 – 17400
www.angelone.in
Technical & Derivatives Report
December 30, 2021
View
One day ahead of the monthly expiry, we had a muted
start and almost throughout the day, it remained as it
as. We did made an early attempt towards 17300
which got sold into but at the same time, the bias
wasn’t bearish also; because we did manage to
defend 17200 with an ease. Overall it was a day of
consolidation for key indices as we are approaching
the year end now.
FIIs were net sellers in the cash market segment to
the tune of Rs. 975 crores. In index futures, they sold
worth Rs. 162 crores with rise in open interest
indicating short positions created in yesterday’s
session.
In F&O space, we observed some buying interest in
both indices after a quite some time which is indeed
an encouraging sign. FIIs too preferred covering few
of their shorts and added fresh longs. The call writers
of 17300-17500 strikes seems to have piled up their
positions and on the other side, 17100-17200 puts
added some fresh positions. Highest open interest
concentration is now placed at 17000 put and 17500
call options. Considering the derivatives activity, till
the time we are holding onto the support zone of
17100-17150, we would advocate using declines to add
fresh longs. For the expiry session, one can look to
buy ATM call towards the mentioned zone but at the
same time, one should take some money off that table
if we reaches the higher end of the range.
Comments
The Nifty futures open interest has decreased by 0.96%.
and BANK Nifty futures open interest has increased by
2.56 % as market closed at 17213.60 levels.
The Nifty December future closed with a premium of 2.3
point against a premium of 13.5 point in last trading
session. The January series closed at a premium of
49.75 point.
The INDIA VIX decreased from 16.47 to 16.24. At the
same time, the PCR-OI of Nifty has decreased from 1.34
to 1.19
Few of the liquid counters where we have seen high
cost of carry are ADANIENT, IBULHSGFIN, FSL,
INDIAMART, AND TRENT
Historical Volatility
SCRIP HV
JKCEMENT
42.89
BAJAJ-AUTO
31.47
EICHERMOT
38.43
SUNPHARMA
34.66
LAURUSLABS
51.10
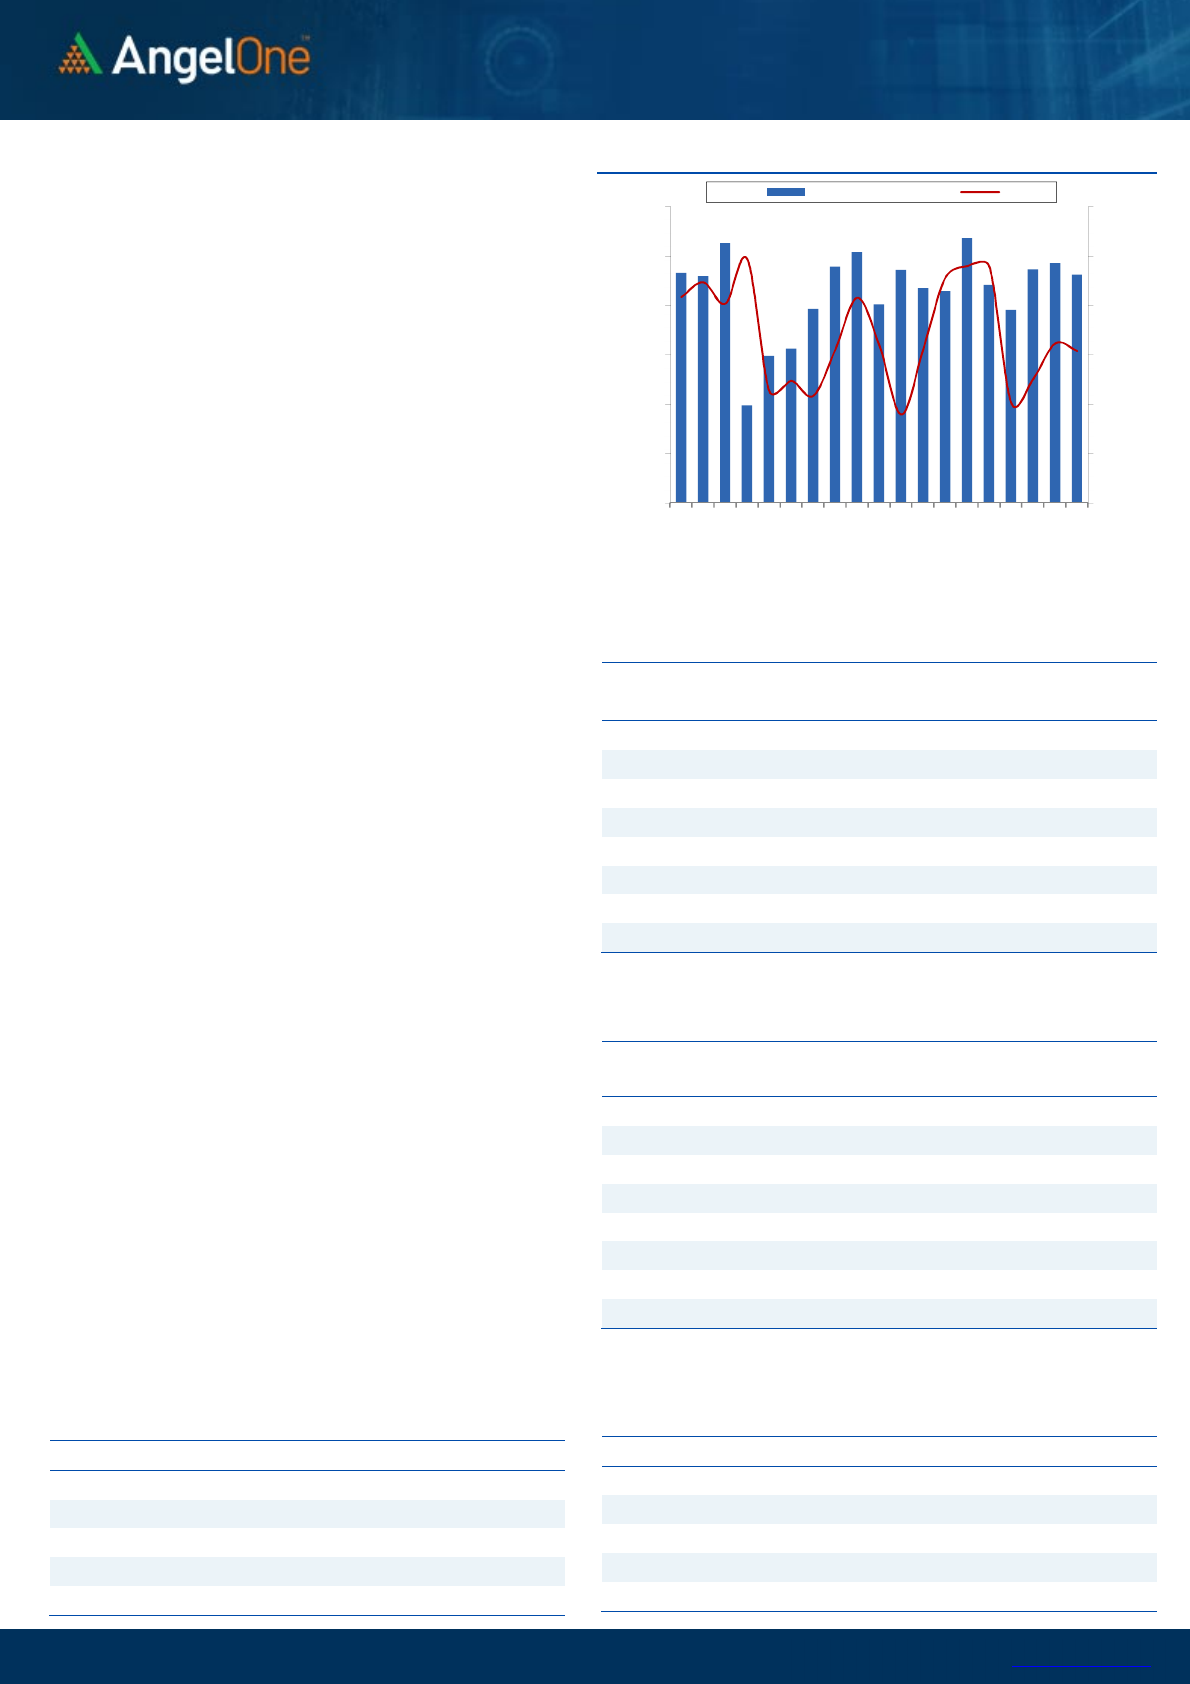
Nifty Vs OI
16600
16800
17000
17200
17400
17600
17800
10,000
10,500
11,000
11,500
12,000
12,500
13,000
11-22 11-2411-2611-30 12-2 12-6 12-8 12-1012-2712-29
(`000)
Openinterest
OI Gainers
SCRIP OI
OI
CHG. (%)
PRICE
PRICE
CHG. (%)
JKCEMENT
420350 43.66 3202.20 -5.38
POWERGRID
36275066 27.19 204.60 -0.17
ASTRAL
581625 16.27 2276.05 1.68
EICHERMOT
3363150 7.45 2562.25 3.12
ATUL
49875 6.06 8898.70 0.72
L&TFH
74470780 4.12 77.95 -0.45
BANKBARODA
153960300 4.08 80.95 0.06
PEL
3295325 3.99 2615.65 0.52
OI Losers
SCRIP OI
OI
CHG. (%)
PRICE
PRICE
CHG. (%)
SYNGENE
1036150 -13.97 606.10 1.56
MRF
64760 -13.75 72559.35 1.26
GSPL
1018300 -12.30 294.30 -0.73
CUMMINSIND
1413000 -9.25 938.90 -0.08
DIXON
431250 -9.19 5555.05 -0.67
AARTIIND
2115650 -8.73 994.15 0.42
IPCALAB
2511225 -8.12 2119.85 1.50
COFORGE
728000 -7.96 5649.10 -0.26
Put-Call Ratio
SCRIP PCR-OI PCR-VOL
NIFTY
1.19 1.01
BANKNIFTY
0.72 0.97
RELIANCE
0.57 0.49
ICICIBANK
0.56 0.44
INFY
0.97 0.81

www.angelone.in
Technical & Derivatives Report
December 30, 2021
Note: Above mentioned Bullish or Bearish Spreads in Nifty (December Series) are given as an information and not as a recommendation.
Nifty Spot = 17213.60
FII Statistics for December 29, 2021
Detail Buy
Net Contracts
Open Interest
Sell
Value
(in Cr.)
Change
(%)
INDEX
FUTURES
5570.47 5732.12 (161.65) 175520 15215.31 9.75
INDEX
OPTIONS
478975.67 474342.27 4633.40
1977629 171112.25 8.01
STOCK
FUTURES
27846.91 28111.36 (264.45) 1713995 120666.36 (0.35)
STOCK
OPTIONS
14513.98 14330.54 183.44
317373 22616.24 0.15
Total
526907.03
522516.29
4390.74
4184517
329610.16
3.89
Turnover on December 29, 2021
Instrument
No. of
Contracts
Turnover
( in Cr. )
Change
(%)
Index Futures
374904 32638.15 9.96
Index Options
67763574 5914432.65
20.75
Stock Futures
1748974 124925.74
-9.18
Stock Options
2272798 169104.03
-22.18
Total
7,21,60,250 6241100.57
18.15
Bull-Call Spreads
Action Strike Price Risk Reward BEP
Buy
17200 69.70
46.00 54.00 17246.00
Sell
17300 23.70
Buy
17200 69.70
63.90 136.10 17263.90
Sell
17400 5.80
Buy
17300 23.70
17.90 82.10 17317.90
Sell
17400 5.80
Bear-Put Spreads
Action Strike Price Risk Reward BEP
Buy
17200 100.05
50.95 49.05 17149.05
Sell
17100 49.10
Buy
17200 100.05
79.55 120.45 17120.45
Sell
17000 20.50
Buy
17100 49.10
28.60 71.40 17071.40
Sell
17000 20.50
Nifty Put-Call Analysis
,0
2000,000
4000,000
6000,000
8000,000
10000,000
12000,000
16700 16800 16900 17000 17100 17200 17300 17400 17500 17600 17700 17800 17900 18000
Call Put

www.angelone.in
Technical & Derivatives Report
December 30, 2021
`
Daily Pivot Levels for Nifty Constituents
Scrips S2 S1 PIVOT R1 R2
ADANIPORTS 712 717
726 731 740
ASIANPAINT 3,327 3,347
3,367 3,387 3,406
AXISBANK 660 665
672 678 685
BAJAJ-AUTO 3,111 3,187
3,228 3,304 3,345
BAJFINANCE 6,808 6,860
6,905 6,957 7,002
BAJAJFINSV 15,818 16,033
16,182 16,397 16,546
BPCL 375 378
380 384 386
BHARTIARTL 670 673
678 682 687
BRITANNIA 3,507 3,533
3,552 3,578 3,596
CIPLA 924 930
939 944 953
COALINDIA 144 146
147 149 150
DIVISLAB 4,480 4,551
4,588 4,659 4,697
DRREDDY 4,704 4,769
4,808 4,873 4,913
EICHERMOT 2,433 2,498
2,535 2,599 2,636
GRASIM 1,573 1,589
1,614 1,630 1,655
HCLTECH 1,267 1,280
1,289 1,302 1,311
HDFCBANK 1,440 1,447
1,454 1,461 1,468
HDFCLIFE 636 640
644 648 651
HDFC 2,535 2,549
2,565 2,579 2,595
HEROMOTOCO 2,396 2,415
2,429 2,447 2,461
HINDALCO 447 451
454 458 461
HINDUNILVR 2,286 2,297
2,309 2,319 2,332
ICICIBANK 724 730
738 743 751
IOC 110 111
112 112 113
INDUSINDBK 845 858
866 879 887
INFY 1,868 1,877
1,885 1,894 1,903
ITC 214 215
218 219 222
JSW STEEL 640 648
653 660 665
KOTAKBANK 1,740 1,752
1,766 1,778 1,792
LT 1,879 1,887
1,898 1,906 1,917
M&M 823 828
836 840 848
MARUTI 7,194 7,272
7,319 7,397 7,443
NESTLEIND 19,168 19,284
19,367 19,483 19,567
NTPC 121 122
123 125 126
ONGC 136 137
139 141 142
POWERGRID 201 203
204 206 208
RELIANCE 2,364 2,383
2,401 2,420 2,438
SBILIFE 1,156 1,171
1,182 1,196 1,207
SHREECEM 26,322 26,469
26,607 26,754 26,892
SBIN 445 450
456 461 467
SUNPHARMA 806 822
833 849 860
TCS 3,665 3,680
3,700 3,715 3,735
TATACONSUM
716 721
725 730 734
TATAMOTORS 470 473
477 480 485
TATASTEEL 1,098 1,107
1,117 1,126 1,136
TECHM 1,759 1,773
1,797 1,811 1,835
TITAN 2,350 2,376
2,396 2,422 2,442
ULTRACEMCO 7,332 7,376
7,418 7,463 7,505
UPL 747 753
760 766 773
WIPRO 695 699
705 709 715

www.angelone.in
Technical & Derivatives Report
December 30, 2021
*
Research Team Tel: 022 – 39357600 (Extn. 6844) Website: www.angelone.in
For Technical Queries E-mail: technicalresearch-cso@angelbroking.com
For Derivatives Queries E-mail: derivatives.desk@angelbroking.com
DISCLAIMER
Angel Broking Limited (hereinafter referred to as “Angel”) is a registered Member of National Stock Exchange of India Limited,
Bombay Stock Exchange Limited and Metropolitan Stock Exchange Limited. It is also registered as a Depository Participant with CDSL
and Portfolio Manager and investment advisor with SEBI. It also has registration with AMFI as a Mutual Fund Distributor. Angel
Broking Limited is a registered entity with SEBI for Research Analyst in terms of SEBI (Research Analyst) Regulations, 2014 vide
registration number INH000000164. Angel or its associates has not been debarred/ suspended by SEBI or any other regulatory
authority for accessing /dealing in securities Market.
This document is solely for the personal information of the recipient, and must not be singularly used as the basis of any investment
decision. Nothing in this document should be construed as investment or financial advice. Each recipient of this document should
make such investigations as they deem necessary to arrive at an independent evaluation of an investment in the securities of the
companies referred to in this document (including the merits and risks involved), and should consult their own advisors to determine
the merits and risks of such an investment.
Angel or its associates or research analyst or his relative may have actual/beneficial ownership of 1% or more in the securities of
the subject company at the end of the month immediately preceding the date of publication of the research report. Neither Angel or
its associates nor Research Analysts or his relative has any material conflict of interest at the time of publication of research report.
Angel or its associates might have received any compensation from the companies mentioned in the report during the period
preceding twelve months from the date of this report for services in respect of managing or co-managing public offerings, corporate
finance, investment banking or merchant banking, brokerage services or other advisory service in a merger or specific transaction
in the normal course of business. Angel or its associates did not receive any compensation or other benefits from the companies
mentioned in the report or third party in connection with the research report. Neither Angel nor its research analyst entity has been
engaged in market making activity for the subject company.
Reports based on technical and derivative analysis center on studying charts of a stock's price movement, outstanding positions and
trading volume, as opposed to focusing on a company's fundamentals and, as such, may not match with a report on a company's
fundamentals. Investors are advised to refer the Fundamental and Technical Research Reports available on our website to evaluate
the contrary view, if any.
The information in this document has been printed on the basis of publicly available information, internal data and other reliable
sources believed to be true, but we do not represent that it is accurate or complete and it should not be relied on as such, as this
document is for general guidance only. Angel Broking Limited or any of its affiliates/ group companies shall not be in any way
responsible for any loss or damage that may arise to any person from any inadvertent error in the information contained in this
report. Angel Broking Limited has not independently verified all the information contained within this document. Accordingly, we
cannot testify, nor make any representation or warranty, express or implied, to the accuracy, contents or data contained within this
document. While Angel Broking Limited endeavors to update on a reasonable basis the information discussed in this material, there
may be regulatory, compliance, or other reasons that prevent us from doing so.
This document is being supplied to you solely for your information, and its contents, information or data may not be reproduced,
redistributed or passed on, directly or indirectly.
Neither Angel Broking Limited, nor its directors, employees or affiliates shall be liable for any loss or damage that may arise from
or in connection with the use of this information. Angel or its associates or Research Analyst or his relative might have financial
interest in the subject company. Research analyst has not served as an officer, director or employee of the subject company.
Technical and Derivatives Team:
Sameet Chavan Chief Analyst – Technical & Derivatives sameet.chavan@angelone.in
Sneha Seth Derivatives Analyst sneha.seth@angelone.in
Osho Krishan Senior Analyst – Technical & Derivatives osho.krishan@angelbroking.com
