October
30
, 2023
www.angelone.in
Technical & Derivatives Report
8
Nifty Bank Outlook (
4
2
782
)
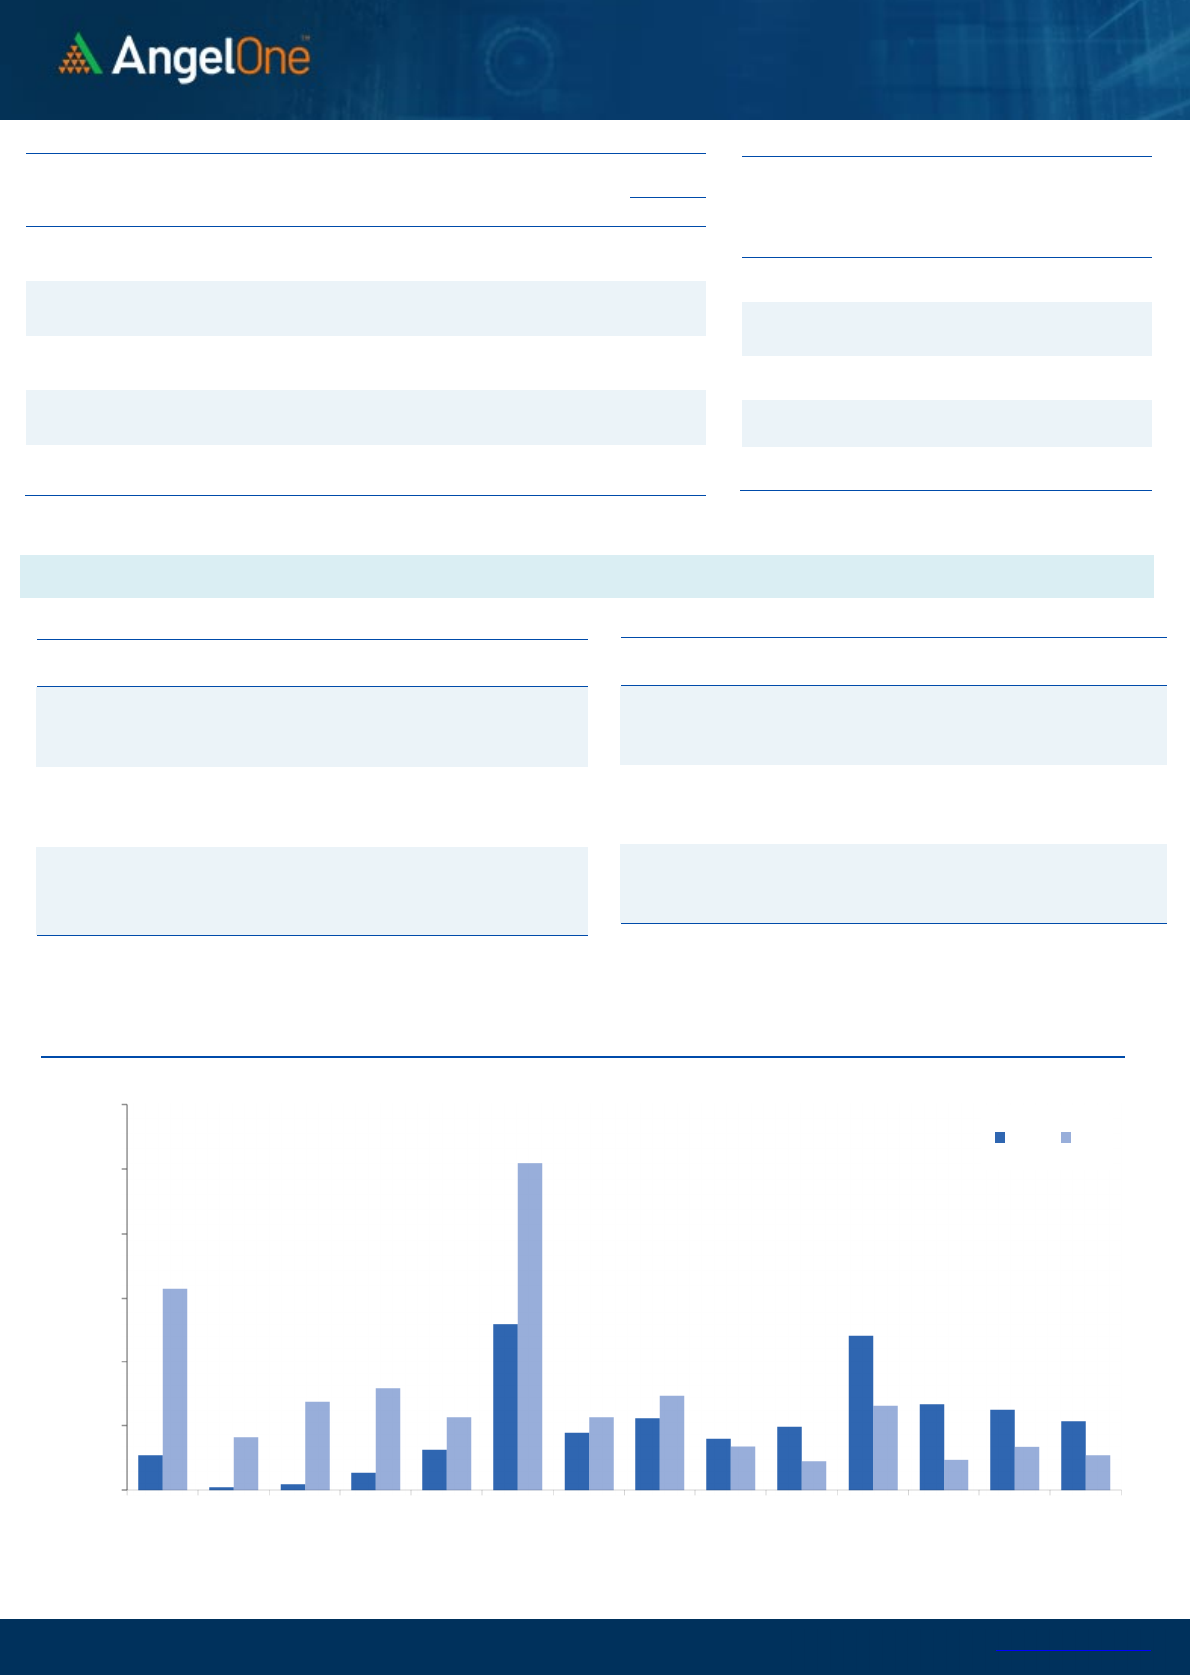
It was a dreadful start for the BANKNIFTY in tandem with our
benchmark on Monday. The selling intensified as the week progressed
and in the process, the banking index went on to not only thrash the
43000 mark, but also hastened towards the next key support of 42000.
Fortunately, globally things cooled off a bit on Friday which resulted in
a smart recovery in this beaten down space. Despite recouping more
than 500 points on the last day of the week, the index concluded
with more than a couple of a percent cut on a weekly basis.
Last week, we had clearly advocated caution and expected a notable
correction in the market. Banking being the weakest link, had to
contribute more to the move. On Thursday, the BANKNIFTY had
precisely reached its 100% 'Price Extension' of the down move from
46310.40 to 43796.75 and since it was deeply oversold, some respite
was evident. From hereon, the real litmus test would be once it
approaches the sturdy wall of 43100 - 43400. As of now, we are not
completely out of the woods and hence, traders should avoid being
carried away by such rebounds.
Key Levels
Support 1 – 42500 Resistance 1 – 43000
Support 2 – 42300 Resistance 2 – 43100
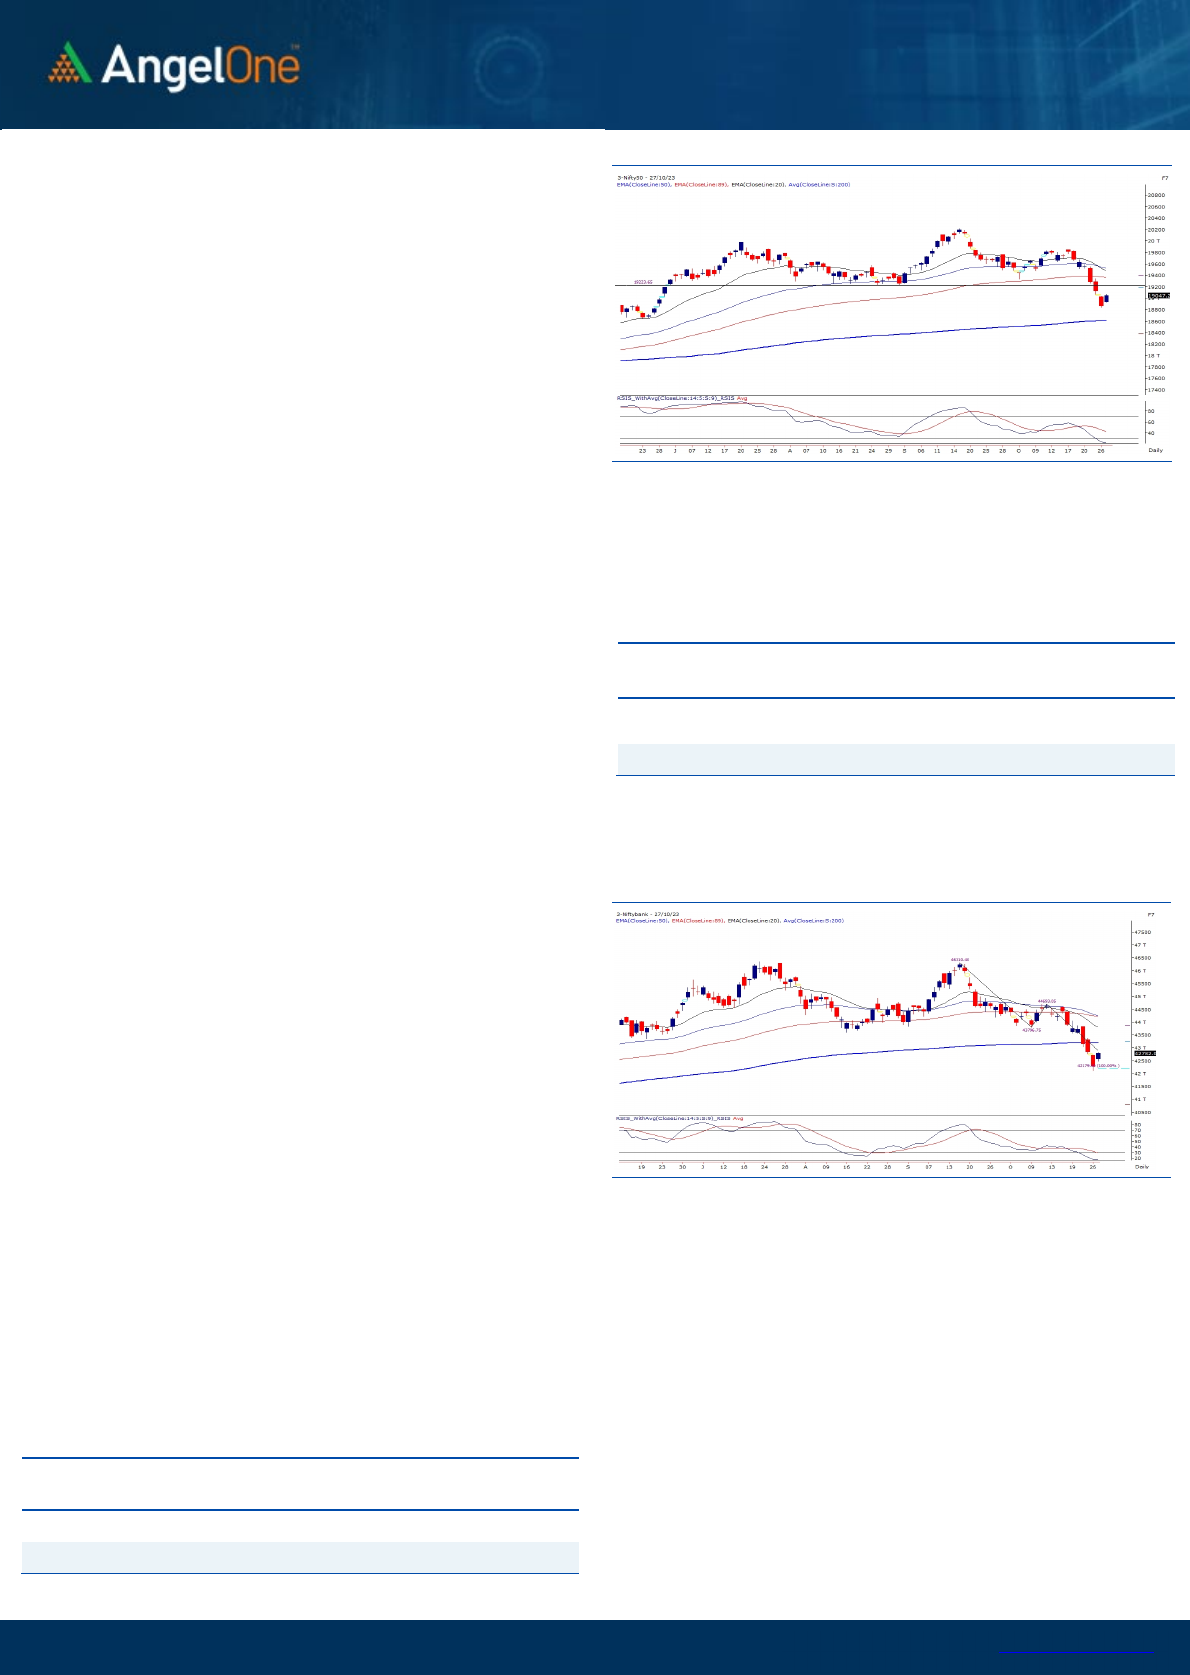
Exhibit 1: Nifty Daily Chart
Exhibit 2: Nifty Bank Daily Chart
Sensex (
6
3
783
) / Nifty (
1
9047
)
During the last week, our markets were under tremendous pressure as
the October series concluded on a disappointing note around the
18850 mark. However, there was a notable shift on Friday as prices
opened with a gap up and maintained a positive trend throughout the
session, ultimately closing above 19000. Despite this Friday's rebound,
the week ended with a cut of around 2.5% against the previous week's
close.
The week was marked by a flurry of activity, primarily driven by bearish
sentiment. In the initial three sessions, prices fell by around 700 points,
accompanied by a widespread selling spree. While Friday's bounce may
seem encouraging, at present it appears to be the "Dead Cat Bounce,"
as the indicators were in deep oversold conditions and it seems the
challenges in the market are far from over. The recent vertical decline
over the past couple of weeks, starting from around 19800, presents a
formidable challenge for the bulls camp to make a comeback due to
substantial overhead resistance. In this context, the range of 19200 to
19250 is a formidable resistance zone, that is a breakdown level from a
major swing low. In addition, the RSI Smoothened indicator has dipped
into the oversold zone below 30 levels for the first time since March,
hence, in the near term dip towards last week’s low around 19850 -
19800 may continue to act as a cushion, while a critical support zone is
observed around 19600, represented by the long-term 200SMA moving
average.
When navigating these market conditions, it is crucial to focus on
trading opportunities while keeping a close eye on key levels in both
directions. Additionally, staying vigilant regarding geopolitical
factors is essential, as they have the potential to exert a significant
influence on market trends.
Key Levels
Support 1 – 18900 Resistance 1 – 19200
Support 2 – 18800 Resistance 2 – 19250
Only a sustainable move beyond 44000 would confirm
the completion of a corrective phase. Until then one should
strictly follow one step at a time approach. As far as supports are
concerned, 42500 - 42300 - 42100 are to be considered as
immediate supports.

www.angelone.in
Technical & Derivatives Report
October
30
,
2023
View
The Indian Equity market toppled amidst the weak
global sentiments, wherein the benchmark index
Nifty50 plummeted towards the 19000 zone,
shedding nearly 2.50 percent on a weekly basis
FIIs were net sellers in the cash market segment to
the tune of Rs. 1500 cr. Simultaneously, they sold
worth Rs. 111 cr in Index futures with an increase in
open interest, indicating short addition.
On the derivatives front, new shorts have been
witnessed in the Nifty50 and long unwinding in the
banking index on a WoW basis. On the options front,
a decent piling of OI is seen at 19000-18900 put
strikes, suggesting primary support for the upcoming
week. While on the higher end, the 19200-call strike
holds the highest OI, indicating intermediate
resistance for Nifty. FIIs remained net sellers in
equities on a net basis and added bearish bets in
index futures segments, plummeting the Long Short
Ratio to 12% from 26% WoW. Considering the recent
data, our market seems extremely oversold and
hence, it is advisable to avoid undue risk and refrain
from getting carried away by in-between rallies.
Comments
The Nifty futures open interest has decreased by 0.65%
and Bank Nifty futures open interest has increased by
0.51% as the market closed at 19047.25.
The Nifty November future closed with a premium of
84.10 points against a premium of 115.35 points in the
last trading session. The December series closed at a
premium of 192.65 points.
The INDIA VIX has decreased from 11.73 to 10.91. At
the same time, the PCR-OI of Nifty has increased from
0.82 to 0.96.
A few of the liquid counters where we have seen high
cost of carry are SHRIRAMFIN, CANBK, DABUR, TRENT
and ALKEM.
Historical Volatility
SCRIP HV
IGL 38.39
MGL 37.13
HAVELLS 30.28
ITC 23.55
MPHASIS 37.52
Nifty Vs OI
18200
18400
18600
18800
19000
19200
19400
19600
19800
20000
20200
9,000
10,000
11,000
12,000
13,000
14,000
10-10 10-13 10-17 10-20 10-25 10-27
Openinterest Nifty
OI Gainers
SCRIP OI
OI
CHG. (%)
PRICE
PRICE
CHG. (%)
PERSISTENT 1466325 21.33 6083.80 4.08
MGL 2754400 15.50 988.35 -0.50
DELTACORP 11128400 14.90 131.10 2.56
INDIAMART 642300 14.74 2771.20 3.47
MCX 1942000 12.59 2243.30 0.15
TORNTPHARM 1865500 12.48 1920.65 1.64
COLPAL 3170300 11.48 2080.50 1.41
CIPLA 10696400 11.48 1174.25 2.24
OI Losers
SCRIP OI
OI
CHG. (%)
PRICE
PRICE
CHG. (%)
DIXON 17600 -24.05 5374.65 0.43
ABBOTINDIA 68680 -5.45 22669.30 1.83
CANFINHOME 3939975 -4.22 740.70 2.90
M&MFIN 33266000 -3.71 277.30 3.13
INFY 23326400 -3.22 1380.35 1.23
SBICARD 8528000 -3.21 790.45 2.36
AXISBANK 48149375 -3.11 1002.75 2.84
POWERGRID 46461600 -2.82 200.95 1.27
Put-Call Ratio
SCRIP PCR (OI) PCR (VOL)
NIFTY 0.96 0.79
BANKNIFTY 0.93 0.86
RELIANCE 0.80 0.43
ICICIBANK 0.67 0.45
INFY 0.51 0.44
www.angelone.in
Technical & Derivatives Report
October
30
,
2023
Note: Above mentioned Bullish or Bearish Spreads in Nifty (Nov Series) are given as an information and not as a recommendation.
Nifty Spot =
1
9047
.
25
FII Statistics for
October
2
7
, 2023
Detail Buy
Contracts
OI Value
(in Cr.)
Sell Net
CHANGE
INDEX
FUTURES
2943.51 3054.70 (111.19) 202636 16437.88 4.27
INDEX
OPTIONS
844177.87 846082.63 (1904.76) 3692083 297912.10 22.34
STOCK
FUTURES
13488.07 13114.85 373.22
2495988 170159.55 11.68
STOCK
OPTIONS
16154.31 15972.85 181.46
98171 6719.78 274.98
Total
876763.76
878225.03
(1461.27) 6488878
491229.31
18.56
Turnover on
October
2
7
, 2023
Instrument
No. of
Contracts
Turnover
(in Cr.)
Change
(%)
Index Futures
267441 21386.72
-63.45
Index Options
164737437
42524.25
-41.38
Stock Futures
911363 62787.36
-72.80
Stock Options
3617209 4525.95 3.30
Total
36,17,209 4525.95 -64.17
Bull-Call Spreads
Action Strike Price Risk Reward BEP
Buy
18900
394.40 69.20
30.80
18969.20
Sell
19000
325.20
Buy
18900 394.40 130.35
69.65
19030.35
Sell
19100 264.05
Buy
19000
325.20 61.15 38.85 19061.15
Sell
19100 264.05
Bear-Put Spreads
Action Strike Price Risk Reward BEP
Buy
19100 231.95
38.20
61.80
19061.80
Sell 19000 193.75
Buy 19100 231.95
71.45
128.55
19028.55
Sell
18900 160.50
Buy
19000 193.75
33.25 66.75 18966.75
Sell 18900 160.50
Nifty Put
-
Call Analysis
,0
1000,000
2000,000
3000,000
4000,000
5000,000
6000,000
18500 18600 18700 18800 18900 19000 19100 19200 19300 19400 19500 19600 19700 19800
Call Put

www.angelone.in
Technical & Derivatives Report
October
30
,
2023
`
Daily Pivot Levels for Nifty Constituents
Scrips S2 S1 PIVOT R1 R2
ADANIENT 2,187 2,224 2,250 2,287 2,313
ADANIPORTS 767 775 781 788 794
APOLLOHOSP 4,739 4,784 4,823 4,868 4,906
ASIANPAINT 2,910 2,933 2,954 2,976 2,997
AXISBANK 962 982 994 1,014 1,025
BAJAJ-AUTO 5,195 5,284 5,354 5,443 5,513
BAJFINANCE 7,359 7,433 7,491 7,565 7,623
BAJAJFINSV 1,528 1,547 1,570 1,589 1,612
BPCL 331 333 336 337 340
BHARTIARTL 901 908 913 920 925
BRITANNIA 4,463 4,489 4,516 4,542 4,569
CIPLA 1,125 1,150 1,174 1,198 1,222
COALINDIA 301 308 312 319 324
DIVISLAB 3,374 3,393 3,415 3,434 3,456
DRREDDY 5,298 5,348 5,401 5,451 5,504
EICHERMOT 3,294 3,344 3,377 3,428 3,460
GRASIM 1,839 1,847 1,859 1,867 1,879
HCLTECH 1,221 1,245 1,257 1,281 1,294
HDFCBANK 1,460 1,465 1,471 1,476 1,482
HDFCLIFE 601 605 610 614 620
HEROMOTOCO 3,074 3,093 3,123 3,142 3,172
HINDALCO 448 452 458 462 468
HINDUNILVR 2,449 2,466 2,480 2,497 2,511
ICICIBANK 907 910 914 917 921
INDUSINDBK 1,401 1,421 1,433 1,453 1,465
INFY 1,355 1,368 1,376 1,389 1,398
ITC 430 432 434 436 439
JSW STEEL 721 726 731 737 741
KOTAKBANK 1,681 1,692 1,700 1,711 1,719
LT 2,837 2,870 2,890 2,922 2,943
LTIMINDTREE 5,127 5,149 5,182 5,204 5,237
M&M 1,491 1,501 1,517 1,527 1,544
MARUTI 10,210 10,385 10,615 10,790 11,020
NESTLEIND 23,121 23,589 23,908 24,377 24,696
NTPC 229 233 236 239 242
ONGC 178 181 184 187 189
POWERGRID 198 199 201 202 203
RELIANCE 2,221 2,243 2,258 2,281 2,296
SBILIFE 1,279 1,291 1,306 1,318 1,333
SBIN 545 553 558 566 570
SUNPHARMA 1,101 1,106 1,113 1,118 1,125
TCS 3,325 3,338 3,350 3,363 3,375
TATACONSUM
869 880 887 898 906
TATAMOTORS 622 632 638 647 653
TATASTEEL 118 119 120 121 123
TECHM 1,108 1,114 1,120 1,126 1,132
TITAN 3,064 3,092 3,116 3,144 3,167
ULTRACEMCO 8,130 8,170 8,220 8,260 8,310
UPL 550 554 561 565 571
WIPRO 377 379 382 385 387

www.angelone.in
Technical & Derivatives Report
October
30
,
2023
Technical and Derivatives Team:
Sameet Chavan Head Research – Technical & Derivatives sameet.chavan@angelone.in
Sneha Seth Senior Analyst – Technical & Derivatives sneha.seth@angelone.in
Rajesh Bhosale Analyst - Technical rajesh.bhosle@angelone.in
Osho Krishan Senior Analyst – Technical & Derivatives osho.krishan@angelone.in
Hitesh Rathi Analyst – Technical & Derivatives hitesh.rathi@angelone.in
Research Team Tel: 022 – 39357600 Website: www.angelone.in
For Technical Queries E-mail: technicalresearch-cso@angelone.in
For Derivatives Queries E-mail: derivatives.desk@angelone.in
DISCLAIMER
We, Angel One Limited (hereinafter referred to as “Angel”) a company duly incorporated under the provisions of the Companies Act, 1956 with
its registered office at 601, 6th Floor, Ackruti Star, Central Road, MIDC, Andheri East, Mumbai – 400093, CIN: (L67120MH1996PLC101709) and
duly registered as a member of National Stock Exchange of India Limited, Bombay Stock Exchange Limited, Metropolitan Stock Exchange Limited,
Multi Commodity Exchange of India Ltd and National Commodity & Derivatives Exchange Ltd. Angel One limited is a company engaged in
diversified financial services business including securities broking, DP services, distribution of Mutual Fund products. It is also registered as a
Depository Participant with CDSL and Portfolio Manager and Investment Adviser with SEBI. It also has registration with AMFI as a Mutual Fund
Distributor. Angel One Limited is a registered entity with SEBI for Research Analyst in terms of SEBI (Research Analyst) Regulations, 2014 vide
registration number INH000000164 and also registered with PFRDA as PoP ,Registration No.19092018. Angel Group does not have any joint
ventures or associates. Angel One Limited is the ultimate parent company of the Group. Angel or its associates has not been debarred/ suspended
by SEBI or any other regulatory authority for accessing /dealing in securities Market.
AOL was merged with Angel Global Capital Private Limited and subsequently name of Angel Global Capital Private Limited was changed to Angel
Broking Private Limited (AOL) pursuant to scheme of Amalgamation sanctioned by the Hon'ble High Court of Judicature at Bombay by Orders
passed in Company Petition No 710 of 2011 and the approval granted by the Registrar of Companies. Further, name of Angel Broking Private
Limited again got changed to Angel Broking Limited (AOL) pursuant to fresh certificate of incorporation issued by Registrar of Companies (ROC)
dated June 28, 2018. Further name of Angel Broking name changed to Angel One Ltd pursuant to fresh certificate of incorporation issued by
Registrar of Companies (ROC) dated 23-09-21.
In case of any grievances please write to: support@angelone.in, Compliance Officer Details: Name : Hiren Thakkar, Tel No. –08657864228, Email
id - compliance@angelone.in
Registration granted by SEBI and certification from NISM in no way guarantee performance of the intermediary or provide any assurance of returns
to investors.
This document is solely for the personal information of the recipient, and must not be singularly used as the basis of any investment decision.
Nothing in this document should be construed as investment or financial advice. Each recipient of this document should make such investigations
as they deem necessary to arrive at an independent evaluation of an investment in the securities of the companies referred to in this document
(including the merits and risks involved), and should consult their own advisors to determine the merits and risks of such an investment.
Angel or its associates or research analyst or his relative may have actual/beneficial ownership of 1% or more in the securities of the subject
company at the end of the month immediately preceding the date of publication of the research report. Neither Angel or its associates nor
Research Analysts or his relative has any material conflict of interest at the time of publication of research report.
Angel or its associates might have received any compensation from the companies mentioned in the report during the period preceding twelve
months from the date of this report for services in respect of managing or co-managing public offerings, corporate finance, investment banking or
merchant banking, brokerage services or other advisory service in a merger or specific transaction in the normal course of business. Angel or its
associates did not receive any compensation or other benefits from the companies mentioned in the report or third party in connection with the
research report. Neither research entity nor research analyst has been engaged in market making activity for the subject company.

www.angelone.in
Technical & Derivatives Report
October
30
,
2023
*
Reports based on technical and derivative analysis center on studying charts of a stock's price movement, outstanding positions and trading
volume, as opposed to focusing on a company's fundamentals and, as such, may not match with a report on a company's fundamentals. Investors
are advised to refer the Fundamental and Technical Research Reports available on our website to evaluate the contrary view, if any.
The information in this document has been printed on the basis of publicly available information, internal data and other reliable sources believed
to be true, but we do not represent that it is accurate or complete and it should not be relied on as such, as this document is for general guidance
only. Angel One Limited or any of its affiliates/ group companies shall not be in any way responsible for any loss or damage that may arise to any
person from any inadvertent error in the information contained in this report. Angel One Limited does not warrant the accuracy, adequacy or
completeness of the service, information and materials and expressly disclaims liability for errors or omissions in the service, information and
materials. While Angel One Limited endeavours to update on a reasonable basis the information discussed in this material, there may be
regulatory, compliance, or other reasons that prevent us from doing so.
This document is being supplied to you solely for your information, and its contents, information or data may not be reproduced, redistributed or
passed on, directly or indirectly.
Neither Angel One Limited, nor its directors, employees or affiliates shall be liable for any loss or damage that may arise from or in connection
with the use of this information. Angel or its associates or Research Analyst or his relative might have financial interest in the subject company.
Research analyst has not served as an officer, director or employee of the subject company.
Investment in securities market are subject to market risks. Read all the related documents carefully before investing.
Any communication sent to clients on phone numbers or e-mail ids registered with the Trading Member is meant for client consumption and such
material should not be redistributed. Brokerage will not exceed SEBI prescribed limit. Any Information provided by us through any medium based
on our research or that of our affiliates or third parties or other external sources is subject to domestic and international market conditions and
we do not guarantee the availability or otherwise of any securities or other instruments and such Information is merely an estimation of certain
investments, and we have not and shall not be deemed to have assumed any responsibility for any such Information. You should seek independent
professional advice and/or tax advice regarding the suitability of any investment decision whether based on any Information provided by us
through the Site from inhouse research or third party reports or otherwise.
The report and information contained herein is strictly confidential and meant solely for the selected recipient and may not be altered in any way,
transmitted to, copied or distributed, in part or in whole, to any other person or to the media or reproduced in any form, without prior written
consent.
