NOV 29, 2022
www.angelone.in
Technical & Derivatives Report
xOOOOOOOO
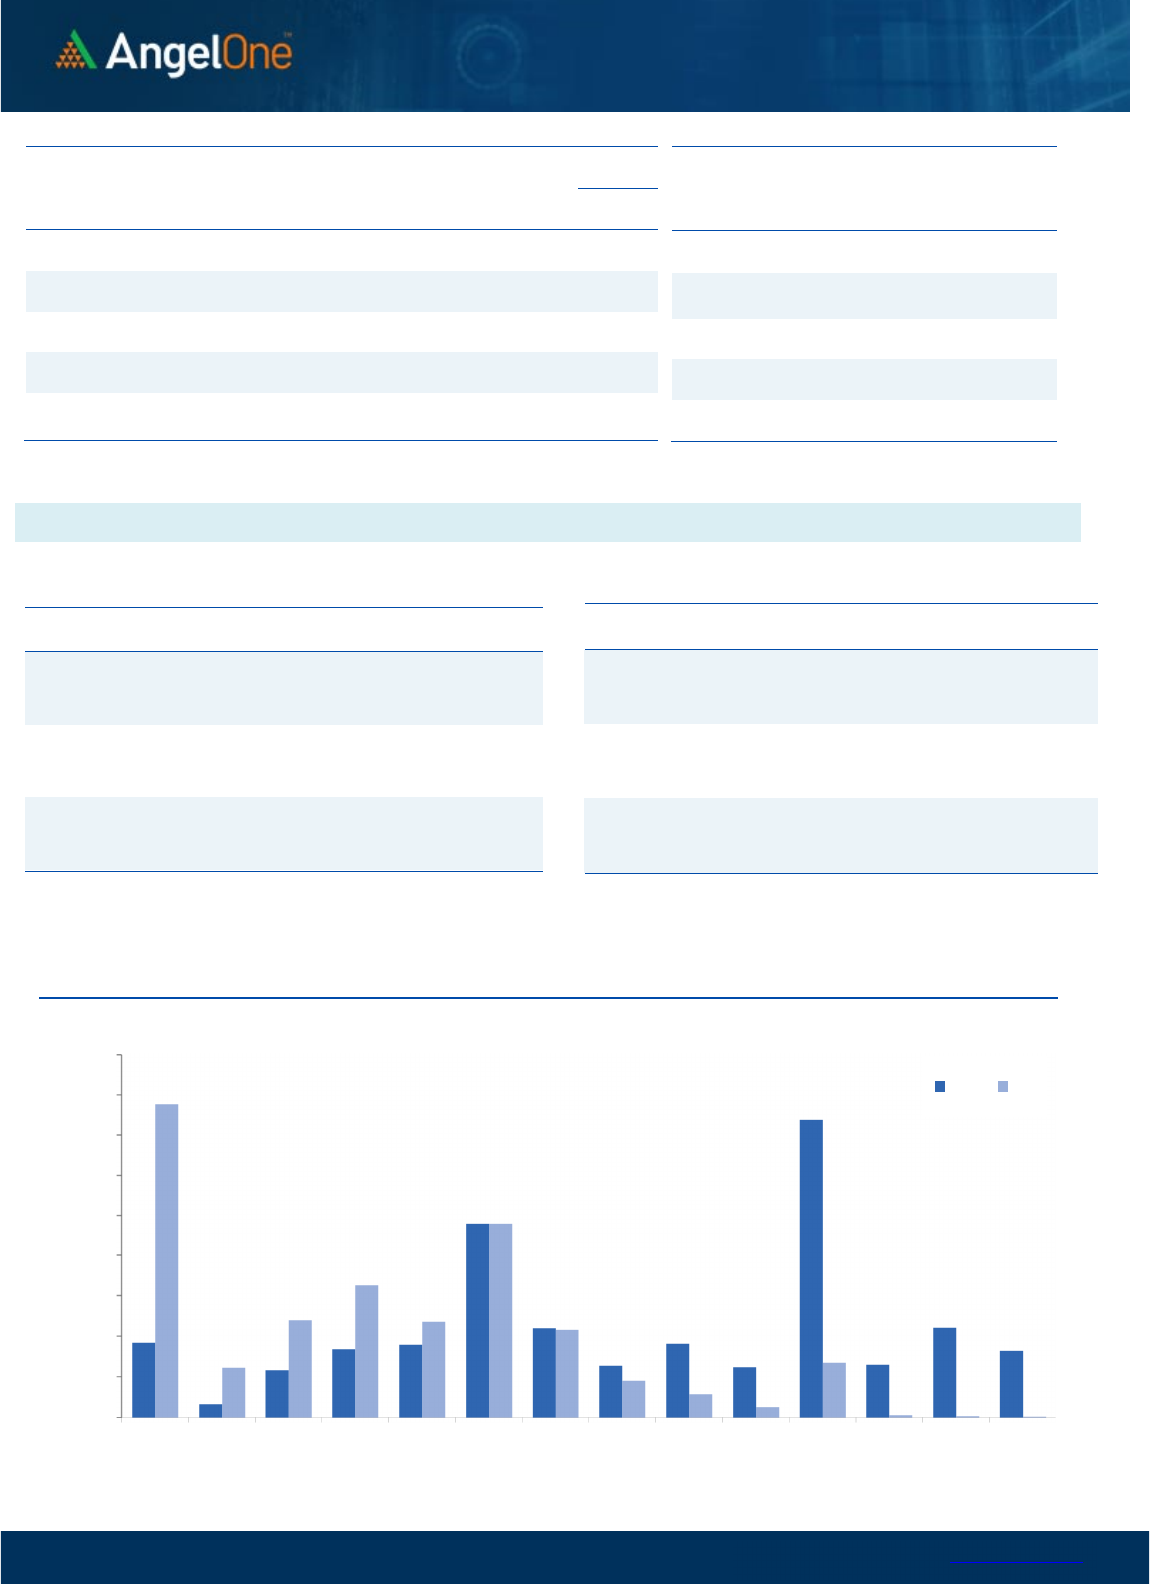
Nifty Bank Outlook (43020)
Bank Nifty started the week with a gap-down opening however
bulls took this as an opportunity as prices bounced back to regain
the lost ground. Subsequently, trading with a positive bias for the
major part there was some profit booking at fag end to eventually
end flat tad above 43000 levels.
Technically, not much has changed and it seemed to be a breather
day for the bulls after the recent strong run. One of the key takes
was the intraday dip getting bought and going ahead as well the
ideal strategy would be using intraday dips as a buying opportunity.
On the flip side, we expect this bull run to continue however with
the indicators in the overbought zone; traders can prefer to book
profit at higher levels. In such a scenario, immediate support is
seen at 42740 - 42600 levels whereas resistance is seen at 43350 -
43500 levels.
Key Levels
Support 1 – 42740 Resistance 1 – 43350
Support 2 – 42600 Resistance 2 – 43500
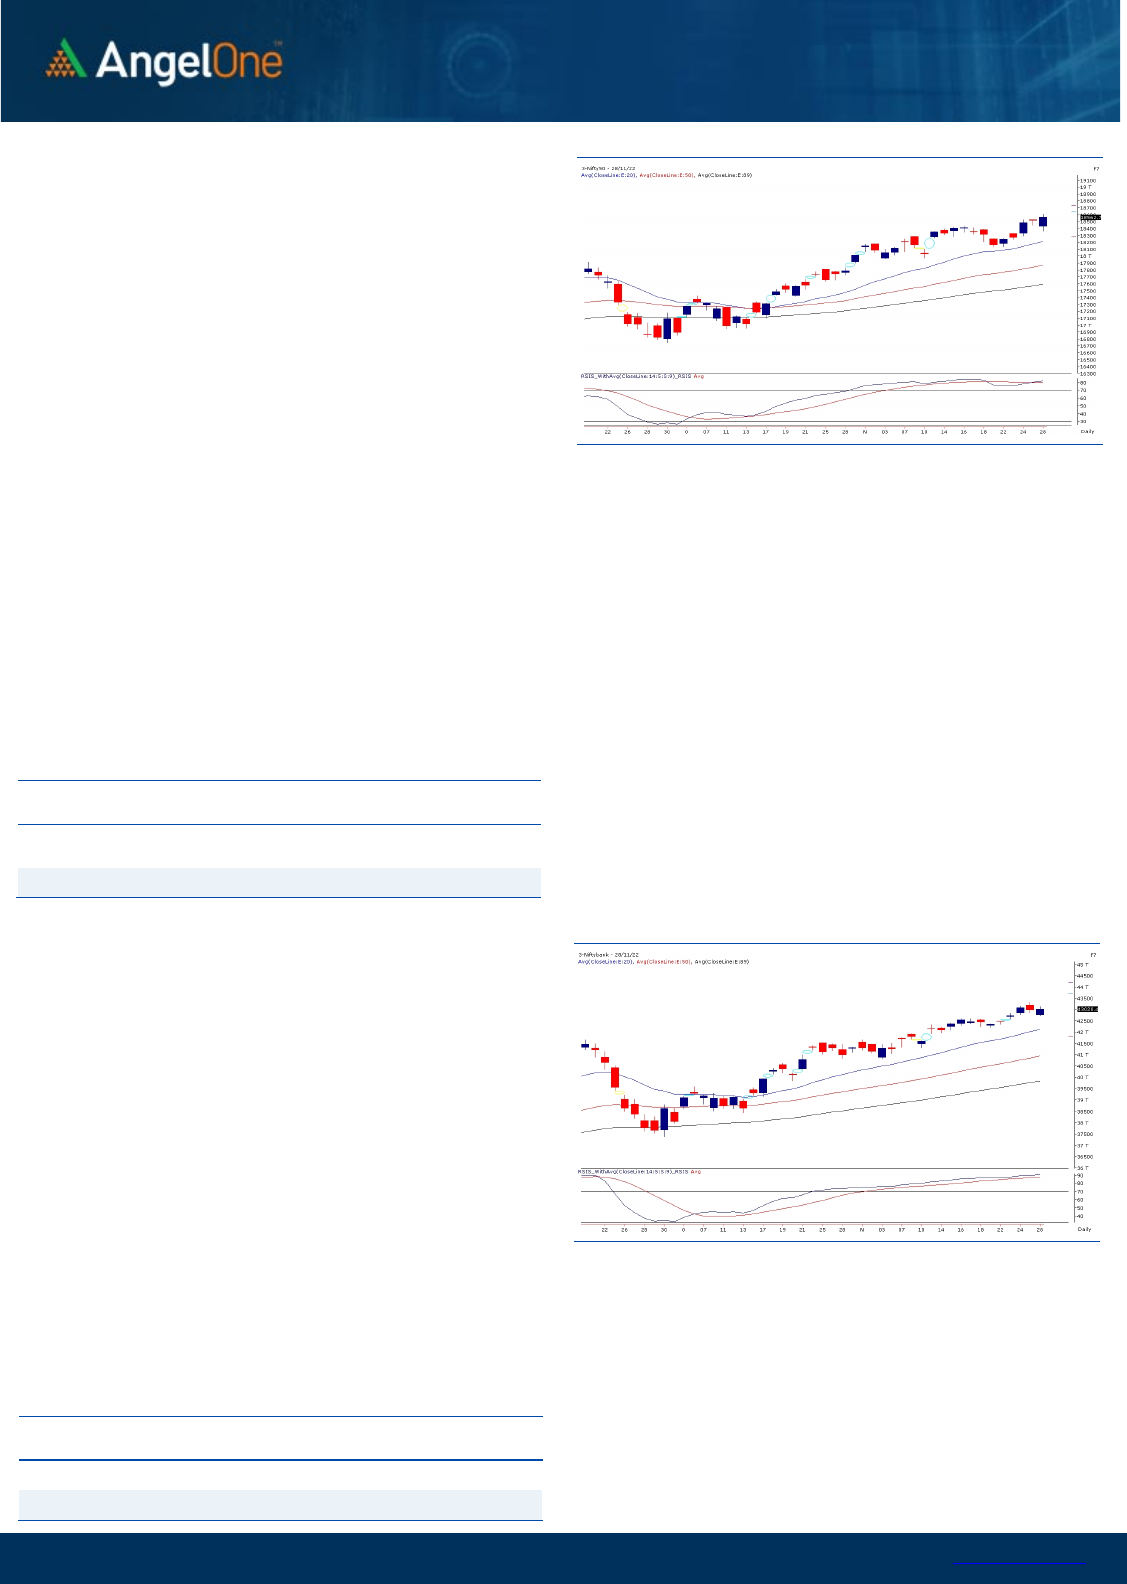
Exhibit 1: Nifty
Daily
Chart
Exhibit 2: Nifty Bank
Daily
Chart
Sensex (62505) / Nifty (18563)
The week started on a nervous note owing to cautious approach in
the global peers. With COVID related concerns in China, our markets
too opened slightly in the negative territory. After a brief pause, the
buying resumed as we stepped into the second half. However, due
to some modest profit booking towards the end, Nifty ended the
session with over two tenths of a percent gains.
The Nifty finally clocked its new all-time high after crossing the
18600 mark. However, the ecstasy was slightly missing at record
highs. This resulted in traders taking some money off the table and
hence, Nifty erased some portion of its gains to close comfortably
below it. Yesterday also our markets displayed the inherent
strength they possess; because global things were a bit tricky, our
markets managed to shrug off the negativity to continue the
northward journey. Going ahead, if there is no major aberration
globally, we are likely to see series of new highs in coming days.
Hence traders are advised to continue with an optimistic approach
and keep buying in declines. As far as levels are concerned, 18500-
18400 is to be seen as key supports: whereas on the flipside, 18620-
18750 are the levels to watch out for.
Key Levels
Support 1 – 18500 Resistance 1 – 18620
Support 2 – 18400 Resistance 2 – 18750

www.angelone.in
Technical & Derivatives Report
NOV 29, 2022
View
Our market has kickstarted the new week on a
promising note, wherein the benchmark index Nifty50
clocked a new high and settled with a gain of 0.27
percent, a tad above the 18550 level.
FIIs were net buyers in the cash market segment to
the tune of Rs. 936 crores. Simultaneously, in Index
futures, they bought worth Rs. 1414 crores with an
increase in open interest, indicating long addition.
Looking at the overall F&O data, we have witnessed a
long addition in the benchmark index at the start of the
week. On the options front, the huge concentration of
OI is visible in the 18500-18400 put strike, indicating
nearby support. On the higher end, the piling up of
positions could be seen at 18600-18800 call strikes,
suggesting the intermediate resistance for the index.
Also, the stronger hands have remained steady with
their bullish bets as the ‘Long Short Ratio’ surged to
73% from 71%. Going ahead, the undertone is likely to
remain bullish, and any intra-day dip could be seen as
an opportunity to add longs in the index.
Comments
The Nifty futures open interest has increased by
5.84% and Bank Nifty futures open interest has
increased by 0.98% as the market closed at 18562.75.
The Nifty December future closed with a premium of
131.35 point against a premium of 133.35 point in the
last trading session. The January series closed at a
premium of 234.90 point.
The INDIA VIX increased from 13.33 to 13.56. At the
same time, the PCR-OI of Nifty has increased from
1.18 to 1.28.
Few of the liquid counters where we have seen high
cost of carry are BPCL, APOLLOTYRE, HINDPETRO,
IOC and RELIANCE.
Historical Volatility
SCRIP HV
IDEA 73.82
IBULHSGFIN 70.71
RBLBANK 69.28
GNFC 60.12
HINDCOPPER 59.41
Nifty Vs OI
17800
17900
18000
18100
18200
18300
18400
18500
18600
18700
18800
8,000
9,000
10,000
11,000
12,000
13,000
14,000
15,000
16,000
11/8 11/10 11/15 11/17 11/22 11/24 11/28
Openinterest Nifty
OI Gainers
SCRIP OI
OI
CHG. (%)
PRICE
PRICE
CHG. (%)
APOLLOTYRE 18319000 23.33 312.70 6.48
SRTRANSFIN 4926600 19.42 1264.75 -0.51
DELTACORP 19774700 12.46 232.10 4.91
IBULHSGFIN 51156000 12.29 143.10 3.37
VEDL 34487300 11.45 310.55 -1.76
ICICIPRULI 17979000 10.10 455.15 0.49
BAJAJFINSV 7202500 8.53 1652.85 1.13
FSL 15849600 8.47 109.20 -0.14
OI Losers
SCRIP OI
OI
CHG. (%)
PRICE
PRICE
CHG. (%)
BSOFT 8908000 -10.38 299.60 1.86
ATUL 118500 -7.71 8420.80 2.22
HDFCLIFE 13908400 -7.21 586.00 -0.20
MFSL 5198050 -4.90 684.40 2.74
HEROMOTOCO 2454000 -4.65 2783.50 2.76
LTTS 1085400 -4.50 3862.00 0.12
PFC 47795800 -4.33 134.60 -1.45
INDHOTEL 36973736 -4.25 325.85 1.03
Put-Call Ratio
SCRIP PCR (OI) PCR (VOL)
NIFTY 1.28 0.89
BANKNIFTY 0.88 0.86
RELIANCE 0.65 0.35
ICICIBANK 0.66 0.51
INFY 0.64 0.38
www.angelone.in
Technical & Derivatives Report
NOV 29, 2022
Note: Above mentioned Bullish or Bearish Spreads in Nifty (Dec Series) are given as an information and not as a recommendation.
Nifty Spot =
1
8
5
6
2.75
FII Statistics for
November
2
8
, 2022
Detail Buy
Contracts
Open
Interest
Value
(in Cr.)
Sell
Net
CHANGE
INDEX
FUTURES
3726.47 2312.27 1414.20
192587 18798.24 9.38
INDEX
OPTIONS
748507.57 745969.64 2537.93
1968174 192888.56 13.19
STOCK
FUTURES
8691.41 10155.63 (1464.22) 1962729 136888.17 (0.93)
STOCK
OPTIONS
7661.17 7816.45 (155.28) 84824 6144.19 26.36
Total 768586.62
766253.99
2332.63
4208314
354719.16
6.19
Turnover on
November
2
8
, 2022
Instrument
No. of
Contracts
Turnover
( in Cr. )
Change
(%)
Index
Futures
220676 2188000.93
-32.84
Index
Options
100969557 3191880.45
-2.62
Stock
Futures
693551 4866592.69
-37.94
Stock
Options
2649448 385150.96 25.77
Total
26,49,448 385150.96 -27.59
Bull-Call Spreads
Action Strike Price Risk Reward BEP
Buy
18500 370.25
67.30
32.70
18567.30
Sell
18600 302.95
Buy
18500 370.25
122.55
77.45
18622.55
Sell
18700 247.70
Buy
18600 302.95
55.25 44.75 18655.25
Sell 18700 247.70
Bear
-
Put Spreads
Action Strike Price Risk Reward BEP
Buy 18500 175.70
28.55
71.45
18471.45
Sell
18400 147.15
Buy 18500 175.70
54.50
145.50
18445.50
Sell 18300 121.20
Buy
18400 147.15
25.95 74.05 18374.05
Sell 18300 121.20
Nifty Put
-
Call Analysis
,0
500,000
1000,000
1500,000
2000,000
2500,000
3000,000
3500,000
4000,000
4500,000
18000 18100 18200 18300 18400 18500 18600 18700 18800 18900 19000 19100 19200 19300
Call Put

www.angelone.in
Technical & Derivatives Report
NOV 29, 2022
`
Daily Pivot Levels for Nifty Constituents
Scrips
S2
S1
PIVOT
R1 R2
ADANIENT
3,841
3,863
3,894 3,917
3,948
ADANIPORTS
867
873
879
885 891
APOLLOHOSP 4,639 4,680
4,725
4,766
4,810
ASIANPAINT 3,073 3,112
3,136
3,175
3,198
AXISBANK
878
885
892
899
906
BAJAJ-AUTO 3,593 3,635
3,672
3,714
3,752
BAJFINANCE
6,675
6,726
6,780 6,831
6,884
BAJAJFINSV 1,615 1,634
1,648
1,667
1,681
BPCL 322 331
337
346 351
BHARTIARTL
826
831
842
848
859
BRITANNIA
4,133
4,173
4,201
4,241
4,269
CIPLA
1,086
1,094
1,102
1,110
1,118
COALINDIA 226 228
230
232
235
DIVISLAB
3,319
3,347
3,366
3,395
3,414
DRREDDY
4,351
4,377
4,412
4,437
4,473
EICHERMOT 3,384 3,413
3,431
3,460
3,478
GRASIM
1,694
1,706
1,725
1,736
1,755
HCLTECH 1,107 1,113
1,123 1,129
1,139
HDFCBANK
1,587
1,594
1,601 1,607
1,614
HDFCLIFE 576 581
587
592
598
HDFC
2,619
2,639
2,656
2,675
2,692
HEROMOTOCO
2,675
2,729
2,767
2,821
2,858
HINDALCO
425
428
432
435
440
HINDUNILVR 2,509 2,517
2,530 2,538
2,551
ICICIBANK
915
926
935
946
955
INDUSINDBK 1,167 1,183
1,194
1,209
1,221
INFY
1,599
1,611
1,632
1,645
1,666
ITC 337 339
340
342
343
JSW STEEL
702
709
717
724
732
KOTAKBANK
1,902
1,915
1,929
1,942
1,956
LT 2,043 2,054
2,063 2,074 2,083
M&M
1,230
1,240
1,256
1,266
1,282
MARUTI 8,859 8,922
9,013
9,076
9,167
NESTLEIND
19,322
19,569
19,707
19,954
20,092
NTPC 168 169
171
172
173
ONGC 138 139
140 141 142
POWERGRID 218 220
221
223
224
RELIANCE 2,424 2,566
2,644 2,785 2,863
SBILIFE
1,208
1,231
1,250
1,273
1,293
SBIN
599
604
607
612
616
SUNPHARMA 1,021 1,028
1,035
1,042
1,048
TCS
3,341
3,368
3,393
3,420
3,444
TATACONSUM
776 790
799
814
823
TATAMOTORS
427
430
435
438
443
TATASTEEL 103 104
105
106
107
TECHM
1,060
1,069
1,080
1,088
1,099
TITAN 2,564 2,578
2,593
2,608
2,623
ULTRACEMCO 6,832 6,862
6,893 6,924 6,955
UPL
771
775
780
785
790
WIPRO
398
402
406
409 413

www.angelone.in
Technical & Derivatives Report
NOV 29, 2022
*
Technical and Derivatives Team:
Sameet Chavan Chief Analyst – Technical & Derivatives sameet.chavan@angelone.in
Sneha Seth Senior Analyst – Technical & Derivatives sneha.seth@angelone.in
Rajesh Bhosale Technical Analyst rajesh.bhosle@angelone.in
Osho Krishan Senior Analyst – Technical & Derivatives osho.krishan@angelone.in
Research Team Tel: 022 – 39357600 Website: www.angelone.in
For Technical Queries E-mail: technicalresearch-cso@angelone.in
For Derivatives Queries E-mail: derivatives.desk@angelone.in
DISCLAIMER
Angel One Limited (hereinafter referred to as “Angel”) is a registered Member of National Stock Exchange of India Limited, Bombay
Stock Exchange Limited and Metropolitan Stock Exchange Limited. It is also registered as a Depository Participant with CDSL and
Portfolio Manager and investment advisor with SEBI. It also has registration with AMFI as a Mutual Fund Distributor. Angel One
Limited is a registered entity with SEBI for Research Analyst in terms of SEBI (Research Analyst) Regulations, 2014 vide registration
number INH000000164. Angel or its associates has not been debarred/ suspended by SEBI or any other regulatory authority for
accessing /dealing in securities Market.
This document is solely for the personal information of the recipient, and must not be singularly used as the basis of any investment
decision. Nothing in this document should be construed as investment or financial advice. Each recipient of this document should
make such investigations as they deem necessary to arrive at an independent evaluation of an investment in the securities of the
companies referred to in this document (including the merits and risks involved), and should consult their own advisors to determine
the merits and risks of such an investment.
Angel or its associates or research analyst or his relative may have actual/beneficial ownership of 1% or more in the securities of
the subject company at the end of the month immediately preceding the date of publication of the research report. Neither Angel or
its associates nor Research Analysts or his relative has any material conflict of interest at the time of publication of research report.
Angel or its associates might have received any compensation from the companies mentioned in the report during the period
preceding twelve months from the date of this report for services in respect of managing or co-managing public offerings, corporate
finance, investment banking or merchant banking, brokerage services or other advisory service in a merger or specific transaction
in the normal course of business. Angel or its associates did not receive any compensation or other benefits from the companies
mentioned in the report or third party in connection with the research report. Neither Angel nor its research analyst entity has been
engaged in market making activity for the subject company.
Reports based on technical and derivative analysis center on studying charts of a stock's price movement, outstanding positions and
trading volume, as opposed to focusing on a company's fundamentals and, as such, may not match with a report on a company's
fundamentals. Investors are advised to refer the Fundamental and Technical Research Reports available on our website to evaluate
the contrary view, if any.
The information in this document has been printed on the basis of publicly available information, internal data and other reliable
sources believed to be true, but we do not represent that it is accurate or complete and it should not be relied on as such, as this
document is for general guidance only. Angel One Limited or any of its affiliates/ group companies shall not be in any way responsible
for any loss or damage that may arise to any person from any inadvertent error in the information contained in this report. Angel One
Limited has not independently verified all the information contained within this document. Accordingly, we cannot testify, nor make
any representation or warranty, express or implied, to the accuracy, contents or data contained within this document. While Angel
One Limited endeavors to update on a reasonable basis the information discussed in this material, there may be regulatory,
compliance, or other reasons that prevent us from doing so.
This document is being supplied to you solely for your information, and its contents, information or data may not be reproduced,
redistributed or passed on, directly or indirectly.
Neither Angel One Limited, nor its directors, employees or affiliates shall be liable for any loss or damage that may arise from or in
connection with the use of this information. Angel or its associates or Research Analyst or his relative might have financial interest
in the subject company. Research analyst has not served as an officer, director or employee of the subject company.
