September
2
9
, 2023
www.angelone.in
Technical & Derivatives Report
8
Nifty Bank Outlook (
4
4
301
)
The monthly expiry day began on a positive note, but these gains
faded as the day progressed. In the morning trade, the banking index
briefly reclaimed the 44750 level, but sharp selling pressure later
dragged the index lower to test the 44250 mark. Due to some
extended profit booking in the latter half of the series, most of the
early month gains just disappeared, ultimately concluding the series
with a modest 0.7% gain MOM.
As mentioned in our previous commentary, we witnessed a surge in
volatility, but the extent of the sell-off was clearly unexpected.
Nevertheless, the damage in the banking index was not as severe as it
is in the benchmark index, but selling pressure observed during any
minor pullback attempts doesn’t bode well for Bulls. This has
undeniably dented the overall market sentiment. We eagerly await
the commencement of the October series to see how things pan out
after yesterday's setback. In terms of key levels, the previous swing
low in the range of 44000-43800 is now to be seen as a critical zone.
On the other hand, 44700-44800 should now serve as an immediate
hurdle.
Key Levels
Support 1 – 44000 Resistance 1 – 44700
Support 2 – 43800 Resistance 2 – 44800
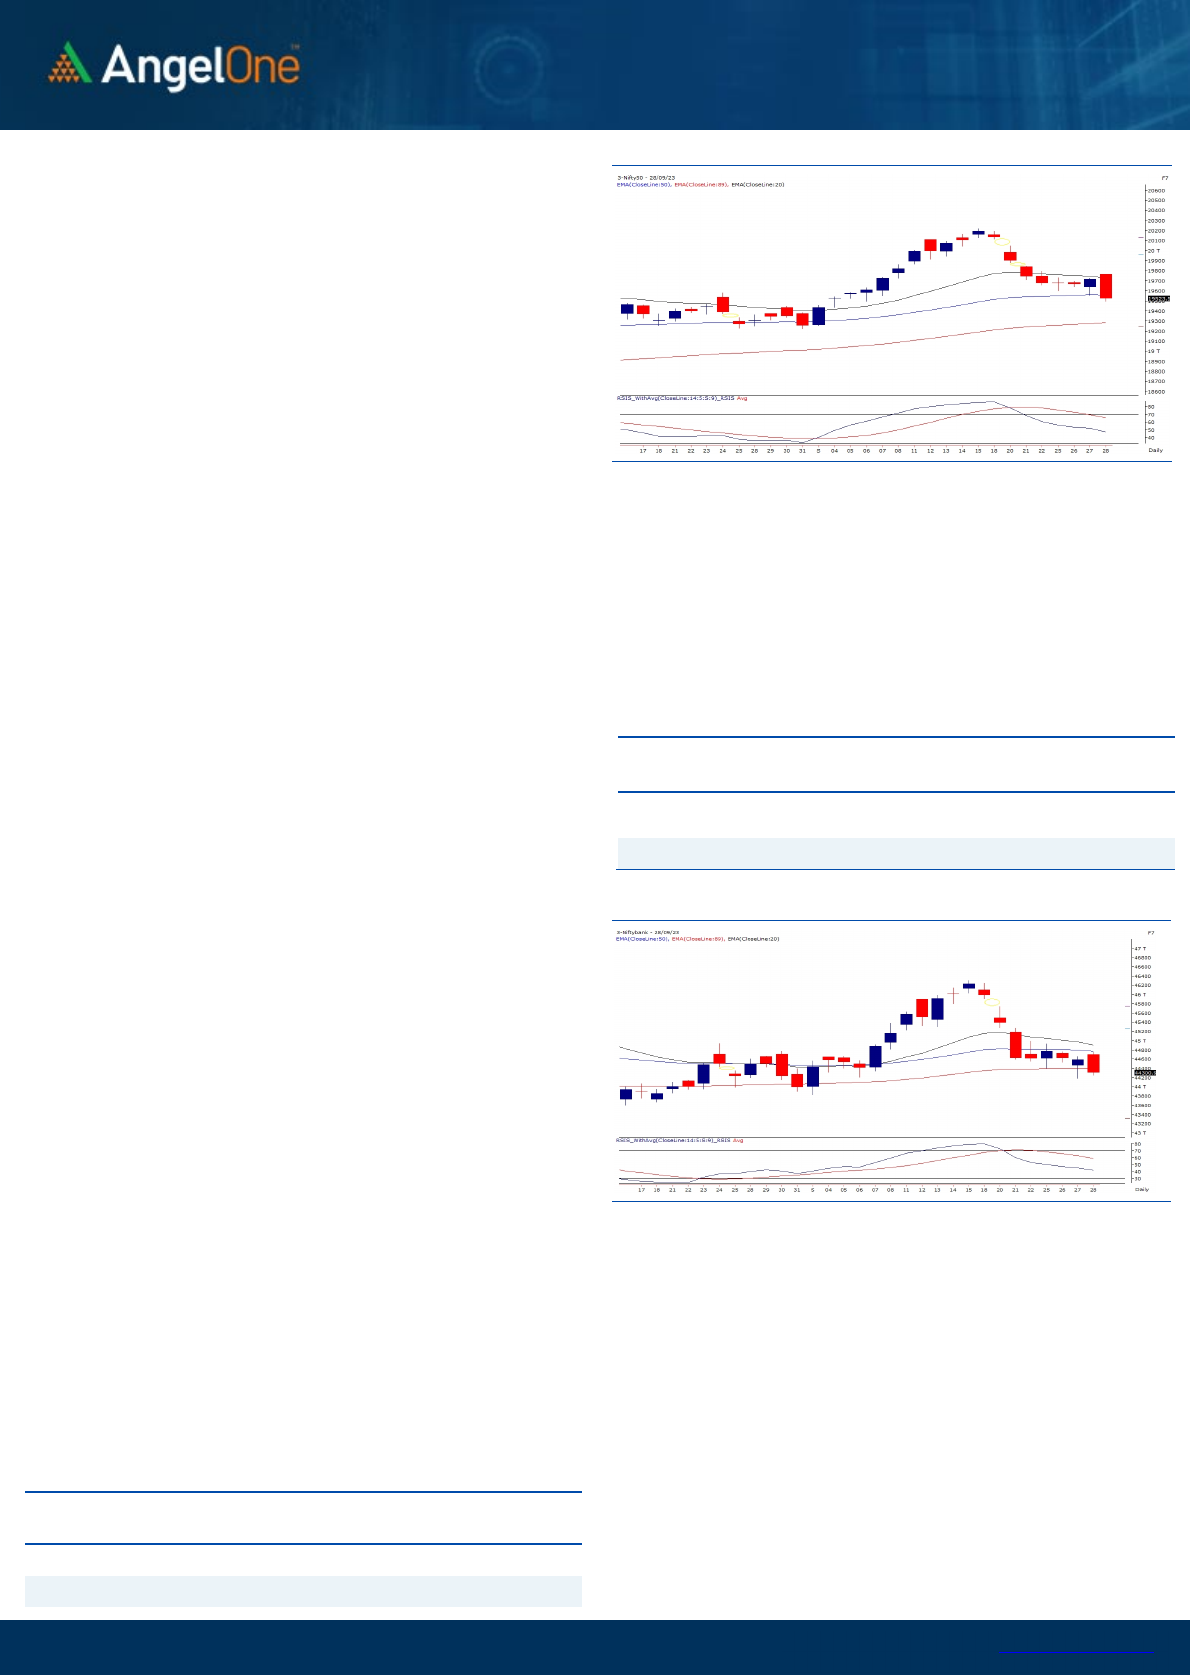
Exhibit 1: Nifty Daily Chart
Exhibit 2: Nifty Bank Daily Chart
Sensex (
6
5508
) / Nifty (
19
524
)
Following a robust finish on Wednesday, the start of the monthly expiry
session displayed positivity. Nonetheless, there was a lack of sustained
buying interest, causing prices to gradually decline and erase the
morning gains. As the monthly expiry progressed, the breach of key
intra-day levels led to increased selling pressure, ultimately resulting in
prices closing with a substantial drop of around a percent, ending a tad
above the 19500 mark.
Bears continue to exert control as the market remains hesitant at
higher levels. Without a significant rebound from robust support levels,
these levels are easily breached. Notably, Nifty has now broken below
the support at 19600, a confluence zone formed by the 50-day SMA
and the 61.8 percent retracement levels of the recent rally. This zone
had previously acted as support in recent sessions. Whether these
critical support levels have genuinely been broken or if this is merely a
consequence of the expiry effect remains to be seen. Consequently, the
coming session, the final session of September, holds great importance.
If the weakness persists, one should prepare for further declines, with
the levels around 19300, marked by the 89-day EMA, and the origin
point of the recent rally at 19200, potentially coming into play. It's
worth noting that adding short positions is still not advisable at this
point as hourly indicators are currently in the oversold zone, with a
visible two-point positive divergence, suggesting the possibility of
intermittent strong rebounds in the market.
On the other hand, immediate resistance levels are expected at
various points, but the range of 19750 to 19850 holds particular
significance, as only a breakthrough beyond it could be considered
as the first sign of relief for the bulls after the recent market
turmoil. Traders should closely monitor global developments, as any
positive development on that front could provide much-needed
support to the bulls during this challenging period. Additionally, it's
advisable to keep overnight positions light, especially with an
extended weekend ahead.
Key Levels
Support 1 – 19450 Resistance 1 – 19700
Support 2 – 19300 Resistance 2 – 19780

www.angelone.in
Technical & Derivatives Report
September
2
9
, 2023
View
The Indian equity market witnessed a strong sell-off
on the expiry session, wherein the benchmark index
Nifty50 skids towards the 19500 zone, eroding nearly
a percent.
FIIs were net sellers in the cash market segment to
the tune of Rs. 3364 cr. Simultaneously, they sold
worth Rs. 3893 cr in Index futures with a fall in open
interest, suggesting long unwinding.
On the derivatives front, we witnessed long
unwinding in key indices on the expiry session. On
the options front, the highest piling of OI is seen at
19500 put strike, followed by 19400 PE. On the other
side, the highest OI concentration stands at 19700
call strike, indicating the intermediate resistance.
Stronger hands continued their sell-off in the cash
segment, denting the overall sentiments.
Considering the mentioned data and recent price
action, the market seems a bit oversold, but it is
advisable to avoid aggressive bets and stay abreast
with global developments.
Comments
The Nifty futures open interest has decreased by
14.18% and Bank Nifty futures open interest has
decreased by 6.80% as the market closed at 19523.55.
The Nifty October future closed with a premium of
113.55 points against 112.45 points in the last trading
session. The November series closed at a premium of
237.90 points.
The INDIA VIX has increased from 11.59 to 12.82. At the
same time, the PCR-OI of Nifty has decreased from 1.07
to 0.98.
A few of the liquid counters where we have seen high
cost of carry are BERGEPAINT, MCX, ASIANPAINT,
MARICO and COLPAL.
Historical Volatility
SCRIP HV
BERGEPAINT 30.50
CANBK 42.28
ZYDUSLIFE 28.60
GRANULES 38.58
DRREDDY 24.94
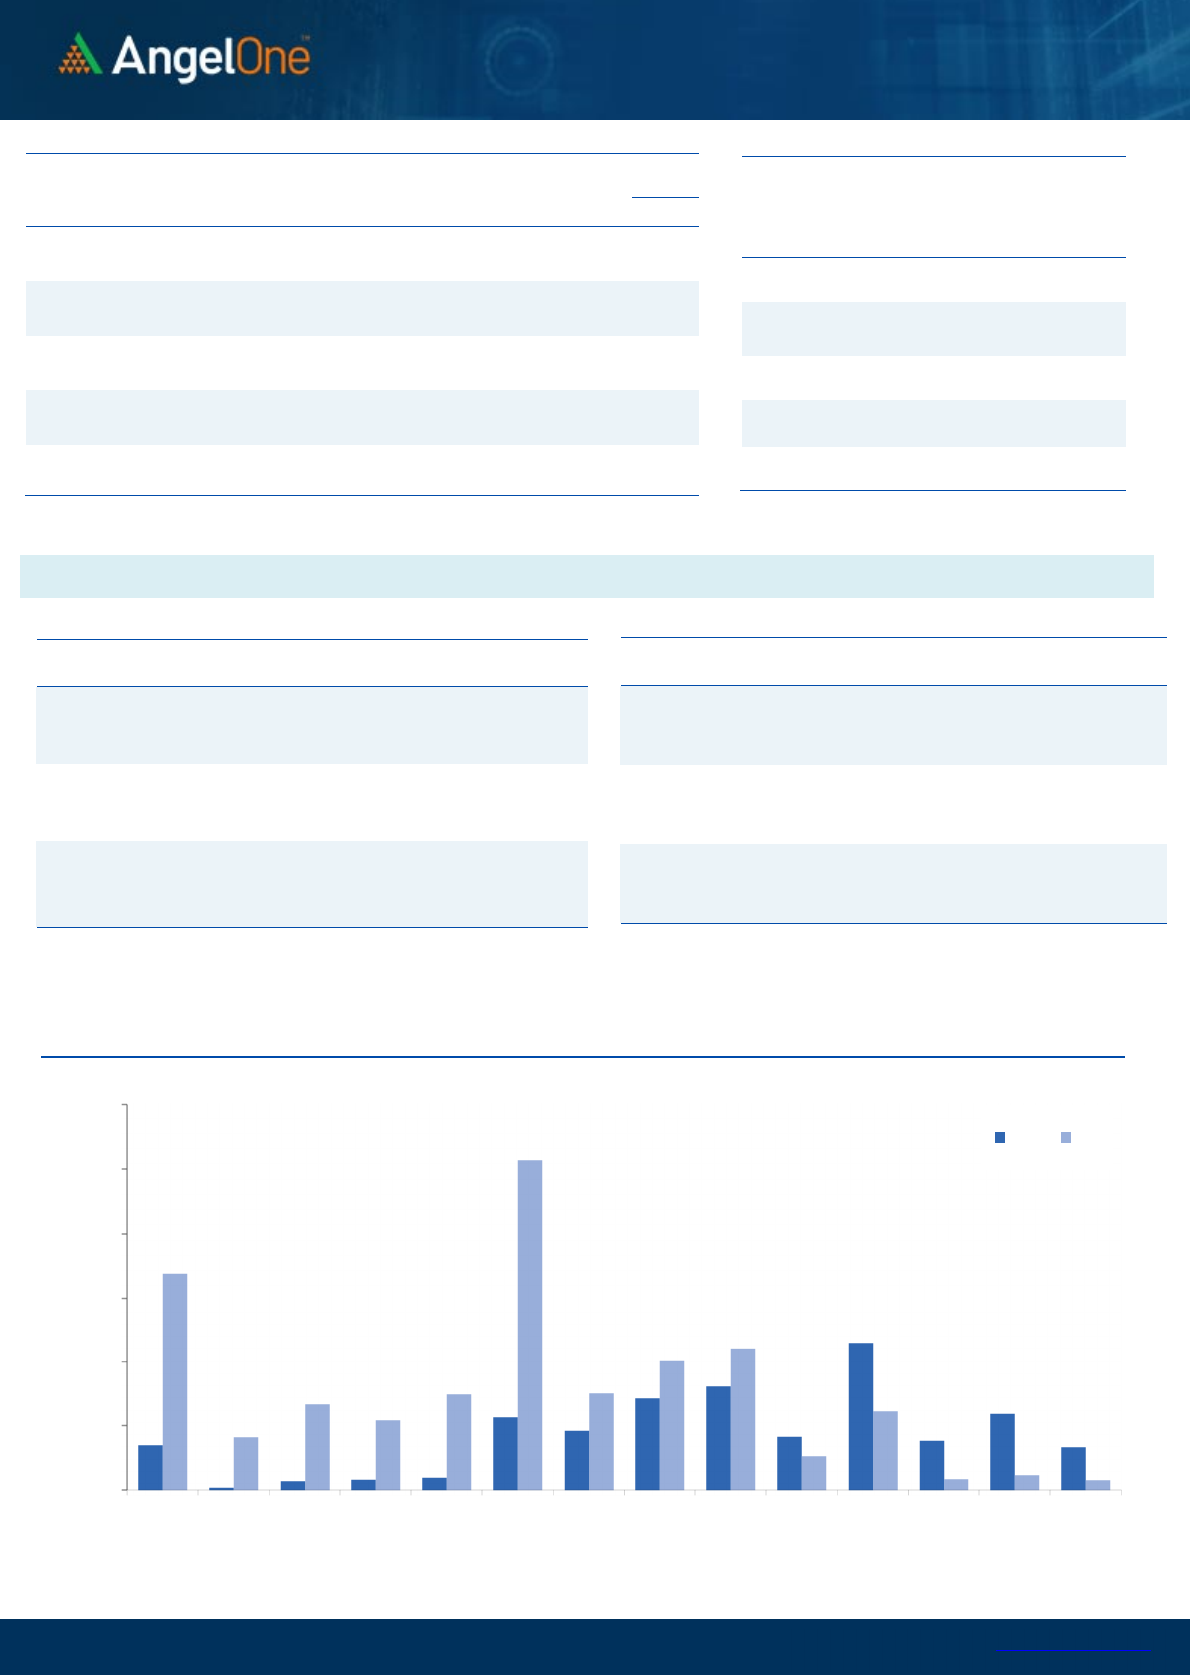
Nifty Vs OI
19000
19200
19400
19600
19800
20000
20200
20400
20600
9,000
9,500
10,000
10,500
11,000
11,500
12,000
12,500
13,000
13,500
14,000
9-12 9-14 9-18 9-21 9-26 9-28
Openinterest Nifty
OI Gainers
SCRIP OI
OI
CHG. (%)
PRICE
PRICE
CHG. (%)
ASIANPAINT 6100000 14.85 3170.35 -4.23
KOTAKBANK 32113200 13.50 1733.20 -2.12
BHEL 107215500 11.60 126.65 -0.08
TECHM 12963000 8.44 1229.50 -4.59
ICICIBANK 91562100 8.07 942.60 -0.11
HINDCOPPER 33093200 7.54 156.30 -1.72
INDUSINDBK 23313000 5.48 1413.00 -1.66
M&M 15013600 3.93 1556.05 -2.20
OI Losers
SCRIP OI
OI
CHG. (%)
PRICE
PRICE
CHG. (%)
ONGC 17600 -39.01 187.45 0.51
DELTACORP 10721200 -36.40 140.75 0.11
INDIACEM 15135100 -29.82 226.65 -1.61
COALINDIA 77414400 -28.74 290.20 -0.03
COFORGE 1228500 -27.98 5123.45 -1.92
HCLTECH 8810900 -25.53 1241.95 -1.58
GRANULES 9994000 -24.81 341.85 -2.48
IPCALAB 1717300 -23.44 923.85 -0.31
Put-Call Ratio
SCRIP PCR (OI) PCR (VOL)
NIFTY 0.98 0.88
BANKNIFTY 0.76 0.87
RELIANCE 0.71 0.53
ICICIBANK 0.52 0.46
INFY 0.62 0.56
www.angelone.in
Technical & Derivatives Report
September
2
9
, 2023
Note: Above mentioned Bullish or Bearish Spreads in Nifty (Oct Series) are given as an information and not as a recommendation.
Nifty Spot =
19
523
.
55
FII Statistics for
September
2
8
, 2023
Detail Buy
Contracts
OI Value
(in Cr.)
Sell Net
CHANGE
INDEX
FUTURES
6643.16 10536.47 (3893.31) 147103 11909.00
(28.08)
INDEX
OPTIONS
2709127.33 2711162.04 (2034.71) 2494082 202487.52
(50.47)
STOCK
FUTURES
37131.41 44872.07 (7740.66) 2356289 184899.01 (1.26)
STOCK
OPTIONS
4554.38 4459.35 95.03
33933 2744.73
(87.85)
Total
2757456.28
2771029.93
(13573.65) 5031407
402040.26
(36.36)
Turnover on
September
2
8
, 2023
Instrument
No. of
Contracts
Turnover
(in Cr.)
Change
(%)
Index Futures
656997 54143.62
47.91
Index Options
703455230
67005.89
10.74
Stock Futures
2805628 224828.35
25.56
Stock Options
3423628 4360.81 15.36
Total
34,23,628
4360.81 25.14
Bull-Call Spreads
Action Strike Price Risk Reward BEP
Buy
19400 411.05
66.35
33.65
19466.35
Sell
19500 344.70
Buy
19400 411.05
128.45
71.55
19528.45
Sell
19600 282.60
Buy
19500 344.70
62.10 37.90 19562.10
Sell
19600 282.60
Bear-Put Spreads
Action Strike Price Risk Reward BEP
Buy
19600 242.45
35.45
64.55
19564.55
Sell 19500 207.00
Buy 19600 242.45
70.25
129.75
19529.75
Sell
19400 172.20
Buy
19500 207.00
34.80 65.20 19465.20
Sell 19400 172.20
Nifty Put
-
Call Analysis
,0
1000,000
2000,000
3000,000
4000,000
5000,000
6000,000
19000 19100 19200 19300 19400 19500 19600 19700 19800 19900 20000 20100 20200 20300
Call Put

www.angelone.in
Technical & Derivatives Report
September
2
9
, 2023
`
Daily Pivot Levels for Nifty Constituents
Scrips S2 S1 PIVOT R1 R2
ADANIENT 2,413 2,444 2,478 2,509 2,542
ADANIPORTS 806 814 828 837 850
APOLLOHOSP 4,903 4,962 5,054 5,112 5,204
ASIANPAINT 3,071 3,121 3,205 3,255 3,339
AXISBANK 1,019 1,025 1,031 1,038 1,044
BAJAJ-AUTO 4,890 4,948 5,039 5,097 5,187
BAJFINANCE 7,651 7,695 7,762 7,806 7,873
BAJAJFINSV 1,510 1,525 1,550 1,565 1,590
BPCL 337 341 345 349 353
BHARTIARTL 912 919 925 932 939
BRITANNIA 4,425 4,475 4,555 4,604 4,684
CIPLA 1,143 1,154 1,169 1,180 1,195
COALINDIA 286 288 291 293 296
DIVISLAB 3,556 3,611 3,705 3,760 3,854
DRREDDY 5,353 5,391 5,449 5,487 5,546
EICHERMOT 3,380 3,410 3,455 3,485 3,530
GRASIM 1,872 1,889 1,914 1,931 1,955
HCLTECH 1,221 1,232 1,249 1,259 1,276
HDFCBANK 1,507 1,516 1,527 1,535 1,546
HDFCLIFE 622 628 640 646 657
HEROMOTOCO 2,925 2,947 2,983 3,005 3,041
HINDALCO 455 461 470 476 485
HINDUNILVR 2,424 2,442 2,472 2,490 2,519
ICICIBANK 929 936 942 948 954
INDUSINDBK 1,387 1,400 1,423 1,436 1,459
INFY 1,411 1,425 1,449 1,463 1,487
ITC 433 437 443 447 454
JSW STEEL 750 759 773 782 796
KOTAKBANK 1,702 1,718 1,745 1,760 1,788
LT 2,941 2,975 3,013 3,048 3,085
LTIMINDTREE 5,071 5,168 5,315 5,412 5,559
M&M 1,513 1,534 1,566 1,587 1,619
MARUTI 10,428 10,497 10,601 10,670 10,774
NESTLEIND 22,171 22,355 22,631 22,815 23,092
NTPC 232 235 238 240 244
ONGC 185 186 188 189 191
POWERGRID 194 198 201 204 208
RELIANCE 2,289 2,312 2,347 2,370 2,405
SBILIFE 1,270 1,280 1,294 1,304 1,318
SBIN 585 587 591 594 598
SUNPHARMA 1,115 1,123 1,138 1,147 1,161
TCS 3,480 3,508 3,556 3,584 3,631
TATACONSUM
855 866 881 892 907
TATAMOTORS 605 610 617 621 628
TATASTEEL 124 126 127 129 130
TECHM 1,190 1,210 1,242 1,262 1,294
TITAN 3,091 3,124 3,175 3,208 3,258
ULTRACEMCO 8,014 8,084 8,204 8,274 8,394
UPL 592 599 609 615 625
WIPRO 396 401 409 413 421

www.angelone.in
Technical & Derivatives Report
September
2
9
, 2023
Technical and Derivatives Team:
Sameet Chavan Head Research – Technical & Derivatives sameet.chavan@angelone.in
Sneha Seth Senior Analyst – Technical & Derivatives sneha.seth@angelone.in
Rajesh Bhosale Analyst - Technical rajesh.bhosle@angelone.in
Osho Krishan Senior Analyst – Technical & Derivatives osho.krishan@angelone.in
Hitesh Rathi Analyst – Technical & Derivatives hitesh.rathi@angelone.in
Research Team Tel: 022 – 39357600 Website: www.angelone.in
For Technical Queries E-mail: technicalresearch-cso@angelone.in
For Derivatives Queries E-mail: derivatives.desk@angelone.in
DISCLAIMER
We, Angel One Limited (hereinafter referred to as “Angel”) a company duly incorporated under the provisions of the Companies Act, 1956 with
its registered office at 601, 6th Floor, Ackruti Star, Central Road, MIDC, Andheri East, Mumbai – 400093, CIN: (L67120MH1996PLC101709) and
duly registered as a member of National Stock Exchange of India Limited, Bombay Stock Exchange Limited, Metropolitan Stock Exchange Limited,
Multi Commodity Exchange of India Ltd and National Commodity & Derivatives Exchange Ltd. Angel One limited is a company engaged in
diversified financial services business including securities broking, DP services, distribution of Mutual Fund products. It is also registered as a
Depository Participant with CDSL and Portfolio Manager and Investment Adviser with SEBI. It also has registration with AMFI as a Mutual Fund
Distributor. Angel One Limited is a registered entity with SEBI for Research Analyst in terms of SEBI (Research Analyst) Regulations, 2014 vide
registration number INH000000164 and also registered with PFRDA as PoP ,Registration No.19092018. Angel Group does not have any joint
ventures or associates. Angel One Limited is the ultimate parent company of the Group. Angel or its associates has not been debarred/ suspended
by SEBI or any other regulatory authority for accessing /dealing in securities Market.
AOL was merged with Angel Global Capital Private Limited and subsequently name of Angel Global Capital Private Limited was changed to Angel
Broking Private Limited (AOL) pursuant to scheme of Amalgamation sanctioned by the Hon'ble High Court of Judicature at Bombay by Orders
passed in Company Petition No 710 of 2011 and the approval granted by the Registrar of Companies. Further, name of Angel Broking Private
Limited again got changed to Angel Broking Limited (AOL) pursuant to fresh certificate of incorporation issued by Registrar of Companies (ROC)
dated June 28, 2018. Further name of Angel Broking name changed to Angel One Ltd pursuant to fresh certificate of incorporation issued by
Registrar of Companies (ROC) dated 23-09-21.
In case of any grievances please write to: support@angelone.in, Compliance Officer Details: Name : Hiren Thakkar, Tel No. –08657864228, Email
id - compliance@angelone.in
Registration granted by SEBI and certification from NISM in no way guarantee performance of the intermediary or provide any assurance of returns
to investors.
This document is solely for the personal information of the recipient, and must not be singularly used as the basis of any investment decision.
Nothing in this document should be construed as investment or financial advice. Each recipient of this document should make such investigations
as they deem necessary to arrive at an independent evaluation of an investment in the securities of the companies referred to in this document
(including the merits and risks involved), and should consult their own advisors to determine the merits and risks of such an investment.
Angel or its associates or research analyst or his relative may have actual/beneficial ownership of 1% or more in the securities of the subject
company at the end of the month immediately preceding the date of publication of the research report. Neither Angel or its associates nor
Research Analysts or his relative has any material conflict of interest at the time of publication of research report.
Angel or its associates might have received any compensation from the companies mentioned in the report during the period preceding twelve
months from the date of this report for services in respect of managing or co-managing public offerings, corporate finance, investment banking or
merchant banking, brokerage services or other advisory service in a merger or specific transaction in the normal course of business. Angel or its
associates did not receive any compensation or other benefits from the companies mentioned in the report or third party in connection with the
research report. Neither research entity nor research analyst has been engaged in market making activity for the subject company.

www.angelone.in
Technical & Derivatives Report
September
2
9
, 2023
*
Reports based on technical and derivative analysis center on studying charts of a stock's price movement, outstanding positions and trading
volume, as opposed to focusing on a company's fundamentals and, as such, may not match with a report on a company's fundamentals. Investors
are advised to refer the Fundamental and Technical Research Reports available on our website to evaluate the contrary view, if any.
The information in this document has been printed on the basis of publicly available information, internal data and other reliable sources believed
to be true, but we do not represent that it is accurate or complete and it should not be relied on as such, as this document is for general guidance
only. Angel One Limited or any of its affiliates/ group companies shall not be in any way responsible for any loss or damage that may arise to any
person from any inadvertent error in the information contained in this report. Angel One Limited does not warrant the accuracy, adequacy or
completeness of the service, information and materials and expressly disclaims liability for errors or omissions in the service, information and
materials. While Angel One Limited endeavours to update on a reasonable basis the information discussed in this material, there may be
regulatory, compliance, or other reasons that prevent us from doing so.
This document is being supplied to you solely for your information, and its contents, information or data may not be reproduced, redistributed or
passed on, directly or indirectly.
Neither Angel One Limited, nor its directors, employees or affiliates shall be liable for any loss or damage that may arise from or in connection
with the use of this information. Angel or its associates or Research Analyst or his relative might have financial interest in the subject company.
Research analyst has not served as an officer, director or employee of the subject company.
Investment in securities market are subject to market risks. Read all the related documents carefully before investing.
Any communication sent to clients on phone numbers or e-mail ids registered with the Trading Member is meant for client consumption and such
material should not be redistributed. Brokerage will not exceed SEBI prescribed limit. Any Information provided by us through any medium based
on our research or that of our affiliates or third parties or other external sources is subject to domestic and international market conditions and
we do not guarantee the availability or otherwise of any securities or other instruments and such Information is merely an estimation of certain
investments, and we have not and shall not be deemed to have assumed any responsibility for any such Information. You should seek independent
professional advice and/or tax advice regarding the suitability of any investment decision whether based on any Information provided by us
through the Site from inhouse research or third party reports or otherwise.
The report and information contained herein is strictly confidential and meant solely for the selected recipient and may not be altered in any way,
transmitted to, copied or distributed, in part or in whole, to any other person or to the media or reproduced in any form, without prior written
consent.
