March 29, 2023
www.angelone.in
Technical & Derivatives Report
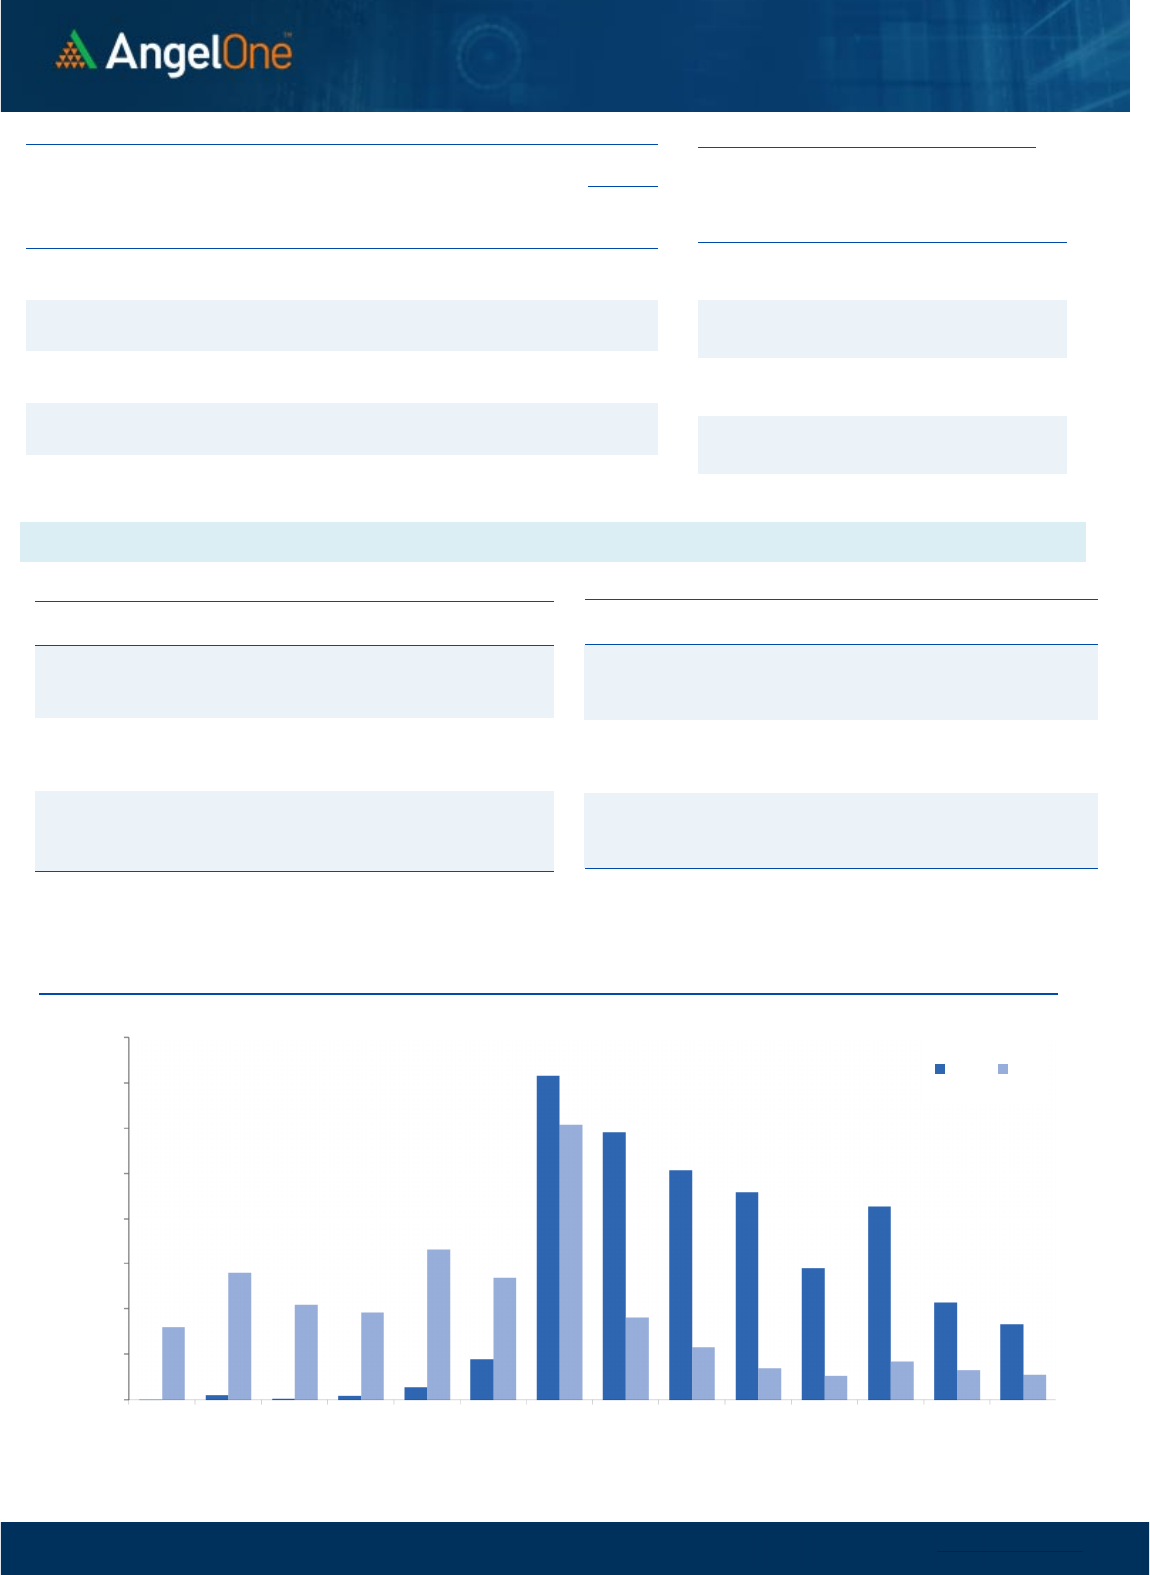
Nifty Bank
Outlook (
39
568
)
Bank Nifty began positively but lacked follow-up buying in the
morning session, resulting in prices remaining within a range for
most of the day. However, during the last hour, prices gained
strong traction and ended at the day's highest point, up 0.35% at
39,568.
Yesterday, the Bank Index managed to defend the low of the Doji
pattern formed on Monday, thanks to heavyweight private banks.
As a result, once again, Bank Nifty outperformed. The recent price
action has resulted the trading range getting coiled, waiting for a
burst of momentum. Yesterday, prices ended slightly below the
breakout levels of a higher range, and it would be interesting to see
how prices react in the coming session. On the monthly expiry, the
key resistance level would be 39,700-39,800, beyond which further
traction could be seen towards 40,000 and then 40,200. On the
downside, the support has shifted higher towards 39,200-39,000
for the expiry session. Traders should monitor these levels and
trade accordingly. It is also advisable to avoid aggressive bets
ahead of the mid-week holiday.
Key Levels
Support 1 – 39200 Resistance 1 – 39800
Support 2 – 39000 Resistance 2 – 40000
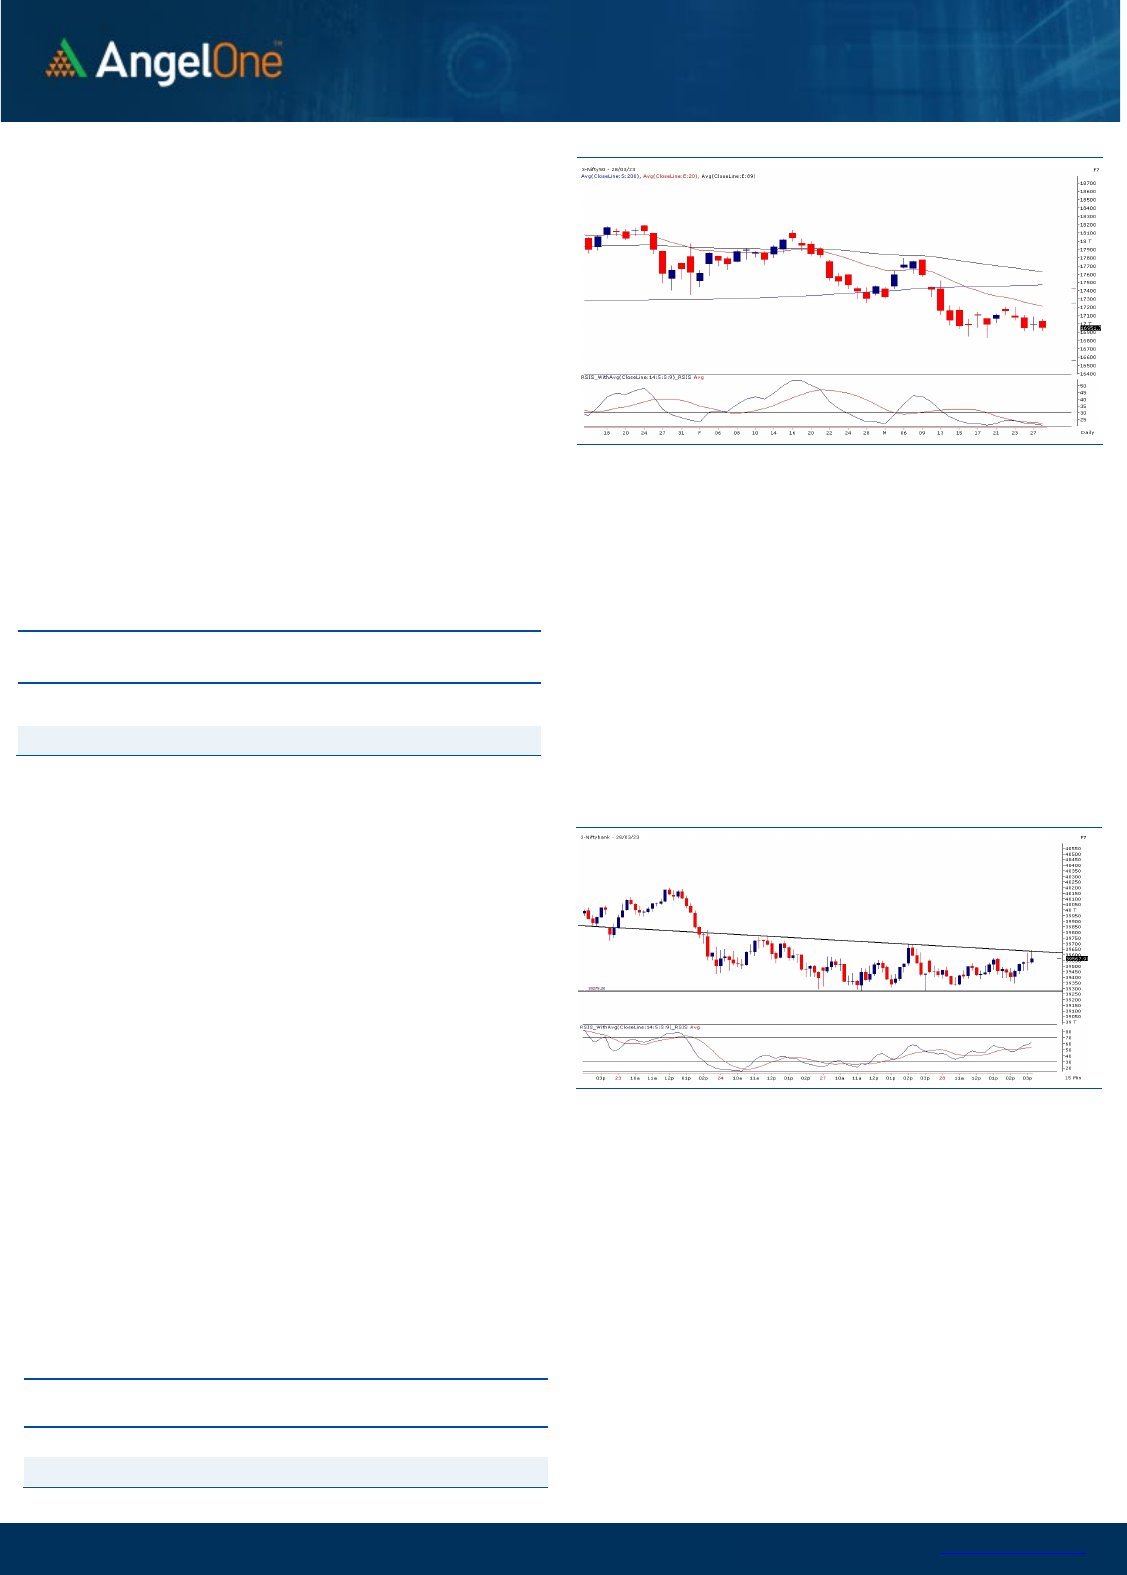
Exhibit 1: Nifty Daily Chart
Exhibit 2: Nifty Bank Intra-day Chart
Sensex (
57
6
1
4
) / Nifty (
169
52
)
The Indian equity market had a lackluster day of trade amid the
absence of buying interest. Despite a positive start, suggested by
the SGX Nifty, bulls lacked the confidence to capitalize on the move
and the benchmark index hustled in a slender range throughout the
day. Amidst the dull day, Nifty corrected 0.20 percent from its
previous day’s close and settled slightly above the 16950 level.
On the technical front, no sign of respite was seen in the index as it
struggled in a tight range. There have been no significant changes in
the chart structure, showcasing the timidity among the market
participants. As far as levels are concerned, 16900 remains the
immediate support, followed by the sacrosanct support of the
16850-16800 zone. While on the higher end, 17100-17200 is likely
to act as the sturdy wall, and an authoritative breach beyond the
same could only trigger some more respite in the comparable
period.
Key Levels
Support 1 – 16850 Resistance 1 – 17100
Support 2 – 16800 Resistance 2 – 17200
Going forward, we would advocate the participants to keep a
close tab on the mentioned levels and avoid undue risk in the
market. Even though the indices are not doing much, sector
churning is visible in the broader market, and hence one should
focus on identifying such potential movers. In the meanwhile,
stay abreast with global developments.

www.angelone.in
Technical & Derivatives Report
March 29, 2023
View
Tuesday, we had a positive start tad above 17000 but
failed to hold on to the gains post opening to drag
index towards 16900. However, on account of some
respite in final hour we settled the day around
16950.
FIIs turned net buyer in the cash market segment to
the tune of Rs. 1513 crores. Simultaneously, in Index
futures, they sold worth Rs. 931 crores with rise in
open interest, indicating short formation.
In the F&O space, we could hardly any fresh build-up
in key indices. Surprisingly, FIIs turned net buyers in
equities but preferred selling index futures segment.
Their index futures Long Short Ratio has slightly
decreased from 17% to 16%. In index options front,
we observed good amount of writing in 17000-17150
call strikes. On the other side, 16800-16900 put
strikes added some build-up but the quantum
remained insignificant. It’s been more than ten
trading session that index has been grinding in a
range of 16800-17250 and until we don’t see any
sustainable move beyond the mentioned range
traders should avoid stay light especially in index and
find opportunities in individual counters.
Comments
The Nifty futures open interest has decreased by 2.07%
and Bank Nifty futures open interest has decreased by
2.43% as the market closed at 16951.70.
The Nifty March future closed with a premium of 18.90
point against a premium of 51.65 point in the last
trading session. The April series closed at a premium of
121.1 point.
The INDIA VIX has decreased from 15.44 to 15.10. At
the same time, the PCR-OI of Nifty has decreased from
0.85 to 0.80.
Few of the liquid counters where we have seen high
cost of carry are ABCAPITAL, HDFCAMC, AARTIIND,
BIOCON and LICHSGFIN.
Historical Volatility
SCRIP HV
GRANULES 41.87
TORNTPOWER 38.76
BANDHANBNK 48.38
ACC 41.13
IEX 43.19
Nifty Vs OI
16600
16800
17000
17200
17400
17600
17800
2,000
4,000
6,000
8,000
10,000
12,000
14,000
16,000
18,000
20,000
3/9 3/13 3/15 3/17 3/21 3/23 3/27
Openinterest Nifty
OI Gainers
SCRIP OI
OI
CHG. (%)
PRICE
PRICE
CHG. (%)
ATUL 169275 12.40 6986.25 0.06
DEEPAKNTR 2303500 10.60 1798.15 0.56
SUNTV 9457500 10.38 397.90 -2.82
WHIRLPOOL 1019550 9.63 1322.15 -0.57
MOTHERSON 83598750 8.75 62.90 -1.95
BHEL 76650000 8.68 70.10 -1.33
IDEA 616490000 6.78 5.90 -2.46
BHARATFORG 8342000 6.54 750.20 -0.95
OI Losers
SCRIP OI
OI
CHG. (%)
PRICE
PRICE
CHG. (%)
FSL 17600 -17.30 107.30 -3.24
MFSL 3610100 -12.89 608.95 -2.20
CROMPTON 5958000 -12.63 295.05 -0.66
OFSS 265000 -11.96 3212.55 -0.50
JKCEMENT 424250 -11.15 2844.85 0.09
M&MFIN 26372000 -10.54 221.40 1.10
TORNTPOWER 2209500 -10.35 511.35 4.58
ASTRAL 2073183 -9.79 1301.30 -1.49
Put-Call Ratio
SCRIP PCR (OI) PCR (VOL)
NIFTY 0.80 0.95
BANKNIFTY 0.91 0.98
RELIANCE 0.63 0.64
ICICIBANK 0.79 0.69
INFY 0.50 0.57
www.angelone.in
Technical & Derivatives Report
March 29, 2023
Note: Above mentioned Bullish or Bearish Spreads in Nifty (March Series) are given as an information and not as a recommendation.
Nifty Spot =
1
6
9
51
.70
0900
Lot Size = 75
FII Statistics for
March
2
8
, 202
3
Detail Buy
Contracts
Open
Interest
Value
(in Cr.)
Sell
Net
CHANGE
INDEX
FUTURES
7673.50
8604.43
(930.93) 229012
20293.93
2.21
INDEX
OPTIONS
1622095.73
1630676.42
(8580.69) 3159989
282587.54
(2.98)
STOCK
FUTURES
41436.68
41584.09
(147.41) 2256740
144136.92
(0.46)
STOCK
OPTIONS
9964.57
10149.69
(185.12) 162539
10183.89
(10.84)
Total 1681170.48
1691014.63
(9844.15) 5808280
457202.28
(2.06)
Turnover
on
March
2
8
, 202
3
Instrument
No. of
Contracts
Turnover
( in Cr. )
Change
(%)
Index
Futures
478236 43375.18 -15.58
Index
Options
297521233
55019.77 -13.73
Stock
Futures
2175360 134403.53
-12.35
Stock
Options
3276265 2350.67 7.39
Total
3,276,265 2350.67 -13.13
Bull-Call Spreads
Action Strike Price Risk Reward BEP
Buy
17000 42.00
29.15
70.85
17029.15
Sell
17100 12.85
Buy
17000 42.00
38.60
161.40
17038.60
Sell
17200 3.40
Buy
17100 12.85
9.45 90.55 17109.45
Sell
17200 3.40
Bear-Put Spreads
Action Strike Price Risk Reward BEP
Buy
16900 30.90
20.25
79.75
16879.75
Sell 16800 10.65
Buy 16900 30.90
27.70
172.30
16872.30
Sell
16700 3.20
Buy
16800 10.65
7.45 92.55 16792.55
Sell 16700 3.20
Nifty Put-Call Analysis
,0
2000,000
4000,000
6000,000
8000,000
10000,000
12000,000
14000,000
16000,000
16400 16500 16600 16700 16800 16900 17000 17100 17200 17300 17400 17500 17600 17700
Call Put

www.angelone.in
Technical & Derivatives Report
March 29, 2023
`
Daily
Pivot Levels for Nifty Constituents
Scrips
S2
S1
PIVOT
R1
R2
ADANIENT
1,476
1,538
1,636
1,698
1,796
ADANIPORTS 541 567
598
624
654
APOLLOHOSP
4,209
4,271
4,307
4,370
4,406
ASIANPAINT
2,741
2,763
2,787
2,808
2,832
AXISBANK 821 827
832
838
843
BAJAJ-AUTO
3,734
3,763
3,798
3,827
3,863
BAJFINANCE
5,459
5,497
5,561
5,598
5,662
BAJAJFINSV
1,196
1,209
1,229
1,242
1,262
BPCL 332 336
339
343
347
BHARTIARTL 729 739
752
762
775
BRITANNIA
4,118
4,159
4,194
4,235
4,271
CIPLA 882 886
890
894
898
COALINDIA 207 208
210
211
212
DIVISLAB
2,740
2,773
2,808
2,842
2,877
DRREDDY
4,451
4,489
4,518
4,556
4,585
EICHERMOT
2,802
2,827
2,861
2,886
2,920
GRASIM
1,578
1,595
1,618
1,635
1,658
HCLTECH
1,024
1,032
1,048
1,057
1,073
HDFCBANK
1,557
1,569
1,576
1,587
1,595
HDFCLIFE
480
485
492
497
503
HDFC
2,551
2,566
2,575
2,589
2,599
HEROMOTOCO
2,205
2,227
2,268
2,290
2,331
HINDALCO 387 390
395
398
403
HINDUNILVR
2,448
2,465
2,489
2,507
2,531
ICICIBANK 843 849
854
860
865
INDUSINDBK 996 1,016
1,027
1,047
1,058
INFY
1,362
1,370
1,384
1,392
1,406
ITC 376 378
380
382
384
JSW STEEL 653 656
660
663
667
KOTAKBANK
1,674
1,686
1,698
1,711
1,722
LT
2,095
2,114
2,142
2,161
2,189
M&M
1,108
1,118
1,134
1,144
1,159
MARUTI
8,019
8,114
8,235
8,330
8,450
NESTLEIND
18,769
18,857
18,939
19,027
19,109
NTPC 169 171
172
173
174
ONGC 144 146
148
149
152
POWERGRID 217 220
221
224
226
RELIANCE
2,228
2,238
2,247
2,257
2,267
SBILIFE
1,077
1,084
1,095
1,103
1,114
SBIN 500 504
508
512
516
SUNPHARMA 971 978
983
989
994
TCS
3,086
3,101
3,125
3,140
3,165
TATACONSUM
686 691
695
700
705
TATAMOTORS 391 397
406
411
420
TATASTEEL 102 102
103
103
103
TECHM
1,042
1,056
1,080
1,095
1,119
TITAN
2,487
2,494
2,500
2,507
2,514
ULTRACEMCO
7,284
7,344
7,428
7,487
7,571
UPL 698 706
711
719
724
WIPRO 350 353
359
362
367

www.angelone.in
Technical & Derivatives Report
March 29, 2023
*
Technical and Derivatives Team:
Sameet Chavan Chief Analyst – Technical & Derivatives sameet.chavan@angelone.in
Sneha Seth Senior Analyst – Technical & Derivatives sneha.seth@angelone.in
Rajesh Bhosale Technical Analyst rajesh.bhosle@angelone.in
Osho Krishan Senior Analyst – Technical & Derivatives osho.krishan@angelone.in
Research Team Tel: 022 – 39357600 Website: www.angelone.in
For Technical Queries E-mail: technicalresearch-cso@angelone.in
For Derivatives Queries E-mail: derivatives.desk@angelone.in
DISCLAIMER
Angel One Limited (hereinafter referred to as “Angel”) is a registered Member of National Stock Exchange of India Limited, Bombay Stock Exchange
Limited and Metropolitan Stock Exchange Limited. It is also registered as a Depository Participant with CDSL and Portfolio Manager and investment
advisor with SEBI. It also has registration with AMFI as a Mutual Fund Distributor. Angel One Limited is a registered entity with SEBI for Research
Analyst in terms of SEBI (Research Analyst) Regulations, 2014 vide registration number INH000000164. Angel or its associates has not been
debarred/ suspended by SEBI or any other regulatory authority for accessing /dealing in securities Market.
This document is solely for the personal information of the recipient, and must not be singularly used as the basis of any investment decision.
Nothing in this document should be construed as investment or financial advice. Each recipient of this document should make such investigations
as they deem necessary to arrive at an independent evaluation of an investment in the securities of the companies referred to in this document
(including the merits and risks involved), and should consult their own advisors to determine the merits and risks of such an investment.
Angel or its associates or research analyst or his relative may have actual/beneficial ownership of 1% or more in the securities of the subject
company at the end of the month immediately preceding the date of publication of the research report. Neither Angel or its associates nor
Research Analysts or his relative has any material conflict of interest at the time of publication of research report.
Angel or its associates might have received any compensation from the companies mentioned in the report during the period preceding twelve
months from the date of this report for services in respect of managing or co-managing public offerings, corporate finance, investment banking or
merchant banking, brokerage services or other advisory service in a merger or specific transaction in the normal course of business. Angel or its
associates did not receive any compensation or other benefits from the companies mentioned in the report or third party in connection with the
research report. Neither Angel nor its research analyst entity has been engaged in market making activity for the subject company.
Reports based on technical and derivative analysis center on studying charts of a stock's price movement, outstanding positions and trading
volume, as opposed to focusing on a company's fundamentals and, as such, may not match with a report on a company's fundamentals. Investors
are advised to refer the Fundamental and Technical Research Reports available on our website to evaluate the contrary view, if any.
The information in this document has been printed on the basis of publicly available information, internal data and other reliable sources believed
to be true, but we do not represent that it is accurate or complete and it should not be relied on as such, as this document is for general guidance
only. Angel One Limited or any of its affiliates/ group companies shall not be in any way responsible for any loss or damage that may arise to any
person from any inadvertent error in the information contained in this report. Angel One Limited has not independently verified all the information
contained within this document. Accordingly, we cannot testify, nor make any representation or warranty, express or implied, to the accuracy,
contents or data contained within this document. While Angel One Limited endeavors to update on a reasonable basis the information discussed
in this material, there may be regulatory, compliance, or other reasons that prevent us from doing so.
This document is being supplied to you solely for your information, and its contents, information or data may not be reproduced, redistributed or
passed on, directly or indirectly.
Neither Angel One Limited, nor its directors, employees or affiliates shall be liable for any loss or damage that may arise from or in connection
with the use of this information. Angel or its associates or Research Analyst or his relative might have financial interest in the subject company.
Research analyst has not served as an officer, director or employee of the subject company.
