OCT 28, 2022
www.angelone.in
Technical & Derivatives Report
xOOOOOOOO
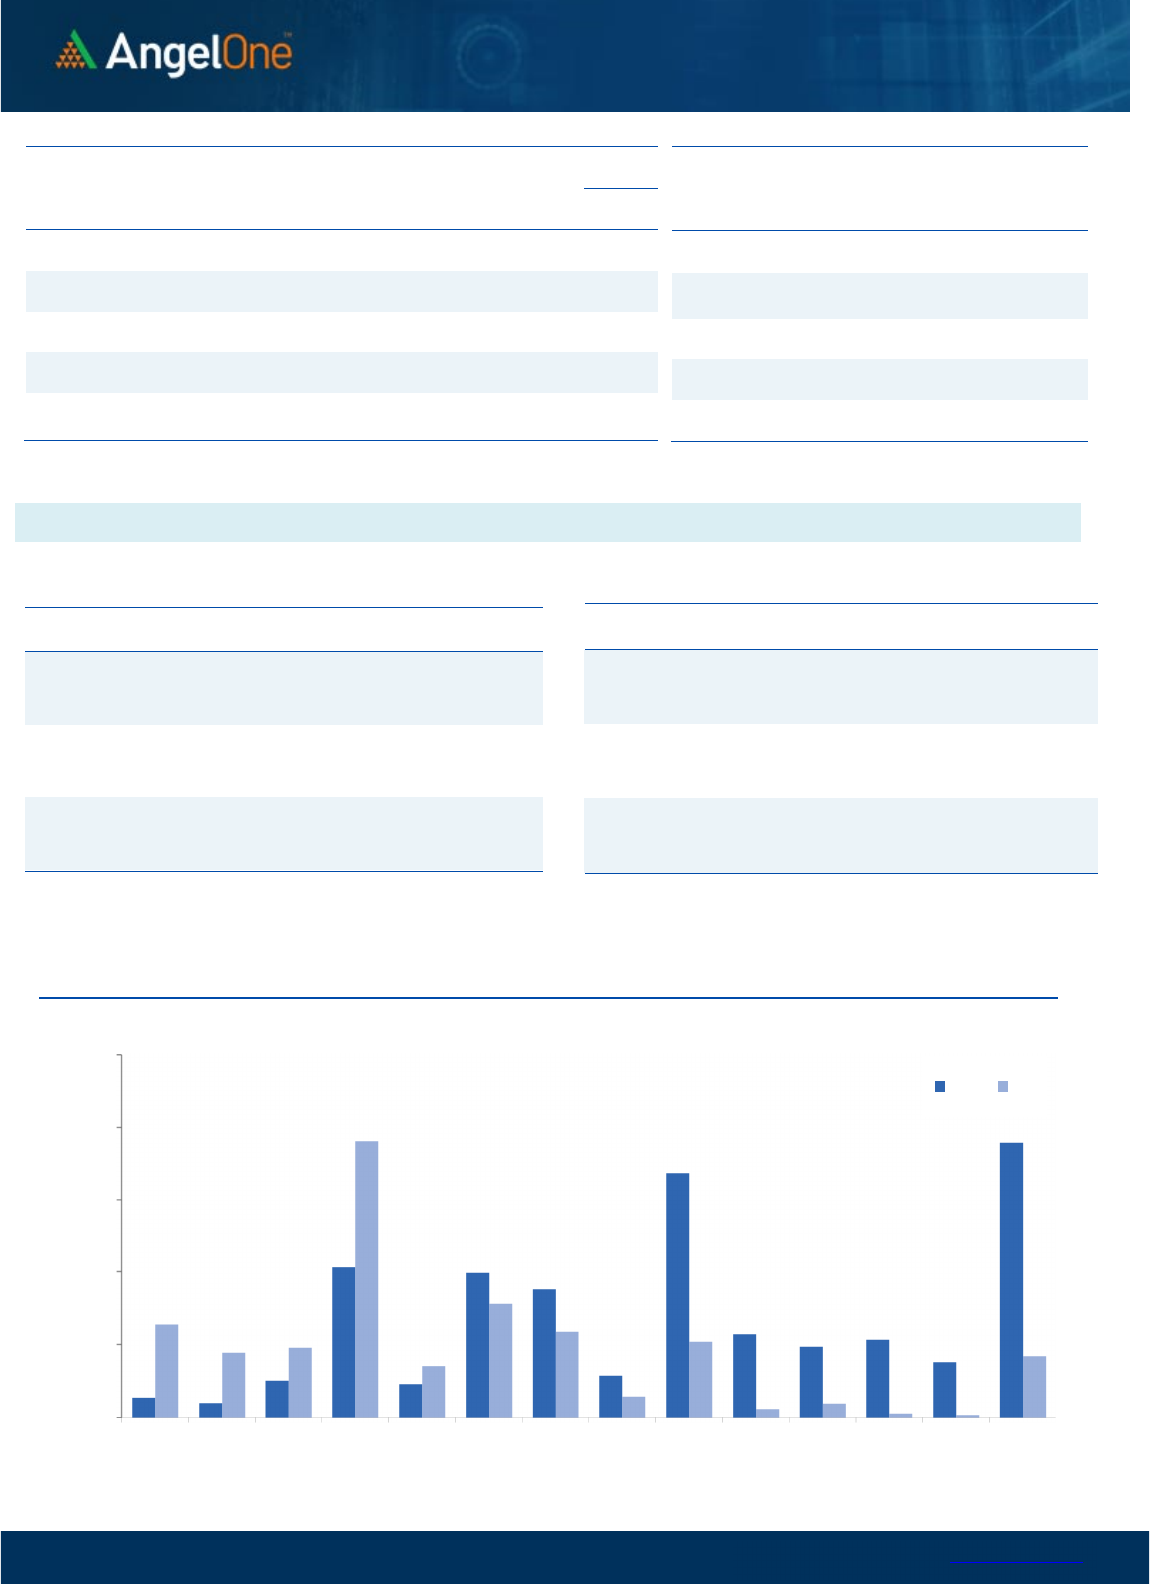
Nifty Bank Outlook (41299)
Yesterday too BANKNIFTY had a pleasant start along with the
benchmark. But once again we failed to capitalise on the early
morning lead. The BANKNIFTY kept sulking throughout the session
as it kept sliding gradually after testing the hurdle around 41500.
Due to some modest recovery towards the end, the BANKNIFTY
managed to close with slightly over four tenths of a percent gains.
It seems the banking index is taking a breather before unfolding the
next leg of the rally to enter the uncharted terrain. Although we
are showing some signs of fatigue at higher levels, we continue to
remain upbeat and expect the momentum to resume soon. As far
as levels are concerned, 41000 - 40700 is likely to provide cushion
to any correction; whereas on the flipside, it would be a challenging
task to surpass the stiff hurdles around 41600 - 41800.
Key Levels
Support 1 – 41000 Resistance 1 – 41600
Support 2 – 40700 Resistance 2 – 41800
Exhibit 1: Nifty
Daily
Chart
Exhibit 2: Nifty Bank
Daily
Chart
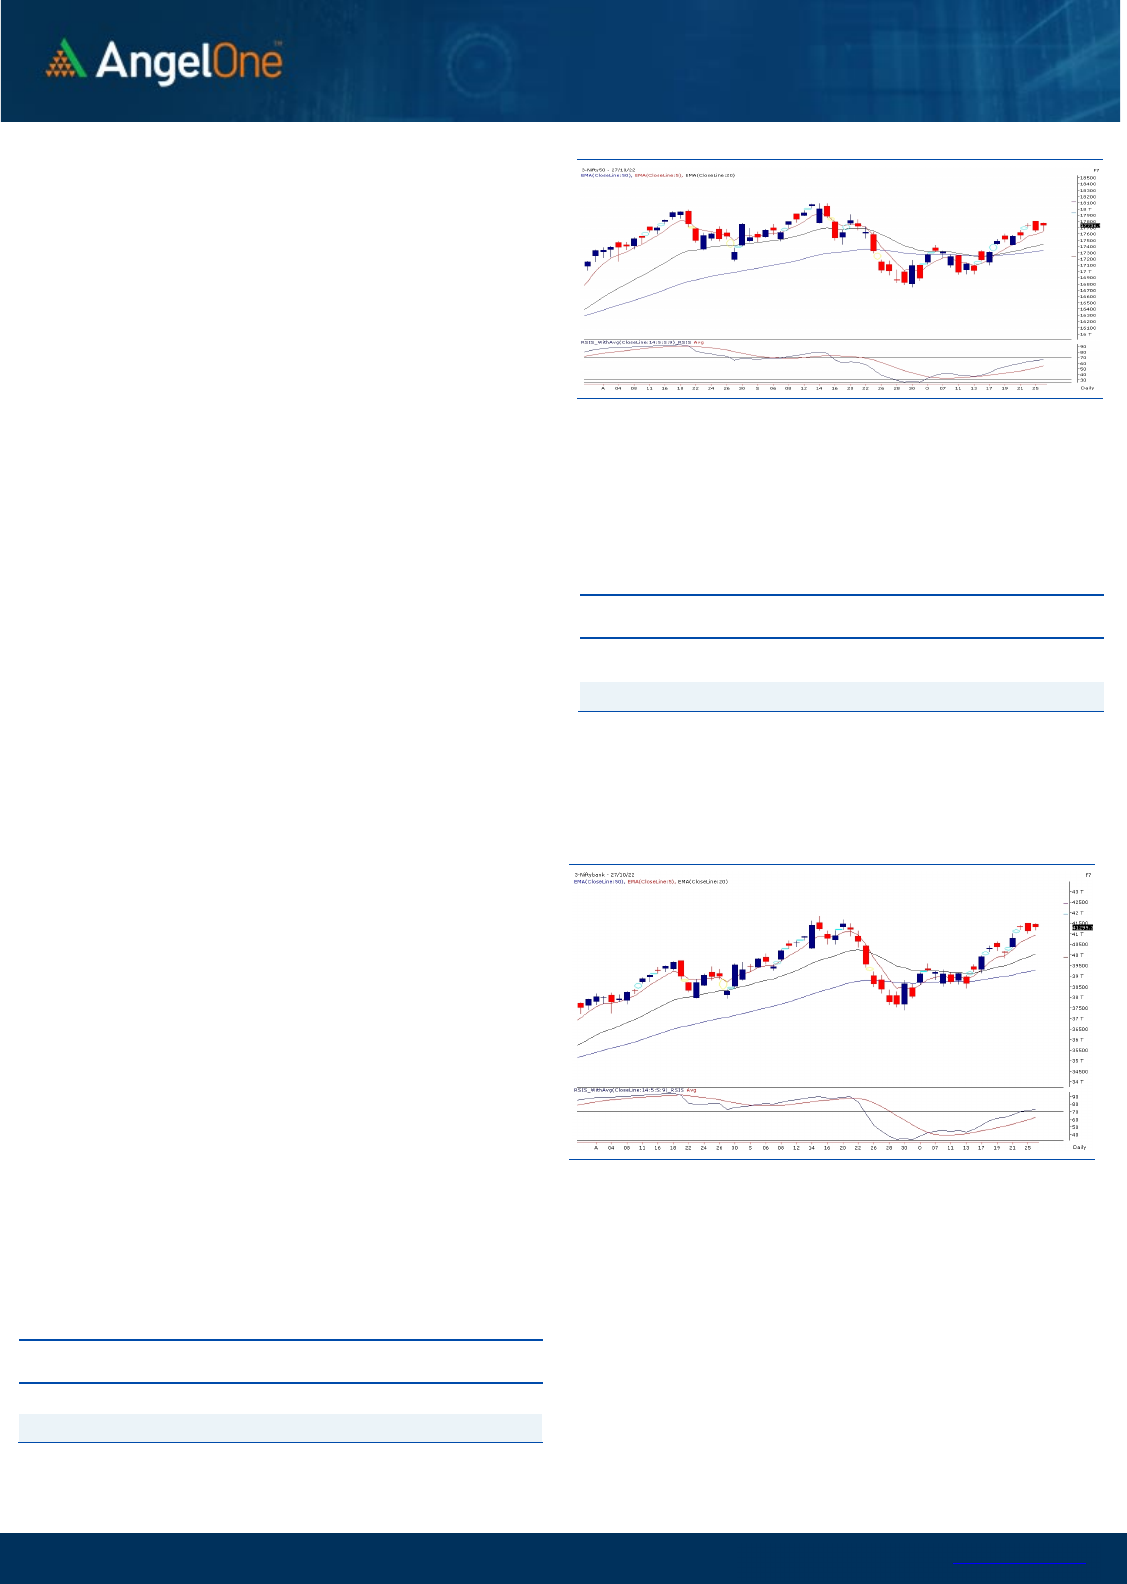
Sensex (59757) / Nifty (17737)
Our market has seen an optimistic start with a decent gap up on the
expiry trade. But soon after, the index gradually descended towards
the 17650 zone until the bulls retaliated from the support zone at
the fag end and pared down the losses to eventually enter inside
the positive terrain. With such a sharp recovery, Nifty managed to
defend 17700 with some authority by adding nearly half a percent
to the previous close.
On the technical perspective, the crucial support of the 17650 was
firmly safeguarded, implying the resilience of the technical support.
However, some tentativeness was evident on the higher grounds as
the index struggled to breach the 17800 zone in the entire week. In
terms of technical levels, any breach above the mentioned
resistance could surge the market toward the 18000 zone in a
comparable period (which we believe should happen anytime
soon). At the same time, on the lower end, the 17650-17600 could
be seen as immediate support, followed by the sacrosanct support
around the 17500 mark.
Going forward, our market is likely to remain upbeat in the near
term, wherein any minor dip could be seen as an opportunity for
the bulls to add long bets. We may expect gradual moves in key
indices, but individual pockets are performing well. Hence, it’s
advisable to keep focusing on such potential movers, which are
likely to provide better trading opportunities.
Key Levels
Support 1 – 17600 Resistance 1 – 17850
Support 2 – 17500 Resistance 2 – 17940

www.angelone.in
Technical & Derivatives Report
OCT 28, 2022
View
On the monthly expiry session, the benchmark index
opened on a strong note around 17750 but failed to
sustain at higher levels to hit intraday lows of 17654.50
in the final hour. Due to sharp recovery in the last
couple of minutes, the index managed to conclude tad
above 17700.
FIIs were net buyers in the cash market segment to
the tune of Rs. 2818 crores. Simultaneously, in Index
futures, they bought worth Rs. 4104 crores with a good
amount of decline in open interest, due to the expiry.
Festive series bought back the optimism and we saw
Nifty and BankNifty rallying 5.46% and 9.70%
respectively. We observed mix of short covering and
long formation in both the indices; however, series on
series we saw open interest reduction. Rollover for
Nifty and BankNifty stood at 76% and 77% respectively,
which is lower than the three-month average.
Interestingly, FIIs covered decent shorts and preferred
rolling over longs formed in October series, which is
indeed a positive development. For now, 17500-17600
is a strong demand zone, whereas, resistance is
placed around 17900-18000 levels.
Comments
The Nifty futures open interest has decreased by
19.85%. and Bank Nifty futures open interest has
decreased by 20.00% as the market closed at
17736.95.
The Nifty November future closed with a premium of
52.25 point against a premium of 32.30 point in the
last trading session. The December series closed at
a premium of 111.05 point.
The INDIA VIX decreased from 16.88 to 16.59. At the
same time, the PCR-OI of Nifty has increased from
0.96 to 1.10.
Few of the liquid counters where we have seen high
cost of carry are IDEA, PETRONET, INDUSTOWER,
FSL and IOC.
Historical Volatility
SCRIP HV
NMDC 49.82
RBLBANK 72.12
GMRINFRA 48.50
JSWSTEEL 45.57
DABUR 27.33
Nifty Vs OI
16400
16600
16800
17000
17200
17400
17600
17800
18000
,0
2,000
4,000
6,000
8,000
10,000
12,000
14,000
16,000
18,000
10/7 10/11 10/13 10/17 10/19 10/21 10/27
Openinterest Nifty
OI Gainers
SCRIP OI
OI
CHG. (%)
PRICE
PRICE
CHG. (%)
CUMMINSIND 3089400 7.29 1250.00 2.62
MPHASIS 2328200 6.65 1969.95 -2.95
PAGEIND 89010 6.19 50870.40 -2.24
LICHSGFIN 14266000 5.19 422.00 0.65
ASTRAL 1486100 3.66 1959.20 -1.22
MFSL 2528500 1.33 677.45 -0.39
BALRAMCHIN 8131200 0.97 332.15 0.09
ASIANPAINT 6323600 0.84 3043.45 -1.24
OI Losers
SCRIP OI
OI
CHG. (%)
PRICE
PRICE
CHG. (%)
NMDC 14190600 -39.43 104.30 13.38
ALKEM 229800 -36.06 3113.90 0.67
AARTIIND 1813050 -28.76 691.65 1.06
PFC 54343000 -27.62 109.90 3.42
POWERGRID 28096200 -27.26 223.90 2.16
TVSMOTOR 5482400 -25.89 1124.55 -2.51
PNB 237376000 -25.36 43.00 -0.23
GMRINFRA 110430000 -25.35 37.60 6.31
Put-Call Ratio
SCRIP PCR (OI) PCR (VOL)
NIFTY 1.10 0.82
BANKNIFTY 0.99 0.94
RELIANCE 0.53 0.52
ICICIBANK 0.59 0.54
INFY 0.76 0.64
www.angelone.in
Technical & Derivatives Report
OCT 28, 2022
Note: Above mentioned Bullish or Bearish Spreads in Nifty (Nov Series) are given as an information and not as a recommendation.
Nifty Spot =
17736.95
FII Statistics for
October
2
7
, 2022
Detail Buy
Contracts
Open
Interest
Value
(in Cr.)
Sell
Net
CHANGE
INDEX
FUTURES
13585.54 9481.47 4104.07
126371 11801.83 (29.65)
INDEX
OPTIONS
2202496.52 2185235.45 17261.07
837408 76416.41 (50.70)
STOCK
FUTURES
29100.24 26543.56 2556.68
2026578 142236.49 (5.86)
STOCK
OPTIONS
5487.76 5327.68 160.08
28675 2237.21 (78.75)
Total 2250670.06
2226588.16
24081.90
3019032
232691.94
(27.53)
Turnover on
October
2
7
, 2022
Instrument
No. of
Contracts
Turnover
( in Cr. )
Change
(%)
Index Futures
640177 60167.07 44.26
Index Options
268585005 45493.71 15.15
Stock
Futures
2263749 158893.42 -11.17
Stock Options
2577233 3060.02 4.41
Total
2,577,233 3060.02 1.75
Bull-Call Spreads
Action Strike Price Risk Reward BEP
Buy
17700 353.15
58.20
41.80
17758.20
Sell
17800 294.95
Buy
17700 353.15
105.05
94.95
17805.05
Sell
17900 248.10
Buy
17800 294.95
46.85 53.15 17846.85
Sell 17900 248.10
Bear
-
Put Spreads
Action Strike Price Risk Reward BEP
Buy 17700 275.35
39.35
60.65
17660.65
Sell
17600 236.00
Buy 17700 275.35
77.70
122.30
17622.30
Sell 17500 197.65
Buy
17600 236.00
38.35 61.65 17561.65
Sell 17500 197.65
Nifty Put
-
Call Analysis
,0
500,000
1000,000
1500,000
2000,000
2500,000
17200 17300 17400 17500 17600 17700 17800 17900 18000 18100 18200 18300 18400 18500
Call Put

www.angelone.in
Technical & Derivatives Report
OCT 28, 2022
`
Daily Pivot Levels for Nifty Constituents
Scrips
S2
S1
PIVOT
R1 R2
ADANIENT 3,268 3,296
3,326
3,354
3,384
ADANIPORTS
784
803
813 832
842
APOLLOHOSP 4,348 4,390
4,445
4,486
4,541
ASIANPAINT
2,976
3,010
3,066
3,100
3,156
AXISBANK
893
904
912
923
931
BAJAJ-AUTO 3,555 3,589
3,640
3,673
3,724
BAJFINANCE 6,758 6,865
7,037
7,144
7,316
BAJAJFINSV
1,587
1,609
1,643
1,665
1,698
BPCL 301 303
305
307
309
BHARTIARTL 797 807
815 825
833
BRITANNIA 3,674 3,714
3,742 3,783
3,811
CIPLA 1,144 1,155
1,167 1,179
1,191
COALINDIA
238
239
241 242
243
DIVISLAB
3,581
3,601
3,618
3,638 3,654
DRREDDY
4,418
4,455
4,487
4,523
4,556
EICHERMOT 3,624 3,667
3,704 3,747
3,784
GRASIM
1,709
1,717
1,729
1,736
1,748
HCLTECH 1,012 1,022
1,030
1,040
1,048
HDFCBANK
1,442
1,448
1,458
1,464
1,474
HDFCLIFE
525
529
534
537
542
HDFC 2,342 2,363
2,384 2,404 2,425
HEROMOTOCO 2,560 2,585
2,603 2,628 2,646
HINDALCO
402
407
410 415
418
HINDUNILVR 2,470 2,495
2,512
2,537
2,554
ICICIBANK
913
919
926
932
940
INDUSINDBK 1,125 1,134
1,144
1,152
1,162
INFY 1,501 1,513
1,524
1,535
1,546
ITC
342
344
346
348 351
JSW STEEL
635
657
670
692
705
KOTAKBANK
1,829
1,847
1,867
1,886
1,906
LT
1,940
1,952
1,962
1,974
1,984
M&M
1,270
1,282
1,291 1,303
1,312
MARUTI 8,832 8,937
9,007 9,112
9,182
NESTLEIND
19,608
19,871
20,173
20,436
20,738
NTPC
166
168
170
172
174
ONGC 130 131
131
133
133
POWERGRID
215
219
222
227
230
RELIANCE
2,415
2,433
2,451
2,469
2,486
SBILIFE
1,233
1,243
1,253
1,263
1,274
SBIN
573
577
581 584
588
SUNPHARMA
985
998
1,006
1,019
1,027
TCS 3,116 3,137
3,155
3,176
3,195
TATACONSUM
750
760
770
780
790
TATAMOTORS
400
404
408
412 416
TATASTEEL
101
103
104 105
106
TECHM
1,049
1,063
1,080
1,094
1,111
TITAN
2,631
2,668
2,716
2,753
2,801
ULTRACEMCO
6,326
6,381
6,428 6,483 6,530
UPL
691
699
704
712
717
WIPRO
378
380
384
386
389

www.angelone.in
Technical & Derivatives Report
OCT 28, 2022
*
Technical and Derivatives Team:
Sameet Chavan Chief Analyst – Technical & Derivatives sameet.chavan@angelone.in
Sneha Seth Senior Analyst – Technical & Derivatives sneha.seth@angelone.in
Rajesh Bhosale Technical Analyst rajesh.bhosle@angelone.in
Osho Krishan Senior Analyst – Technical & Derivatives osho.krishan@angelone.in
Research Team Tel: 022 – 39357600 Website: www.angelone.in
For Technical Queries E-mail: technicalresearch-cso@angelone.in
For Derivatives Queries E-mail: derivatives.desk@angelone.in
DISCLAIMER
Angel One Limited (hereinafter referred to as “Angel”) is a registered Member of National Stock Exchange of India Limited, Bombay
Stock Exchange Limited and Metropolitan Stock Exchange Limited. It is also registered as a Depository Participant with CDSL and
Portfolio Manager and investment advisor with SEBI. It also has registration with AMFI as a Mutual Fund Distributor. Angel One
Limited is a registered entity with SEBI for Research Analyst in terms of SEBI (Research Analyst) Regulations, 2014 vide registration
number INH000000164. Angel or its associates has not been debarred/ suspended by SEBI or any other regulatory authority for
accessing /dealing in securities Market.
This document is solely for the personal information of the recipient, and must not be singularly used as the basis of any investment
decision. Nothing in this document should be construed as investment or financial advice. Each recipient of this document should
make such investigations as they deem necessary to arrive at an independent evaluation of an investment in the securities of the
companies referred to in this document (including the merits and risks involved), and should consult their own advisors to determine
the merits and risks of such an investment.
Angel or its associates or research analyst or his relative may have actual/beneficial ownership of 1% or more in the securities of
the subject company at the end of the month immediately preceding the date of publication of the research report. Neither Angel or
its associates nor Research Analysts or his relative has any material conflict of interest at the time of publication of research report.
Angel or its associates might have received any compensation from the companies mentioned in the report during the period
preceding twelve months from the date of this report for services in respect of managing or co-managing public offerings, corporate
finance, investment banking or merchant banking, brokerage services or other advisory service in a merger or specific transaction
in the normal course of business. Angel or its associates did not receive any compensation or other benefits from the companies
mentioned in the report or third party in connection with the research report. Neither Angel nor its research analyst entity has been
engaged in market making activity for the subject company.
Reports based on technical and derivative analysis center on studying charts of a stock's price movement, outstanding positions and
trading volume, as opposed to focusing on a company's fundamentals and, as such, may not match with a report on a company's
fundamentals. Investors are advised to refer the Fundamental and Technical Research Reports available on our website to evaluate
the contrary view, if any.
The information in this document has been printed on the basis of publicly available information, internal data and other reliable
sources believed to be true, but we do not represent that it is accurate or complete and it should not be relied on as such, as this
document is for general guidance only. Angel One Limited or any of its affiliates/ group companies shall not be in any way responsible
for any loss or damage that may arise to any person from any inadvertent error in the information contained in this report. Angel One
Limited has not independently verified all the information contained within this document. Accordingly, we cannot testify, nor make
any representation or warranty, express or implied, to the accuracy, contents or data contained within this document. While Angel
One Limited endeavors to update on a reasonable basis the information discussed in this material, there may be regulatory,
compliance, or other reasons that prevent us from doing so.
This document is being supplied to you solely for your information, and its contents, information or data may not be reproduced,
redistributed or passed on, directly or indirectly.
Neither Angel One Limited, nor its directors, employees or affiliates shall be liable for any loss or damage that may arise from or in
connection with the use of this information. Angel or its associates or Research Analyst or his relative might have financial interest
in the subject company. Research analyst has not served as an officer, director or employee of the subject company.
