September
2
8
, 2023
www.angelone.in
Technical & Derivatives Report
8
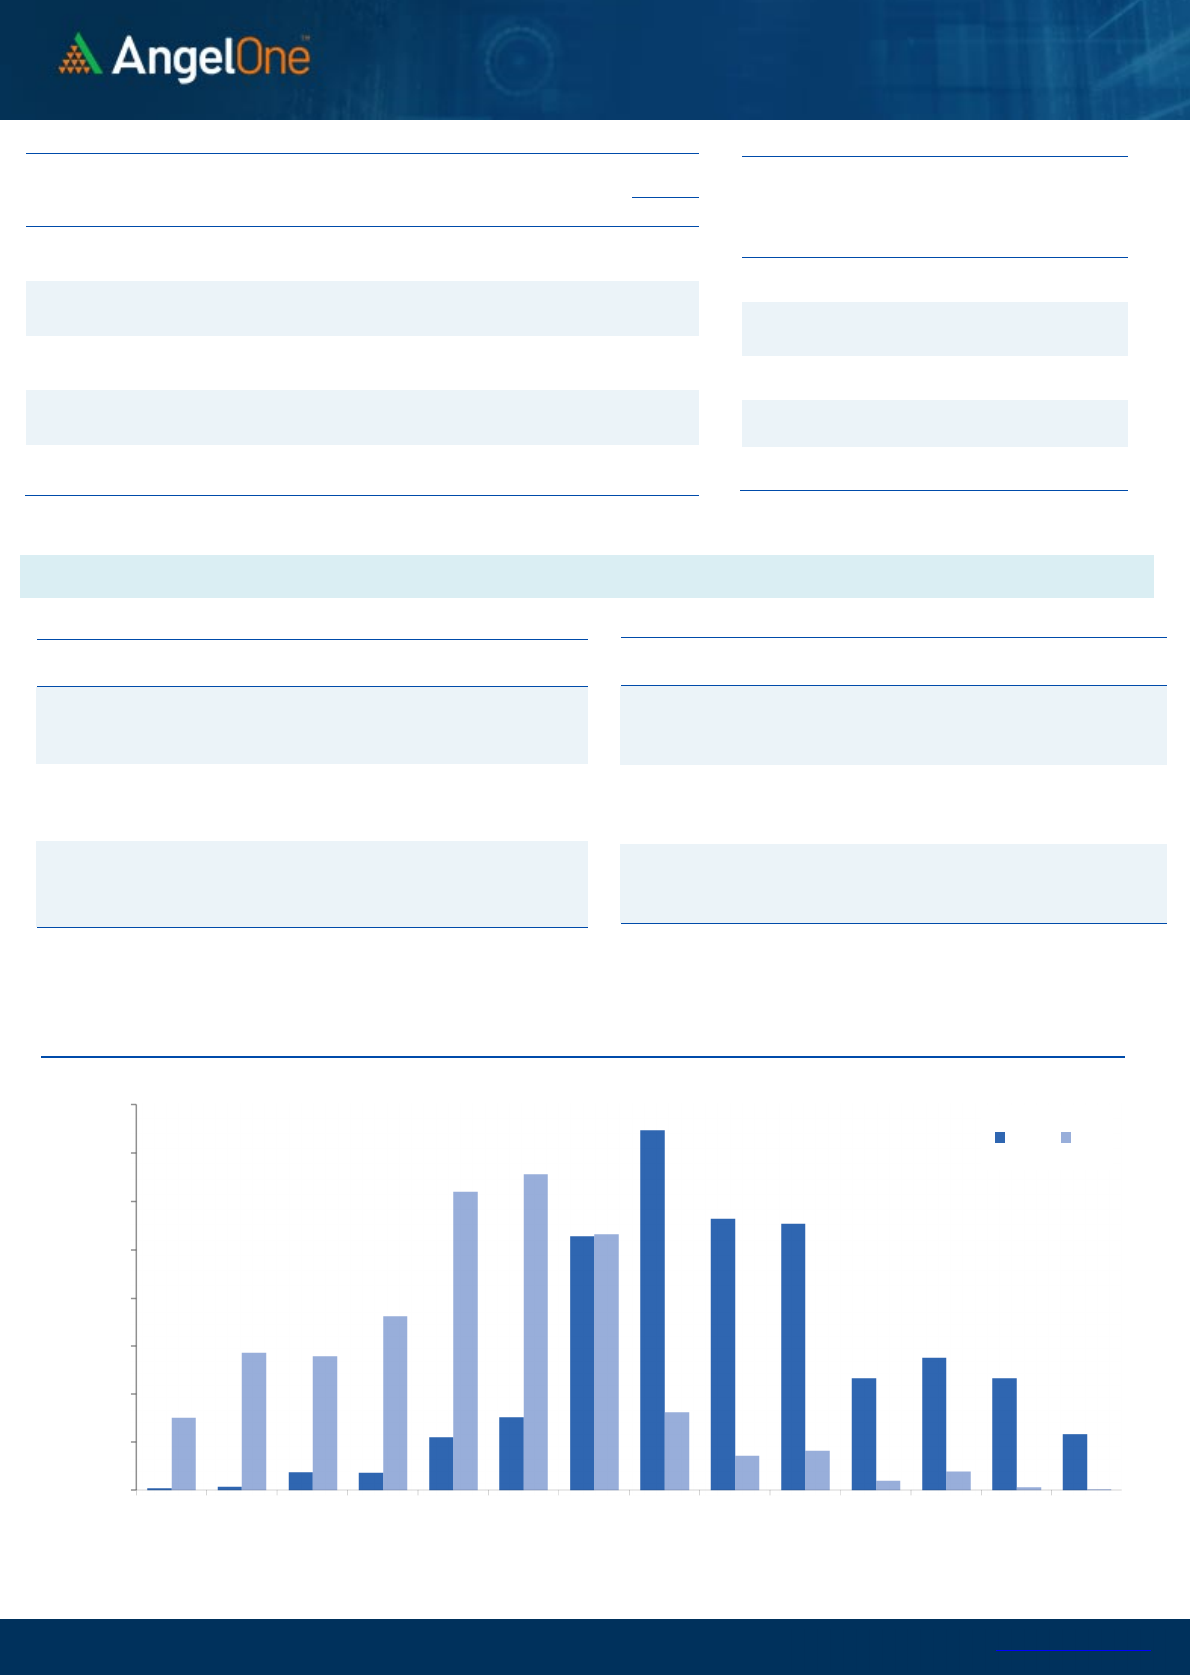
Nifty Bank Outlook (
4
4
588
)
The banking index commenced trading on a nervous note, in tandem
with the benchmark index. During the initial hour of trading, selling
pressure dragged the index below the 44200 mark. Fortunately, the
index soon stabilized, and a smart recovery followed, recouping all the
intraday losses. With some consolidation at the end, we concluded the
day tad below 44600 with a marginal cut.
It indeed turned out to be an interesting session ahead of the monthly
expiry, as the BankNifty breached the immediate support around the
vicinity of 44400 and went lower to test 44200. However, the strong
pullback observed was indeed an encouraging sign. With yesterday's
early morning dips, the range of 44200-44000 has gained more
importance as it precisely coincides with the rising trendline formation
on the daily chart which is likely to act as crucial support moving
forward. Considering yesterday’s price action, it seems we may
experience decent volatility during the monthly expiry session, and we
remain hopeful of gaining momentum beyond the hurdle of 44800-
45000. Therefore, we advise aggressive traders to keep an eye on the
support zone of 44400-44200, and in case of any intraday dip, they
should consider buying ATM call options.
Key Levels
Support 1 – 44400 Resistance 1 – 44800
Support 2 – 44200 Resistance 2 – 45000
Exhibit 1: Nifty Daily Chart
Exhibit 2: Nifty Bank Daily Chart
Sensex (
6
6119
) / Nifty (
19
716
)
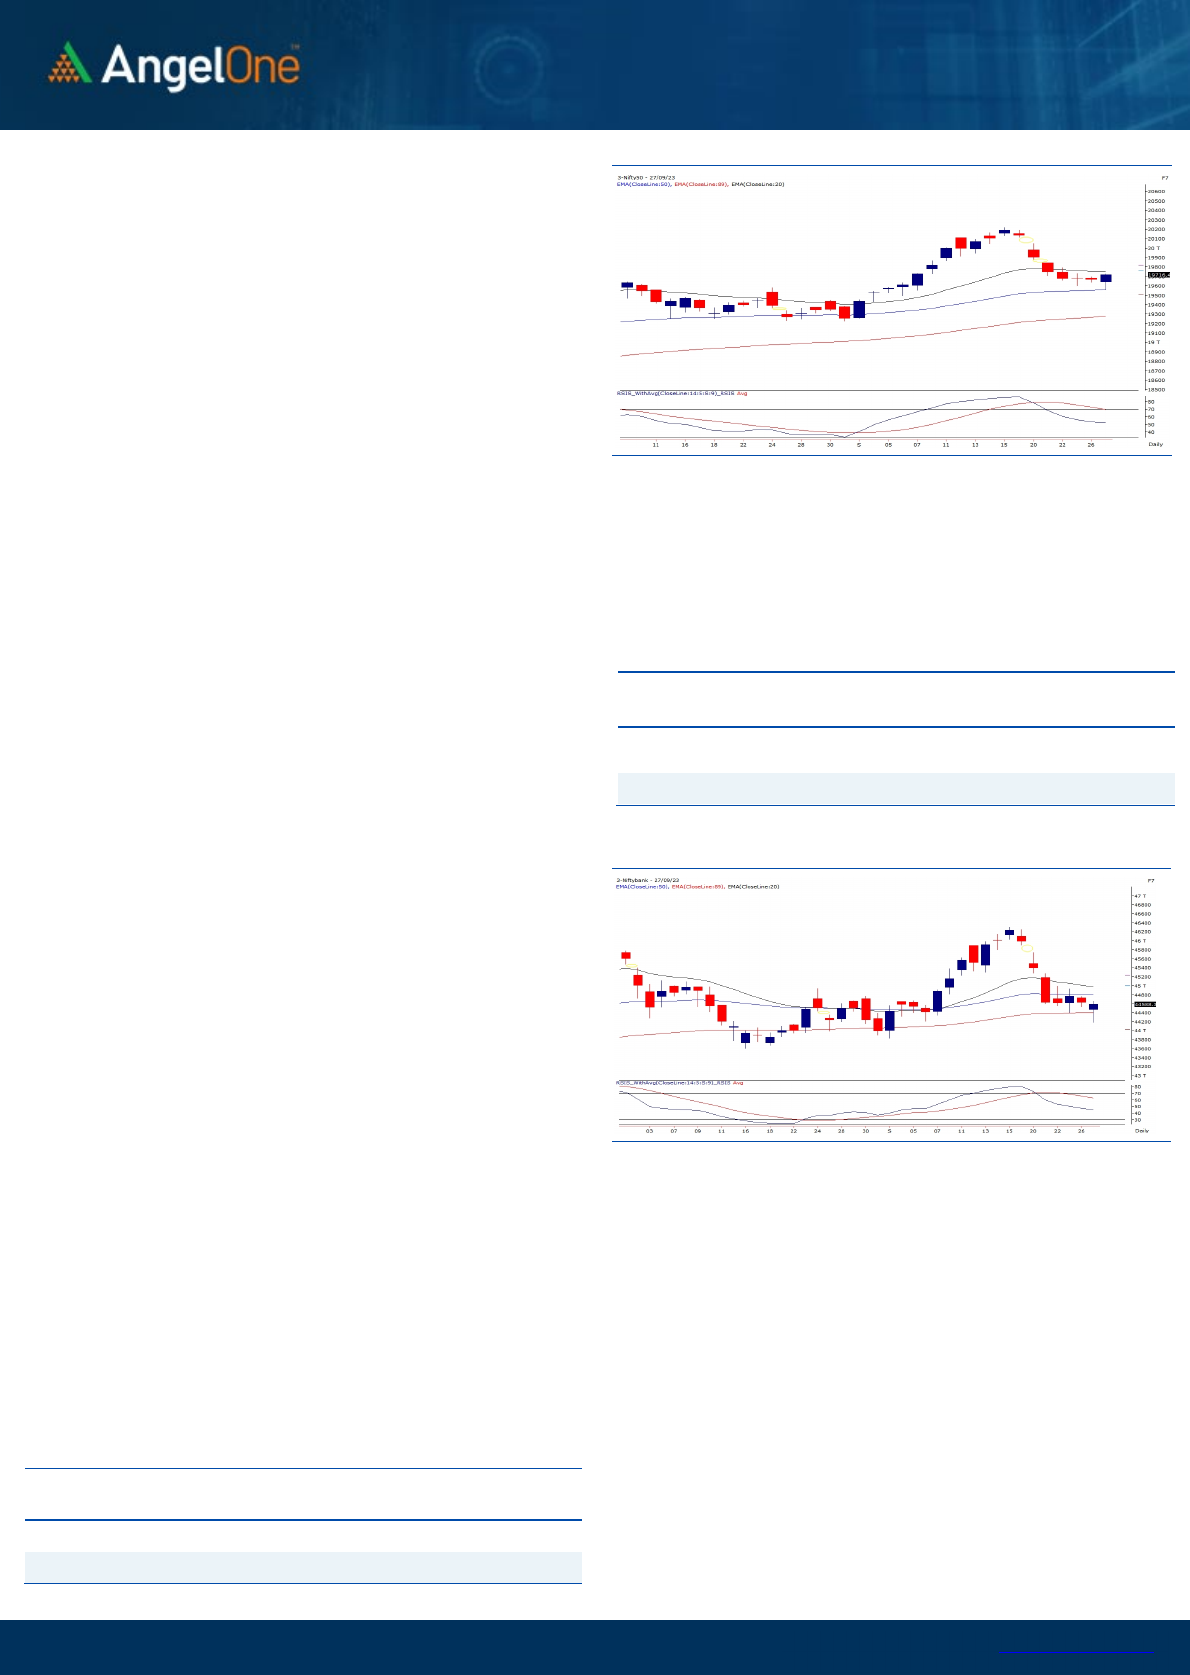
The Nifty benchmark index experienced a sluggish start to the trading
session. As the day unfolded, there was a continuation of this weakness
during the initial hours, with prices testing levels around the 19550
mark. However, this dip presented itself as an attractive buying
opportunity, as a surge of buying activity from there not only helped
recover the morning's losses but also pushed the index to finish with a
0.26% gain, reclaiming the 19700 mark with ease.
While it may appear that there hasn't been a significant change in terms
of price, the robust buying observed from the lower levels is certainly a
positive sign. Looking at the daily chart, we can observe the emergence
of the first bullish candle following last week's market turbulence. This
formation occurred on a strong support level provided by the 50EMA
and the 61.8% retracement level of the recent rally, which bodes well
for the Bulls camp. It is our belief that yesterday's market activity has
established a panic low, and any potential declines toward the 19600 -
19550 range are likely to be met with buying interest. We advise traders
to consider any intra-day blip towards the mentioned levels on the
monthly expiry date as opportunities for buying. On the flip side,
immediate resistance levels can be expected around 19800, followed
by the bearish gap left around 19850 - 19880.
Despite the positive signals, it is important to avoid complacency, as
we are still not out of the woods. It's prudent to take a cautious, step-
by-step approach in such challenging market conditions.
Additionally, within the mid-cap segment, individual stocks have
exhibited strength after the turmoil of the last week, offering the
potential for superior performance. Hence, traders should focus on
specific stock-related opportunities.
Key Levels
Support 1 – 19600 Resistance 1 – 19800
Support 2 – 19550 Resistance 2 – 19880

www.angelone.in
Technical & Derivatives Report
September
2
8
, 2023
View
The Indian equity market witnessed a strong pullback
post a sluggish start, wherein the benchmark index
Nifty50 made a robust recovery from the lows and
settled the day on a positive note above 19700.
FIIs were net sellers in the cash market segment to
the tune of Rs. 354 cr. Simultaneously, they sold
worth Rs. 1189 cr in Index futures with a rise in open
interest, suggesting short formation.
On the derivatives front, we witnessed a mixed bag
of trade in key indices ahead of the expiry session.
On the options front, significant piling of OI is seen at
19700-19600 put strikes, indicating a nearby support
zone. On the other side, the highest OI concentration
stands at 19800 call strike, indicating the
intermediate resistance. Stronger hands continued
their sell-off in the index future, curtailing the ‘Long
Short Ratio’ to 45% from 53% at the start of the
week. Considering the monthly expiry, some
volatility is likely to persist in the market, and it is
advisable to stay cautious with a stock-specific
approach until trends get clear.
Comments
The Nifty futures open interest has increased by 0.91%
and Bank Nifty futures open interest has increased by
2.87% as the market closed at 19716.45.
The Nifty September future closed with a premium of
2.60 points against 12.35 points in the last trading
session. The October series closed at a premium of
112.45 points.
The INDIA VIX has increased from 11.19 to 11.59. At the
same time, the PCR-OI of Nifty has increased from 0.92
to 1.07.
A few of the liquid counters where we have seen high
cost of carry are VEDL, PFC, RECLTD, POLYCAB and
GRANULES.
Historical Volatility
SCRIP HV
BERGEPAINT 29.55
CANBK 42.38
ZYDUSLIFE 28.67
GRANULES 38.52
DRREDDY 24.95
Nifty Vs OI
19200
19400
19600
19800
20000
20200
20400
20600
10,000
10,500
11,000
11,500
12,000
12,500
13,000
9-11 9-13 9-15 9-19 9-25 9-27
Openinterest Nifty
OI Gainers
SCRIP OI
OI
CHG. (%)
PRICE
PRICE
CHG. (%)
ESCORTS 2032525 17.73 3320.10 2.99
MFSL 8224000 11.79 918.95 0.70
GUJGASLTD 12063750 11.14 420.90 -2.64
COLPAL 4029900 9.53 2050.40 -0.98
RECLTD 67296000 9.52 284.35 6.16
BALKRISIND 2136000 9.34 2555.70 0.08
BHEL 96075000 9.23 126.90 2.01
COALINDIA 108637200 9.17 291.55 1.38
OI Losers
SCRIP OI
OI
CHG. (%)
PRICE
PRICE
CHG. (%)
HINDCOPPER 17600 -14.44 159.30 1.85
NAVINFLUOR 599400 -10.88 4444.85 0.24
BALRAMCHIN 10380800 -9.55 445.45 3.15
DELTACORP 16856000 -9.10 140.95 0.32
APOLLOTYRE 12321600 -7.75 376.50 1.44
CHAMBLFERT 12486800 -7.46 279.90 0.21
CANBK 50085000 -7.41 374.25 1.31
INDIAMART 601800 -7.09 2911.10 0.10
Put-Call Ratio
SCRIP PCR (OI) PCR (VOL)
NIFTY 1.07 0.87
BANKNIFTY 0.83 0.95
RELIANCE 0.56 0.41
ICICIBANK 0.40 0.39
INFY 0.45 0.44
www.angelone.in
Technical & Derivatives Report
September
2
8
, 2023
Note: Above mentioned Bullish or Bearish Spreads in Nifty (Sep Series) are given as an information and not as a recommendation.
Nifty Spot =
19
716
.
45
FII Statistics for
September
2
7
, 2023
Detail Buy
Contracts
OI Value
(in Cr.)
Sell Net
CHANGE
INDEX
FUTURES
3439.85 3798.57 (358.72) 191089 16536.80 (2.70)
INDEX
OPTIONS
1691195.07 1721799.75 (30604.68) 4330643 354802.42 (3.45)
STOCK
FUTURES
73895.54 75092.70 (1197.16) 2394160 189739.94 0.29
STOCK
OPTIONS
21254.73 20967.68 287.05
324230 26189.14 (5.14)
Total
1789785.19
1821658.70
(31873.51) 7240122
587268.30
(2.30)
Turnover on
September
2
7
, 2023
Instrument
No. of
Contracts
Turnover
(in Cr.)
Change
(%)
Index Futures
262145 21860.49
-32.28
Index Options
438100947
47837.63
-23.04
Stock Futures
2368986 189708.08
5.96
Stock Options
4507380 3299.37 -15.50
Total
45,07,380
3299.37 -5.29
Bull-Call Spreads
Action Strike Price Risk Reward BEP
Buy
19600 129.55
76.05
23.95
19676.05
Sell
19700 53.50
Buy
19600 129.55
115.10
84.90
19715.10
Sell
19800 14.45
Buy
19700 53.50
39.05 60.95 19736.05
Sell
19800 14.45
Bear-Put Spreads
Action Strike Price Risk Reward BEP
Buy
19800 96.20
60.40
39.60
19739.60
Sell 19700 35.80
Buy 19800 96.20
83.85
116.15
19716.15
Sell
19600 12.35
Buy
19700 35.80
23.45 76.55 19676.55
Sell 19600 12.35
Nifty Put
-
Call Analysis
,0
2000,000
4000,000
6000,000
8000,000
10000,000
12000,000
14000,000
16000,000
19100 19200 19300 19400 19500 19600 19700 19800 19900 20000 20100 20200 20300 20400
Call Put

www.angelone.in
Technical & Derivatives Report
September
2
8
, 2023
`
Daily Pivot Levels for Nifty Constituents
Scrips S2 S1 PIVOT R1 R2
ADANIENT 2,423 2,453 2,475 2,506 2,528
ADANIPORTS 817 824 828 835 840
APOLLOHOSP 4,983 5,044 5,081 5,143 5,180
ASIANPAINT 3,257 3,279 3,294 3,317 3,331
AXISBANK 995 1,010 1,019 1,034 1,043
BAJAJ-AUTO 4,990 5,011 5,040 5,061 5,089
BAJFINANCE 7,700 7,769 7,812 7,881 7,924
BAJAJFINSV 1,548 1,557 1,563 1,572 1,579
BPCL 343 346 350 353 356
BHARTIARTL 903 911 916 925 930
BRITANNIA 4,545 4,586 4,610 4,651 4,675
CIPLA 1,161 1,171 1,180 1,190 1,199
COALINDIA 281 286 290 295 299
DIVISLAB 3,691 3,729 3,794 3,833 3,898
DRREDDY 5,402 5,449 5,527 5,574 5,652
EICHERMOT 3,398 3,439 3,468 3,509 3,538
GRASIM 1,897 1,914 1,940 1,958 1,984
HCLTECH 1,246 1,254 1,261 1,268 1,275
HDFCBANK 1,507 1,517 1,525 1,535 1,542
HDFCLIFE 636 642 646 652 656
HEROMOTOCO 2,979 2,993 3,013 3,027 3,047
HINDALCO 463 469 472 478 482
HINDUNILVR 2,456 2,479 2,492 2,515 2,528
ICICIBANK 929 936 941 948 953
INDUSINDBK 1,411 1,424 1,431 1,444 1,452
INFY 1,443 1,455 1,462 1,474 1,482
ITC 435 442 446 453 457
JSW STEEL 769 774 780 785 791
KOTAKBANK 1,741 1,753 1,762 1,774 1,783
LT 2,874 2,920 2,957 3,003 3,040
LTIMINDTREE 5,350 5,394 5,419 5,463 5,488
M&M 1,574 1,582 1,591 1,598 1,607
MARUTI 10,456 10,569 10,637 10,750 10,818
NESTLEIND 22,609 22,741 22,873 23,005 23,137
NTPC 237 238 239 241 242
ONGC 185 186 188 189 191
POWERGRID 196 198 199 200 201
RELIANCE 2,326 2,348 2,360 2,381 2,393
SBILIFE 1,268 1,285 1,294 1,311 1,320
SBIN 585 587 591 593 597
SUNPHARMA 1,114 1,127 1,136 1,150 1,159
TCS 3,528 3,559 3,586 3,617 3,645
TATACONSUM
876 883 893 900 910
TATAMOTORS 614 617 620 622 625
TATASTEEL 126 127 128 129 130
TECHM 1,252 1,270 1,282 1,300 1,312
TITAN 3,142 3,178 3,223 3,259 3,303
ULTRACEMCO 8,168 8,215 8,253 8,300 8,338
UPL 605 610 614 619 624
WIPRO 408 412 414 418 420

www.angelone.in
Technical & Derivatives Report
September
2
8
, 2023
Technical and Derivatives Team:
Sameet Chavan Head Research – Technical & Derivatives sameet.chavan@angelone.in
Sneha Seth Senior Analyst – Technical & Derivatives sneha.seth@angelone.in
Rajesh Bhosale Analyst - Technical rajesh.bhosle@angelone.in
Osho Krishan Senior Analyst – Technical & Derivatives osho.krishan@angelone.in
Hitesh Rathi Analyst – Technical & Derivatives hitesh.rathi@angelone.in
Research Team Tel: 022 – 39357600 Website: www.angelone.in
For Technical Queries E-mail: technicalresearch-cso@angelone.in
For Derivatives Queries E-mail: derivatives.desk@angelone.in
DISCLAIMER
We, Angel One Limited (hereinafter referred to as “Angel”) a company duly incorporated under the provisions of the Companies Act, 1956 with
its registered office at 601, 6th Floor, Ackruti Star, Central Road, MIDC, Andheri East, Mumbai – 400093, CIN: (L67120MH1996PLC101709) and
duly registered as a member of National Stock Exchange of India Limited, Bombay Stock Exchange Limited, Metropolitan Stock Exchange Limited,
Multi Commodity Exchange of India Ltd and National Commodity & Derivatives Exchange Ltd. Angel One limited is a company engaged in
diversified financial services business including securities broking, DP services, distribution of Mutual Fund products. It is also registered as a
Depository Participant with CDSL and Portfolio Manager and Investment Adviser with SEBI. It also has registration with AMFI as a Mutual Fund
Distributor. Angel One Limited is a registered entity with SEBI for Research Analyst in terms of SEBI (Research Analyst) Regulations, 2014 vide
registration number INH000000164 and also registered with PFRDA as PoP ,Registration No.19092018. Angel Group does not have any joint
ventures or associates. Angel One Limited is the ultimate parent company of the Group. Angel or its associates has not been debarred/ suspended
by SEBI or any other regulatory authority for accessing /dealing in securities Market.
AOL was merged with Angel Global Capital Private Limited and subsequently name of Angel Global Capital Private Limited was changed to Angel
Broking Private Limited (AOL) pursuant to scheme of Amalgamation sanctioned by the Hon'ble High Court of Judicature at Bombay by Orders
passed in Company Petition No 710 of 2011 and the approval granted by the Registrar of Companies. Further, name of Angel Broking Private
Limited again got changed to Angel Broking Limited (AOL) pursuant to fresh certificate of incorporation issued by Registrar of Companies (ROC)
dated June 28, 2018. Further name of Angel Broking name changed to Angel One Ltd pursuant to fresh certificate of incorporation issued by
Registrar of Companies (ROC) dated 23-09-21.
In case of any grievances please write to: support@angelone.in, Compliance Officer Details: Name : Hiren Thakkar, Tel No. –08657864228, Email
id - compliance@angelone.in
Registration granted by SEBI and certification from NISM in no way guarantee performance of the intermediary or provide any assurance of returns
to investors.
This document is solely for the personal information of the recipient, and must not be singularly used as the basis of any investment decision.
Nothing in this document should be construed as investment or financial advice. Each recipient of this document should make such investigations
as they deem necessary to arrive at an independent evaluation of an investment in the securities of the companies referred to in this document
(including the merits and risks involved), and should consult their own advisors to determine the merits and risks of such an investment.
Angel or its associates or research analyst or his relative may have actual/beneficial ownership of 1% or more in the securities of the subject
company at the end of the month immediately preceding the date of publication of the research report. Neither Angel or its associates nor
Research Analysts or his relative has any material conflict of interest at the time of publication of research report.
Angel or its associates might have received any compensation from the companies mentioned in the report during the period preceding twelve
months from the date of this report for services in respect of managing or co-managing public offerings, corporate finance, investment banking or
merchant banking, brokerage services or other advisory service in a merger or specific transaction in the normal course of business. Angel or its
associates did not receive any compensation or other benefits from the companies mentioned in the report or third party in connection with the
research report. Neither research entity nor research analyst has been engaged in market making activity for the subject company.

www.angelone.in
Technical & Derivatives Report
September
2
8
, 2023
*
Reports based on technical and derivative analysis center on studying charts of a stock's price movement, outstanding positions and trading
volume, as opposed to focusing on a company's fundamentals and, as such, may not match with a report on a company's fundamentals. Investors
are advised to refer the Fundamental and Technical Research Reports available on our website to evaluate the contrary view, if any.
The information in this document has been printed on the basis of publicly available information, internal data and other reliable sources believed
to be true, but we do not represent that it is accurate or complete and it should not be relied on as such, as this document is for general guidance
only. Angel One Limited or any of its affiliates/ group companies shall not be in any way responsible for any loss or damage that may arise to any
person from any inadvertent error in the information contained in this report. Angel One Limited does not warrant the accuracy, adequacy or
completeness of the service, information and materials and expressly disclaims liability for errors or omissions in the service, information and
materials. While Angel One Limited endeavours to update on a reasonable basis the information discussed in this material, there may be
regulatory, compliance, or other reasons that prevent us from doing so.
This document is being supplied to you solely for your information, and its contents, information or data may not be reproduced, redistributed or
passed on, directly or indirectly.
Neither Angel One Limited, nor its directors, employees or affiliates shall be liable for any loss or damage that may arise from or in connection
with the use of this information. Angel or its associates or Research Analyst or his relative might have financial interest in the subject company.
Research analyst has not served as an officer, director or employee of the subject company.
Investment in securities market are subject to market risks. Read all the related documents carefully before investing.
Any communication sent to clients on phone numbers or e-mail ids registered with the Trading Member is meant for client consumption and such
material should not be redistributed. Brokerage will not exceed SEBI prescribed limit. Any Information provided by us through any medium based
on our research or that of our affiliates or third parties or other external sources is subject to domestic and international market conditions and
we do not guarantee the availability or otherwise of any securities or other instruments and such Information is merely an estimation of certain
investments, and we have not and shall not be deemed to have assumed any responsibility for any such Information. You should seek independent
professional advice and/or tax advice regarding the suitability of any investment decision whether based on any Information provided by us
through the Site from inhouse research or third party reports or otherwise.
The report and information contained herein is strictly confidential and meant solely for the selected recipient and may not be altered in any way,
transmitted to, copied or distributed, in part or in whole, to any other person or to the media or reproduced in any form, without prior written
consent.
