FEB 28, 2023
www.angelone.in
Technical & Derivatives Report
Nifty Bank
Outlook (
40307
)
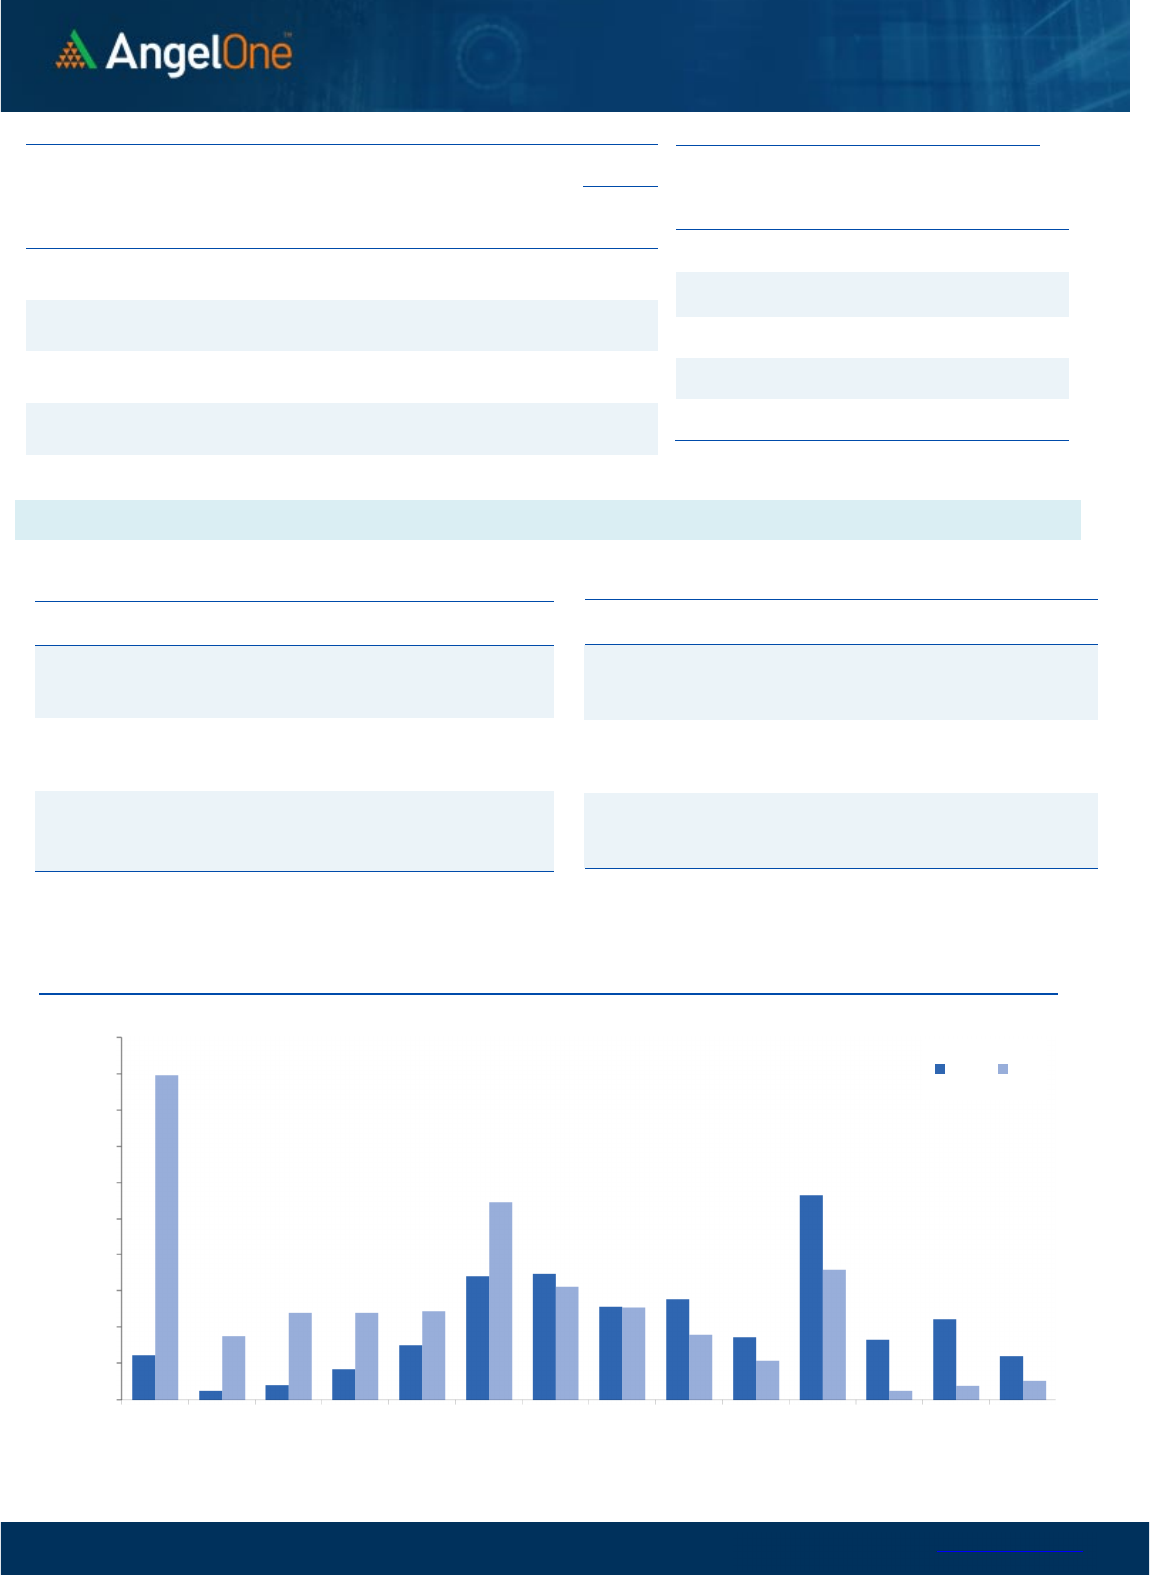
Recent sell off was mainly Financial stocks driven and surprisingly,
this space has started to show some outperformance in last couple
of trading sessions. Yesterday morning, the BANKNIFTY started the
week on a flat note but within few minutes, corrected in tandem
with benchmark index. However later, we witnessed smart
recovery across the banking space, but Nifty remained sluggish due
to non-performance of other heavyweight sectors. The buying
accelerated towards the latter part of the session to conclude with
precisely a percent gain convincingly above the 40000 mark.
Clearly, if banking had not participated yesterday, it could have
been a disaster for our benchmark index and would have certainly
dampened the overall sentiments. Single-handedly, banking pulled
the Nifty higher to defend the ‘200-day SMA’ on a closing basis. For
BANKNIFTY, Thursday’s ‘Dragonfly Doji’ pattern has now been
activated and since it has also closed above ‘5-day EMA’, we expect
the recovery to extend in coming session. As far as levels are
concerned, 40600 – 40900 are the next levels to watch out for,
whereas on the flipside, 40000 – 39700 should act as a strong
support. Any minor decline should ideally be used to create fresh
long positions in the index.
Key Levels
Support 1 – 40000 Resistance 1 – 40600
Support 2 – 39700 Resistance 2 – 40900
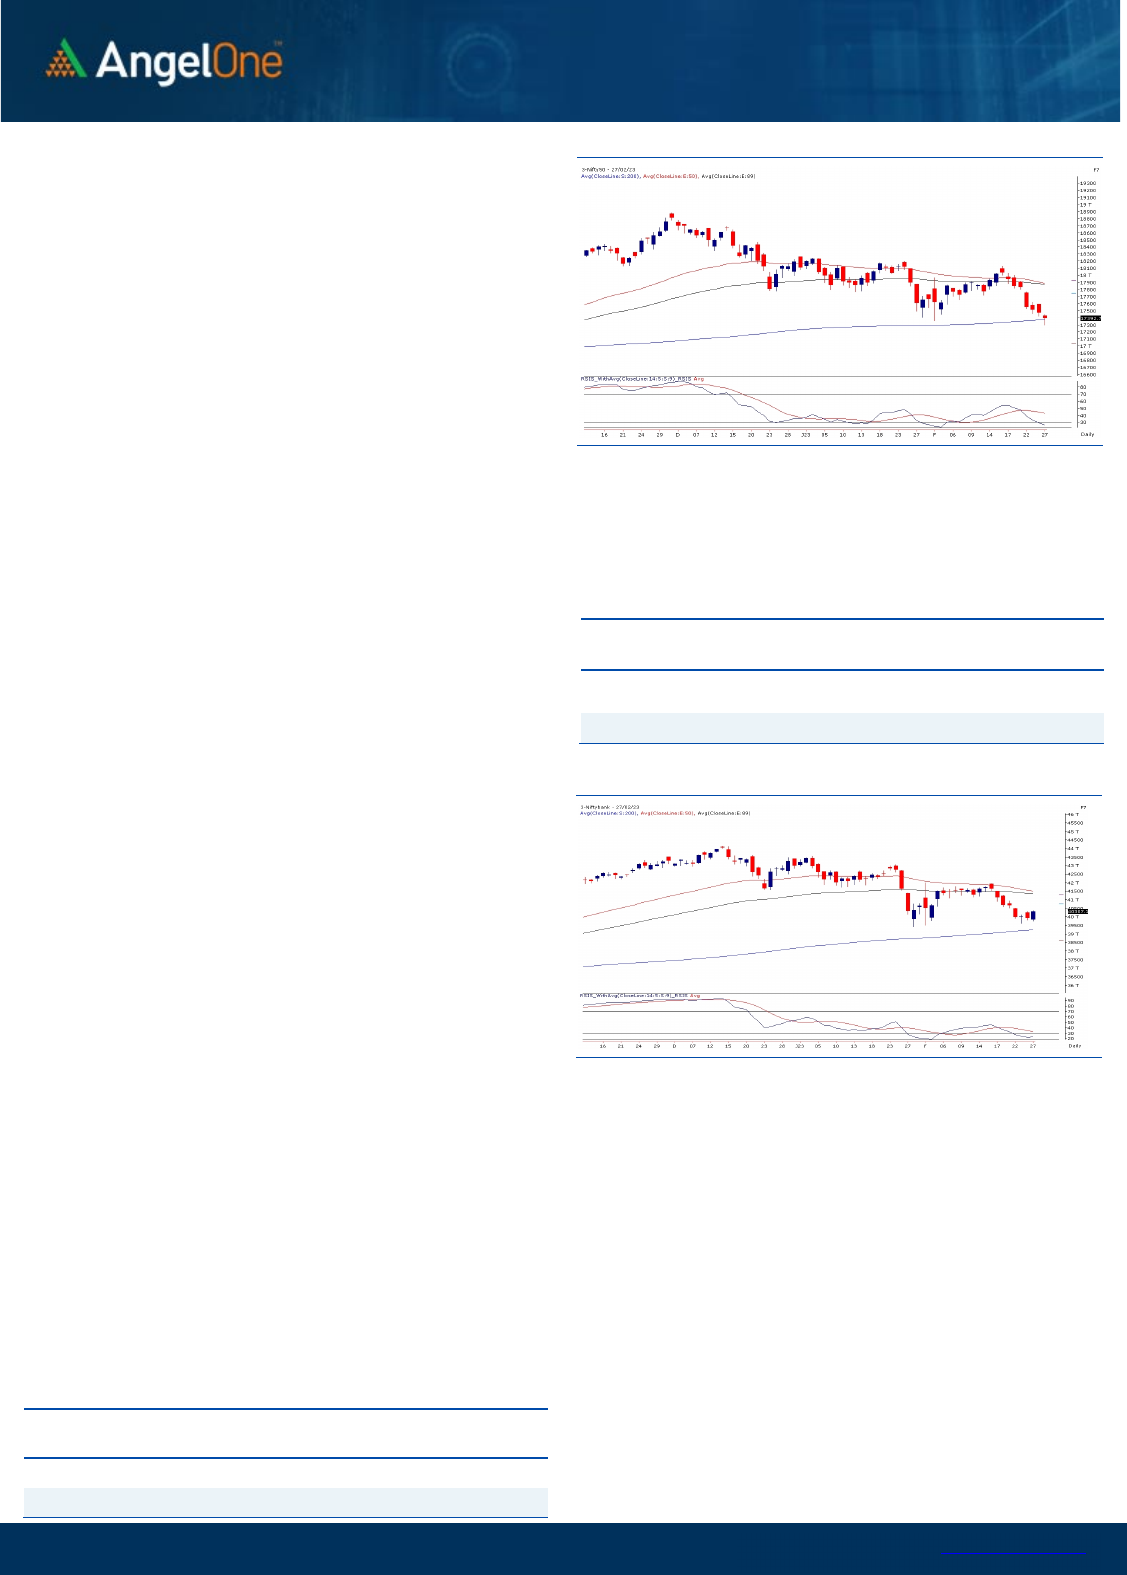
Exhibit 1: Nifty Daily Chart
Exhibit 2: Nifty Bank Daily Chart
Sensex (
59
288
) / Nifty (
1
7
393
)
The weakness in the global markets led to a bleak start for Indian
equities, wherein the benchmark index tested the Budget day’s low
to daunt the market sentiments. However, by the penultimate hour
some buying emergence from the lows led to a modest recovery in
Nifty. With all the hustle, the benchmark index concluded the
seventh consecutive day in red with a cut of 0.42 percent.
Technically, the chart is placed at a critical zone of make or break
and looking at the continuity of the sell-off, one needs to be
prepared for any scenario. However, the formation of the ‘Hammer’
candle on the technical chart that too around 200 SMA could be
seen as a ray of hope for a reversal from the ongoing selling saga. A
follow-up buying with a close above yesterday’s high would
authenticate the trend reversal in the near term. As far as levels are
concerned, any closure below 17350 could drag Nifty toward the
17200-17100 zone in the comparable period. While on the higher
end, the 17550-17600 is likely to be seen as immediate resistance
for the index.
Since the market is highly oversold, one needs to keep a cautious
view and avoid undue risk for the time being. Meanwhile, a close
tab should be kept on global developments, which may lead to
an immediate trend setup, and it is advisable to be very selective
in finding trading opportunities.
Key Levels
Support 1 – 17350 Resistance 1 – 17550
Support 2 – 17200 Resistance 2 – 17600

www.angelone.in
Technical & Derivatives Report
FEB 28, 2023
View
We had a negative start for the week, follow-up
selling dragged index towards 17300. Post some
consolidation in the midst, some buying emerged to
end tad below 17400.
FIIs were net sellers in the cash market segment to
the tune of Rs. 2023 crores. Simultaneously, in Index
futures, they sold worth Rs. 683 crores with some
rise in open interest, indicating short formation.
Yesterday, we saw addition of mixed bet but
considering the price action it seems majority are on
the long side. Stronger hands continue selling streak
not only in equities but also in index futures
segment. In options front, we saw fresh build-up in
17400 call options and considering the high implied
volatility than the puts it clearly suggest these are
long positions. On the other side, 17400 put
witnessed fresh writing. For coming session, any
follow-up buying shall be an encouraging sign for the
market. On the upside, 17600 remains a sturdy
hurdle and any sustainable move beyond same shall
boost the overall sentiments in our market.
Comments
The Nifty futures open interest has increased by 6.68%
and Bank Nifty futures open interest has increased by
14.48% as the market closed at 17392.70.
The Nifty March future closed with a premium of
105.25 point against a premium of 90.45 point in the
last trading session. The April series closed at a
premium of 201.50 point.
The INDIA VIX decreased from 14.18 to 13.87. At the
same time, the PCR-OI of Nifty has decreased from 0.79
to 0.72.
Few of the liquid counters where we have seen high
cost of carry are COALINDIA, AARTIIND, CUB,
RAMCOCEM and CANBK.
Historical Volatility
SCRIP HV
BAJAJ-AUTO 28.40
MPHASIS 41.11
ZEEL 53.49
UPL 37.18
MOTHERSON 45.43
Nifty Vs OI
17400
17500
17600
17700
17800
17900
18000
18100
18200
4,000
6,000
8,000
10,000
12,000
14,000
16,000
2/7 2/9 2/13 2/15 2/17 2/22 2/24
Openinterest Nifty
OI Gainers
SCRIP OI
OI
CHG. (%)
PRICE
PRICE
CHG. (%)
MPHASIS 1910425 18.75 2039.85 -7.25
ESCORTS 1232000 15.29 1981.75 -1.97
GNFC 8899800 8.32 530.55 -3.70
HINDPETRO 23724900 7.38 214.30 -1.28
IGL 7907625 7.31 435.55 -0.71
BOSCHLTD 149050 7.23 17878.55 0.33
PVR 2466827 6.97 1529.35 -4.53
ADANIENT 14730500 6.80 1193.55 -8.94
OI Losers
SCRIP OI
OI
CHG. (%)
PRICE
PRICE
CHG. (%)
ZEEL 66729000 -8.92 182.95 -6.47
TVSMOTOR 5817700 -7.61 1085.20 -2.26
ZYDUSLIFE 7032600 -6.55 456.05 -2.42
AARTIIND 4095300 -5.66 536.75 -0.07
COROMANDEL 1710100 -4.94 891.90 0.52
BAJAJ-AUTO 1194750 -3.94 3639.90 -5.28
TECHM 10289400 -3.62 1113.95 -0.52
MCX 991200 -3.43 1385.20 1.22
Put-Call Ratio
SCRIP PCR (OI) PCR (VOL)
NIFTY 0.72 0.86
BANKNIFTY 1.04 0.96
RELIANCE 0.68 0.51
ICICIBANK 0.80 0.51
INFY 0.58 0.50
www.angelone.in
Technical & Derivatives Report
FEB 28, 2023
Note: Above mentioned Bullish or Bearish Spreads in Nifty (March Series) are given as an information and not as a recommendation.
Nifty Spot =
1
7
392.70
0900
Lot Size = 75
FII Statistics for
February
2
7
, 202
3
Detail Buy
Contracts
Open
Interest
Value
(in Cr.)
Sell
Net
CHANGE
INDEX
FUTURES
3927.37
4610.04
(682.67) 178537
16184.89
5.92
INDEX
OPTIONS
1214761.87
1207172.76
7589.11
2501444
224628.90
15.52
STOCK
FUTURES
9853.68
9529.85
323.83
2181530
141019.08
0.91
STOCK
OPTIONS
8436.03
8593.28
(157.25) 85109
5550.80
22.45
Total 1236978.95
1229905.93
7073.02
4946620
387383.67
8.35
Turnover
on
February
2
7
, 202
3
Instrumen
t
No. of
Contracts
Turnover
( in Cr. )
Change
(%)
Index Futures
374863
35251.75 -4.75
Index Options
1688718
31
54232.39 14.28
Stock Futures
691677
44016.40 11.11
Stock Options
2214971
2844.48 -1.63
Total
2,214,97
1
2844.48 7.38
Bull-Call Spreads
Action Strike Price Risk Reward BEP
Buy
17500 291.65
57.70
42.30
17557.70
Sell
17600 233.95
Buy
17500 291.65
109.25
90.75
17609.25
Sell
17700 182.40
Buy
17600 233.95
51.55 48.45 17651.55
Sell
17700 182.40
Bear-Put Spreads
Action Strike Price Risk Reward BEP
Buy
17500 201.30
36.10
63.90
17463.90
Sell 17400 165.20
Buy 17500 201.30
67.60
132.40
17432.40
Sell
17300 133.70
Buy
17400 165.20
31.50 68.50 17368.50
Sell 17300 133.70
Nifty Put-Call Analysis
,0
500,000
1000,000
1500,000
2000,000
2500,000
3000,000
3500,000
4000,000
4500,000
5000,000
17000 17100 17200 17300 17400 17500 17600 17700 17800 17900 18000 18100 18200 18300
Call Put

www.angelone.in
Technical & Derivatives Report
FEB 28, 2023
`
Daily
Pivot Levels for Nifty Constituents
Scrips
S2
S1
PIVOT
R1
R2
ADANIENT
1,030
1,112
1,213
1,295
1,396
ADANIPORTS 544 553
562
572
581
APOLLOHOSP
4,370
4,405
4,450
4,485
4,530
ASIANPAINT
2,711
2,730
2,745
2,764
2,778
AXISBANK 840 847
853
860
865
BAJAJ-AUTO
3,515
3,577
3,689
3,751
3,863
BAJFINANCE
6,084
6,139
6,190
6,245
6,296
BAJAJFINSV
1,334
1,346
1,357
1,368
1,379
BPCL 312 316
319
323
325
BHARTIARTL 733 743
749
759
765
BRITANNIA
4,316
4,352
4,411
4,447
4,506
CIPLA 936 943
956
963
976
COALINDIA 214 215
217
218
220
DIVISLAB
2,802
2,830
2,874
2,902
2,946
DRREDDY
4,286
4,354
4,422
4,490
4,558
EICHERMOT
3,043
3,087
3,146
3,190
3,250
GRASIM
1,539
1,555
1,570
1,586
1,601
HCLTECH
1,069
1,077
1,083
1,091
1,097
HDFCBANK
1,568
1,580
1,590
1,602
1,611
HDFCLIFE
473
481
486
494
499
HDFC
2,540
2,566
2,584
2,610
2,628
HEROMOTOCO
2,394
2,416
2,452
2,474
2,510
HINDALCO 396 404
409
417
423
HINDUNILVR
2,439
2,454
2,470
2,485
2,501
ICICIBANK 825 841
849
865
874
INDUSINDBK
1,057
1,069
1,080
1,092
1,102
INFY
1,479
1,494
1,517
1,532
1,555
ITC 374 378
382
387
391
JSW STEEL 658 669
677
688
696
KOTAKBANK
1,677
1,701
1,716
1,740
1,755
LT
2,054
2,084
2,112
2,142
2,170
M&M
1,227
1,242
1,264
1,279
1,301
MARUTI
8,489
8,560
8,602
8,674
8,715
NESTLEIND
18,300
18,462
18,653
18,815
19,006
NTPC 169 171
172
174
175
ONGC 152 153
155
157
158
POWERGRID 213 216
218
221
223
RELIANCE
2,332
2,350
2,370
2,388
2,408
SBILIFE
1,100
1,115
1,125
1,139
1,149
SBIN 515 521
526
532
536
SUNPHARMA 953 959
966
972
978
TCS
3,272
3,302
3,346
3,376
3,420
TATACONSUM
690 700
710
721
731
TATAMOTORS 405 411
420
426
435
TATASTEEL 102 104
107
109
112
TECHM
1,088
1,101
1,110
1,123
1,131
TITAN
2,357
2,379
2,396
2,417
2,434
ULTRACEMCO
7,087
7,137
7,186
7,236
7,285
UPL 683 696
717
730
751
WIPRO 382 386
390
394
398

www.angelone.in
Technical & Derivatives Report
FEB 28, 2023
*
Technical and Derivatives Team:
Sameet Chavan Chief Analyst – Technical & Derivatives sameet.chavan@angelone.in
Sneha Seth Senior Analyst – Technical & Derivatives sneha.seth@angelone.in
Rajesh Bhosale Technical Analyst rajesh.bhosle@angelone.in
Osho Krishan Senior Analyst – Technical & Derivatives osho.krishan@angelone.in
Research Team Tel: 022 – 39357600 Website: www.angelone.in
For Technical Queries E-mail: technicalresearch-cso@angelone.in
For Derivatives Queries E-mail: derivatives.desk@angelone.in
DISCLAIMER
Angel One Limited (hereinafter referred to as “Angel”) is a registered Member of National Stock Exchange of India Limited, Bombay Stock Exchange
Limited and Metropolitan Stock Exchange Limited. It is also registered as a Depository Participant with CDSL and Portfolio Manager and investment
advisor with SEBI. It also has registration with AMFI as a Mutual Fund Distributor. Angel One Limited is a registered entity with SEBI for Research
Analyst in terms of SEBI (Research Analyst) Regulations, 2014 vide registration number INH000000164. Angel or its associates has not been
debarred/ suspended by SEBI or any other regulatory authority for accessing /dealing in securities Market.
This document is solely for the personal information of the recipient, and must not be singularly used as the basis of any investment decision.
Nothing in this document should be construed as investment or financial advice. Each recipient of this document should make such investigations
as they deem necessary to arrive at an independent evaluation of an investment in the securities of the companies referred to in this document
(including the merits and risks involved), and should consult their own advisors to determine the merits and risks of such an investment.
Angel or its associates or research analyst or his relative may have actual/beneficial ownership of 1% or more in the securities of the subject
company at the end of the month immediately preceding the date of publication of the research report. Neither Angel or its associates nor
Research Analysts or his relative has any material conflict of interest at the time of publication of research report.
Angel or its associates might have received any compensation from the companies mentioned in the report during the period preceding twelve
months from the date of this report for services in respect of managing or co-managing public offerings, corporate finance, investment banking or
merchant banking, brokerage services or other advisory service in a merger or specific transaction in the normal course of business. Angel or its
associates did not receive any compensation or other benefits from the companies mentioned in the report or third party in connection with the
research report. Neither Angel nor its research analyst entity has been engaged in market making activity for the subject company.
Reports based on technical and derivative analysis center on studying charts of a stock's price movement, outstanding positions and trading
volume, as opposed to focusing on a company's fundamentals and, as such, may not match with a report on a company's fundamentals. Investors
are advised to refer the Fundamental and Technical Research Reports available on our website to evaluate the contrary view, if any.
The information in this document has been printed on the basis of publicly available information, internal data and other reliable sources believed
to be true, but we do not represent that it is accurate or complete and it should not be relied on as such, as this document is for general guidance
only. Angel One Limited or any of its affiliates/ group companies shall not be in any way responsible for any loss or damage that may arise to any
person from any inadvertent error in the information contained in this report. Angel One Limited has not independently verified all the information
contained within this document. Accordingly, we cannot testify, nor make any representation or warranty, express or implied, to the accuracy,
contents or data contained within this document. While Angel One Limited endeavors to update on a reasonable basis the information discussed
in this material, there may be regulatory, compliance, or other reasons that prevent us from doing so.
This document is being supplied to you solely for your information, and its contents, information or data may not be reproduced, redistributed or
passed on, directly or indirectly.
Neither Angel One Limited, nor its directors, employees or affiliates shall be liable for any loss or damage that may arise from or in connection
with the use of this information. Angel or its associates or Research Analyst or his relative might have financial interest in the subject company.
Research analyst has not served as an officer, director or employee of the subject company.
