October
2
7
, 2023
www.angelone.in
Technical & Derivatives Report
8
Nifty Bank Outlook (
4
2
289
)
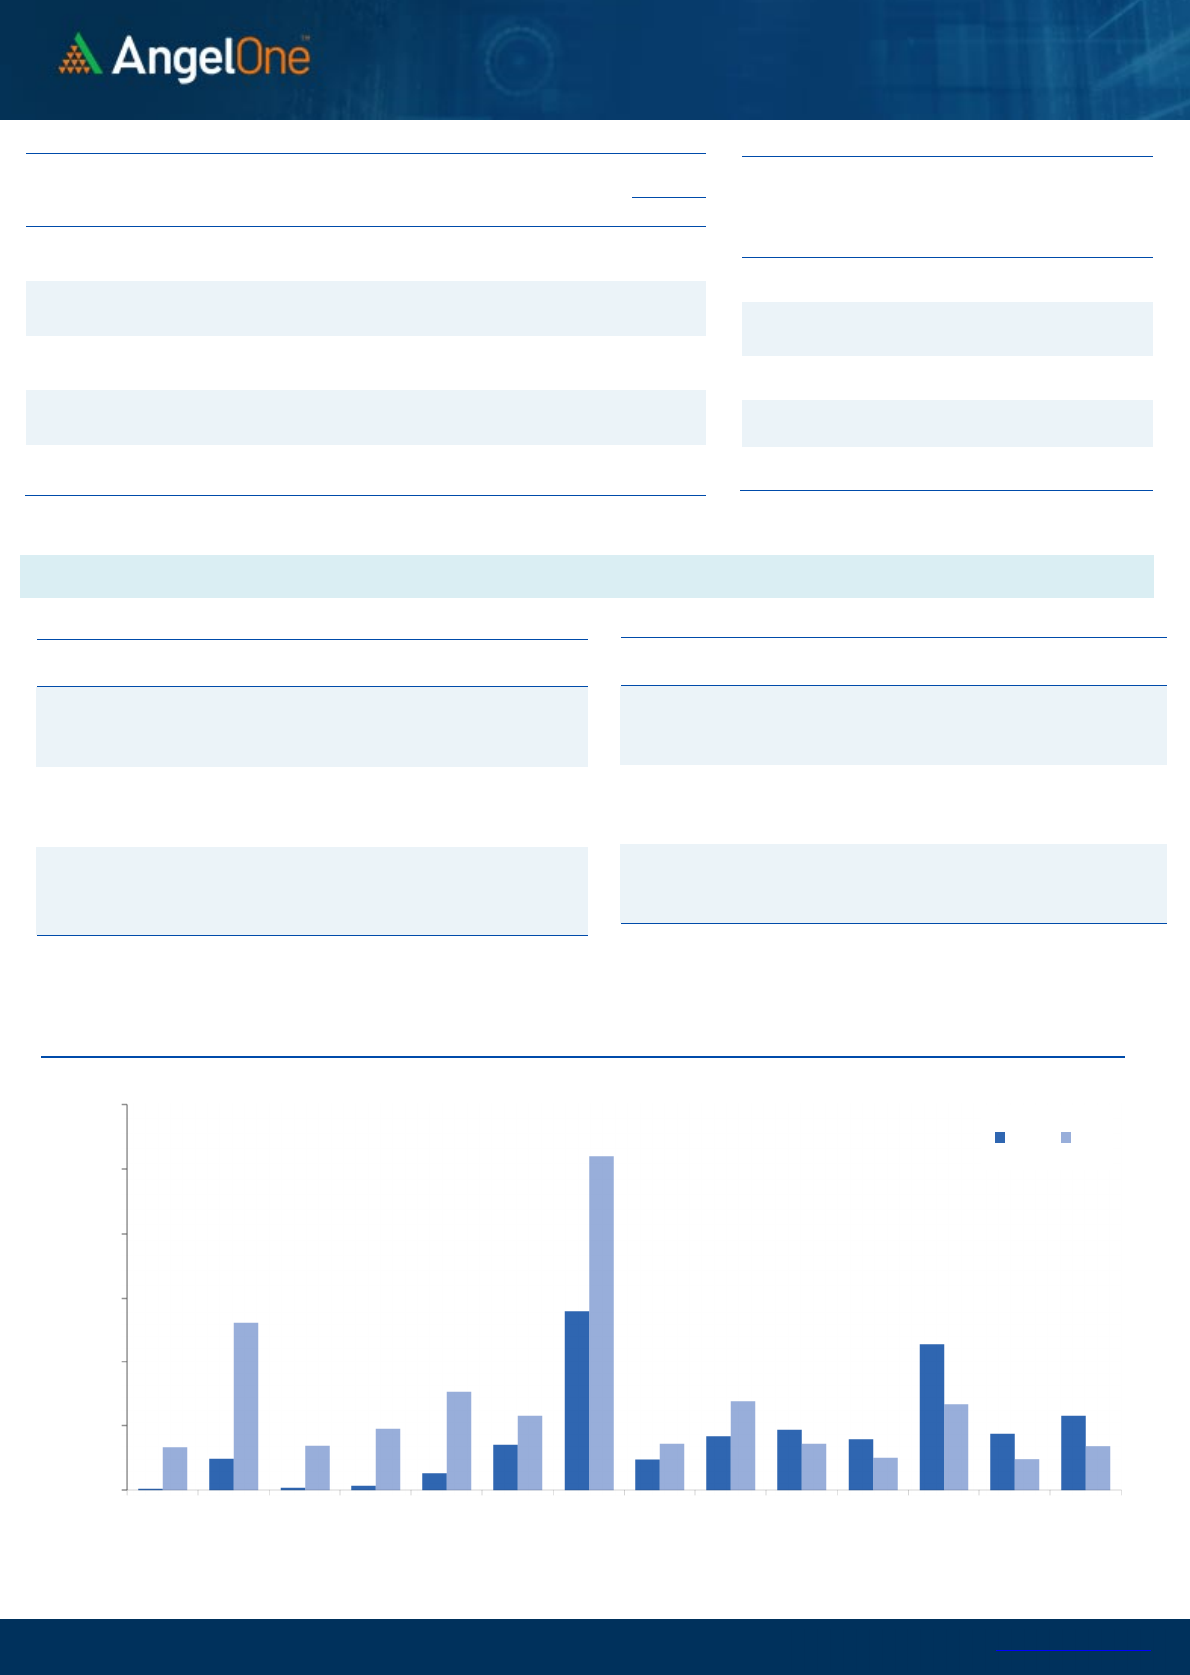
The monthly expiry session began tentatively followed by sharp selling
in the first thirty minutes that dragged bank index towards 42100.
Fortunately, the selling pressure simmered down a bit as the day
progressed, and the index consolidated without any significant signs
of short covering. In the end, we closed the third consecutive day in
the red with a cut of 1.29% tad below 42300. In line with our
expectations, the October series expiry session was heavily dominated
by bears. However at one point it appeared as we would see small
recovery, but it didn't happen mainly due to monthly expiry activity.
From a technical perspective, the sell-off has pulled the index below
its 50% retracement level of the March-September up move and all
significant moving averages on the daily chart. The market appears
clearly oversold and since we have precisely reached the 100% 'Price
Extension' of the down move from 46310.40 to 43796.75. In terms
intraday recovery, 42450 - 42650 are to be seen as immediate hurdles;
whereas the major hurdle is visible around the 43000 mark. On the
downside, the support zones are at 42100 followed by 41900 are likely
to provide cushion in the coming session.
Key Levels
Support 1 – 42100 Resistance 1 – 42450
Support 2 – 41900 Resistance 2 – 42650
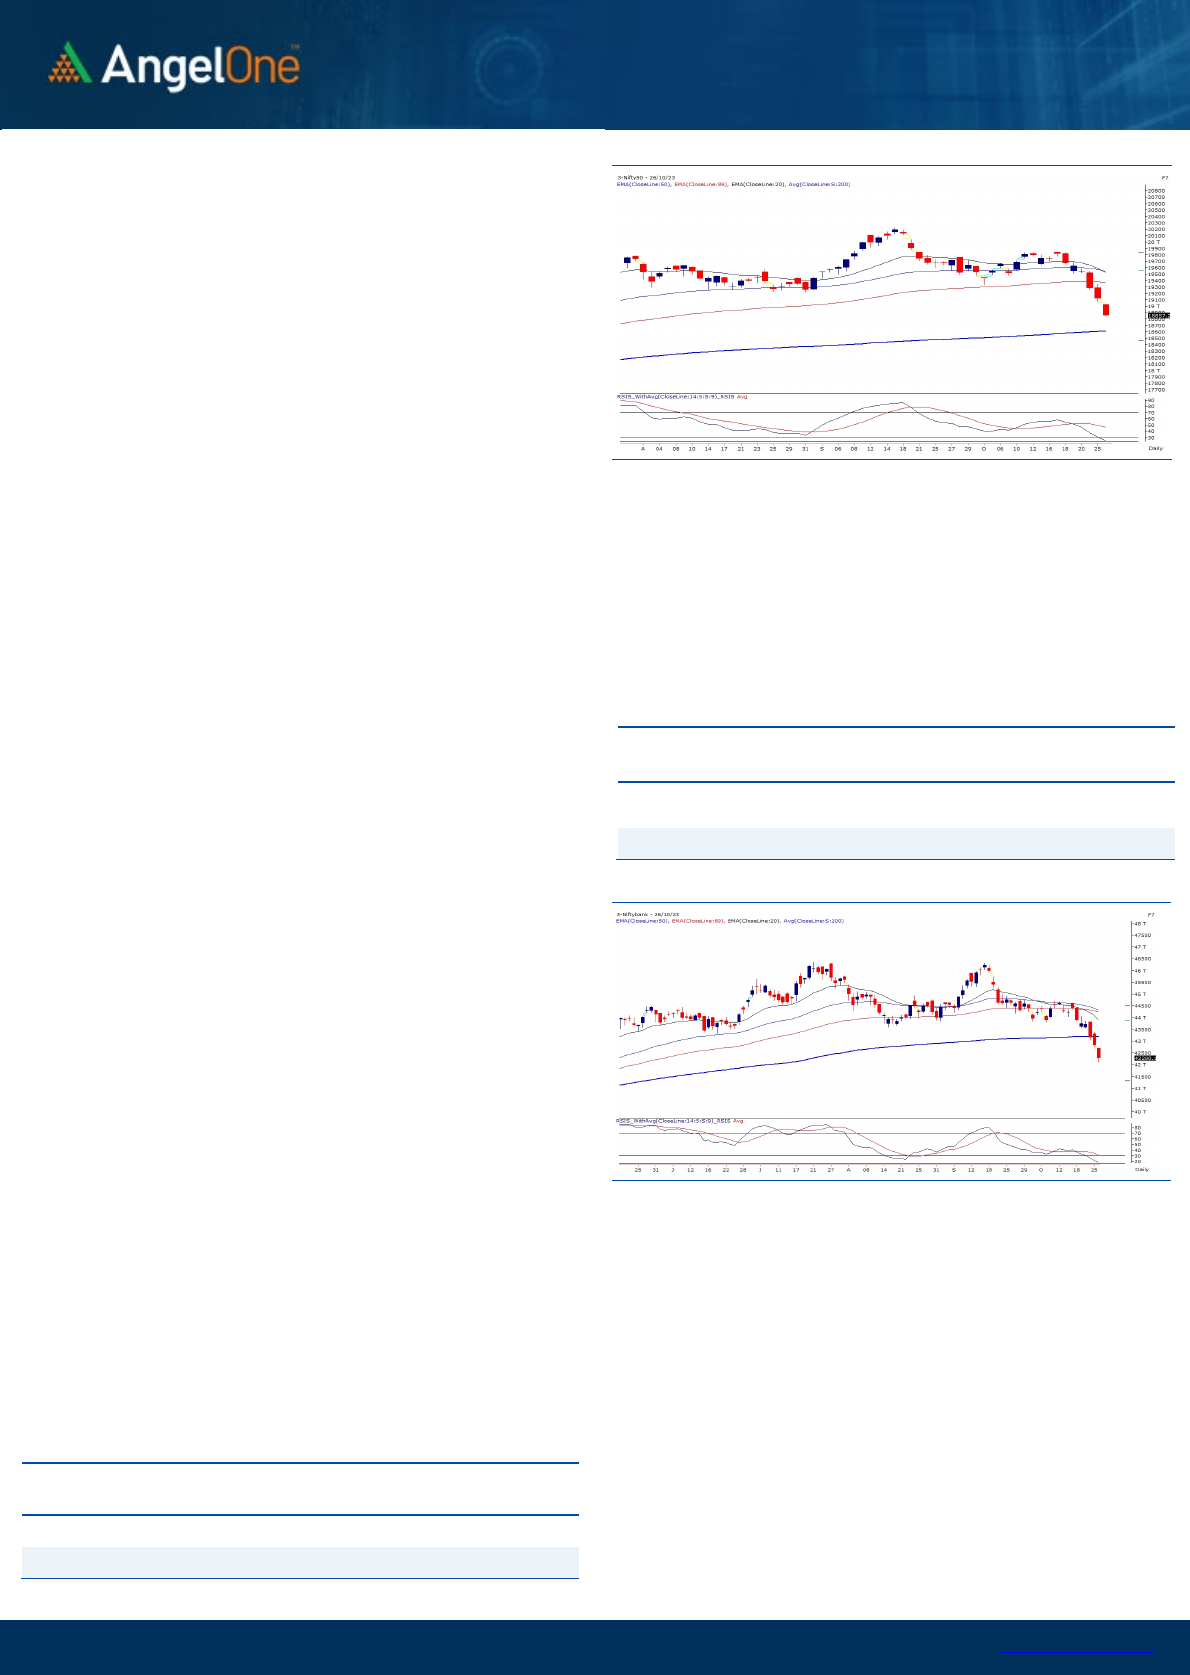
Exhibit 1: Nifty Daily Chart
Exhibit 2: Nifty Bank Daily Chart
Sensex (
6
3148
) / Nifty (
1
8852
)
On the monthly expiry day, the benchmark index Nifty started with a
significant gap down opening, and within the first hour itself, prices
dipped below the psychological mark of 19000. The cascading impact
of expiry led to more selling, pushing the Nifty below the level of 18850.
During the second half, prices traded within a range lurking on the
lower side. Eventually, it ended with a cut of 1.39%, a tad above 18850.
The Bulls had a disappointing series in October, with Nifty losing
approximately 3.5% over the course of the contract. Most of the month
was lackluster, and a major sell-off occurred during this week, evident
in three consecutive bearish candles on the daily chart, with the latest
one with a bearish gap. The breach of key support levels with ease
emphasizes the futility of seeking support in a declining market.
However, hourly indicators, especially RSI Smoothened, is in a deep
oversold zone and is almost at its lower threshold. In such a scenario,
initiating new short positions may not be prudent. In fact, if there are
appealing opportunities, traders can consider long positions, factoring
in the risk-reward ratio suggested by the indicators. Given the recent
sell-off, market sentiment remains weak, and significant upside
potential is unlikely, given the numerous overhead resistance levels.
Therefore, it's advisable for traders to refrain from aggressive long
positions until concrete signs of a bullish reversal emerge.
One should focus on trading opportunities while considering key
levels on both sides. Immediate resistance is observed around 19000
followed by a bearish gap left yesterday around 19070, while on
the flip side, 18800 - 18700 is seen as immediate support, followed
by the 200SMA at 18600, representing a critical support for the
benchmark. Additionally, it's crucial to monitor geopolitical
developments, as any positive news on that front could potentially
trigger a relief rally in our distressed market.
Key Levels
Support 1 – 18800 Resistance 1 – 19000
Support 2 – 18700 Resistance 2 – 19070

www.angelone.in
Technical & Derivatives Report
October
2
7
, 2023
View
The bears continued their dominance for the sixth
consecutive day, wherein the benchmark index
Nifty50 plummeted to 18850 on the expiry day,
shedding 1.39 percent.
FIIs were net sellers in the cash market segment to
the tune of Rs. 7703 cr. Simultaneously, they sold
worth Rs. 3405 cr in Index futures with insignificant
change in open interest.
On the derivatives front, both key indices
plummeted with fall in OI on the expiry day. On the
options front, decent piling of OI is seen at 18800 put
strike, indicating nearby support. While highest
piling of OI is seen at 19000 call strike, suggesting a
strong resistance. The stronger hands continued
their selling streak in cash and index futures.
Considering the recent developments, our market
seems highly oversold and hence it is advisable to
avoid aggressive shorts for the time being.
Comments
The Nifty futures open interest has decreased by 4.81%
and Bank Nifty futures open interest has decreased by
6.58% as the market closed at 18857.25.
The Nifty November future closed with a premium of
115.35 points against a premium of 102.80 points in the
last trading session. The December series closed at a
premium of 222.05 points.
The INDIA VIX has increased from 11.31 to 11.73. At the
same time, the PCR-OI of Nifty has increased from 0.67
to 0.82.
A few of the liquid counters where we have seen high
cost of carry are BERGEPAINT, COROMANDEL, M&M,
NESTLEIND and ASIANPAINT.
Historical Volatility
SCRIP HV
IGL 38.45
MGL 37.22
HAVELLS 30.34
ITC 23.61
MPHASIS 37.61
Nifty Vs OI
18200
18400
18600
18800
19000
19200
19400
19600
19800
20000
20200
9,000
10,000
11,000
12,000
13,000
14,000
10-9 10-12 10-16 10-18 10-23 10-26
Openinterest Nifty
OI Gainers
SCRIP OI
OI
CHG. (%)
PRICE
PRICE
CHG. (%)
HDFCBANK 151504100 3.79 1463.40 -2.14
PNB 276336000 2.99 69.85 0.29
INDHOTEL 24388000 1.89 374.80 -3.80
MANAPPURAM 70302000 1.71 130.60 -1.06
DLF 31805400 1.58 522.35 -1.55
INDUSINDBK 22929500 1.31 1414.65 -0.07
INDIGO 6096000 0.05 2412.20 -0.69
TORNTPHARM 1658500 -0.06 1889.65 -1.52
OI Losers
SCRIP OI
OI
CHG. (%)
PRICE
PRICE
CHG. (%)
LALPATHLAB 17600 -30.75 2349.25 -1.10
DELTACORP 9685200 -30.29 127.45 -5.19
RBLBANK 38920000 -29.68 216.35 -3.95
NAVINFLUOR 923700 -27.71 3429.85 -0.82
ONGC 29363950 -27.12 180.90 -1.76
HDFCAMC 3307200 -25.08 2711.15 -2.49
MUTHOOTFIN 5431800 -23.93 1262.90 -0.99
BALKRISIND 1872600 -23.38 2556.05 -1.12
Put-Call Ratio
SCRIP PCR (OI) PCR (VOL)
NIFTY 0.82 0.69
BANKNIFTY 0.75 0.78
RELIANCE 0.83 0.63
ICICIBANK 0.68 0.63
INFY 0.65 0.57
www.angelone.in
Technical & Derivatives Report
October
2
7
, 2023
Note: Above mentioned Bullish or Bearish Spreads in Nifty (Nov Series) are given as an information and not as a recommendation.
Nifty Spot =
1
8857
.
25
FII Statistics for
October
2
6
, 2023
Detail Buy
Contracts
OI Value
(in Cr.)
Sell Net
CHANGE
INDEX
FUTURES
9311.48 12716.33 (3404.85) 194336 15621.26 (0.05)
INDEX
OPTIONS
2781897.97 2829781.25 (47883.28) 3017829 244562.07 (42.44)
STOCK
FUTURES
37492.66 44195.78 (6703.12) 2234946 167900.96 (6.67)
STOCK
OPTIONS
3296.12 4111.57 (815.45) 26180 1936.23 (83.36)
Total
2831998.23
2890804.93
(58806.70) 5473291
430020.52
(31.50)
Turnover on
October
2
6
, 2023
Instrument
No. of
Contracts
Turnover
(in Cr.)
Change
(%)
Index Futures
743327 58505.76
27.40
Index Options
756194777
72545.76
0.62
Stock Futures
3044489 230816.74
6.24
Stock Options
3575545 4381.18 32.06
Total
35,75,545 4381.18 8.17
Bull-Call Spreads
Action Strike Price Risk Reward BEP
Buy
18800
379.90 60.85
39.15
18860.85
Sell
18900
319.05
Buy
18800 379.90 117.75
82.25
18917.75
Sell
19000 262.15
Buy
18900
319.05 56.90 43.10 18956.90
Sell
19000 262.15
Bear-Put Spreads
Action Strike Price Risk Reward BEP
Buy
19000 289.45
41.85
58.15
18958.15
Sell 18900 247.60
Buy 19000 289.45
76.85
123.15
18923.15
Sell
18800 212.60
Buy
18900 247.60
35.00 65.00 18865.00
Sell 18800 212.60
Nifty Put
-
Call Analysis
,0
1000,000
2000,000
3000,000
4000,000
5000,000
6000,000
18400 18500 18600 18700 18800 18900 19000 19100 19200 19300 19400 19500 19600 19700
Call Put

www.angelone.in
Technical & Derivatives Report
October
2
7
, 2023
`
Daily Pivot Levels for Nifty Constituents
Scrips S2 S1 PIVOT R1 R2
ADANIENT 2,124 2,164 2,206 2,246 2,288
ADANIPORTS 748 759 766 777 783
APOLLOHOSP 4,648 4,704 4,782 4,838 4,916
ASIANPAINT 2,870 2,915 2,985 3,030 3,100
AXISBANK 944 958 967 980 989
BAJAJ-AUTO 5,169 5,214 5,281 5,326 5,392
BAJFINANCE 7,238 7,330 7,493 7,585 7,748
BAJAJFINSV 1,517 1,539 1,573 1,595 1,630
BPCL 328 331 335 339 343
BHARTIARTL 886 896 910 920 935
BRITANNIA 4,455 4,481 4,503 4,529 4,551
CIPLA 1,123 1,137 1,146 1,160 1,169
COALINDIA 300 302 306 309 312
DIVISLAB 3,353 3,380 3,407 3,433 3,460
DRREDDY 5,250 5,336 5,427 5,513 5,603
EICHERMOT 3,272 3,300 3,337 3,365 3,402
GRASIM 1,820 1,835 1,854 1,869 1,889
HCLTECH 1,201 1,217 1,227 1,243 1,254
HDFCBANK 1,440 1,452 1,472 1,484 1,504
HDFCLIFE 596 601 608 613 620
HEROMOTOCO 3,064 3,088 3,109 3,133 3,154
HINDALCO 445 451 455 460 464
HINDUNILVR 2,440 2,458 2,474 2,492 2,508
ICICIBANK 890 900 908 917 926
INDUSINDBK 1,377 1,396 1,413 1,431 1,448
INFY 1,341 1,350 1,362 1,371 1,383
ITC 426 430 434 437 441
JSW STEEL 714 721 733 741 753
KOTAKBANK 1,665 1,680 1,704 1,719 1,743
LT 2,820 2,842 2,879 2,901 2,938
LTIMINDTREE 5,013 5,092 5,145 5,224 5,277
M&M 1,463 1,485 1,521 1,543 1,580
MARUTI 10,269 10,346 10,470 10,548 10,672
NESTLEIND 22,903 23,224 23,742 24,064 24,582
NTPC 225 229 231 234 236
ONGC 177 179 182 183 186
POWERGRID 195 197 198 201 202
RELIANCE 2,197 2,212 2,235 2,250 2,273
SBILIFE 1,279 1,292 1,304 1,317 1,329
SBIN 538 543 548 552 557
SUNPHARMA 1,086 1,095 1,106 1,115 1,127
TCS 3,303 3,320 3,347 3,364 3,391
TATACONSUM
865 873 880 888 895
TATAMOTORS 617 622 629 633 640
TATASTEEL 118 119 120 121 122
TECHM 1,089 1,102 1,111 1,124 1,133
TITAN 3,030 3,065 3,128 3,163 3,225
ULTRACEMCO 8,119 8,162 8,199 8,242 8,279
UPL 546 554 567 575 588
WIPRO 372 375 378 381 383

www.angelone.in
Technical & Derivatives Report
October
2
7
, 2023
Technical and Derivatives Team:
Sameet Chavan Head Research – Technical & Derivatives sameet.chavan@angelone.in
Sneha Seth Senior Analyst – Technical & Derivatives sneha.seth@angelone.in
Rajesh Bhosale Analyst - Technical rajesh.bhosle@angelone.in
Osho Krishan Senior Analyst – Technical & Derivatives osho.krishan@angelone.in
Hitesh Rathi Analyst – Technical & Derivatives hitesh.rathi@angelone.in
Research Team Tel: 022 – 39357600 Website: www.angelone.in
For Technical Queries E-mail: technicalresearch-cso@angelone.in
For Derivatives Queries E-mail: derivatives.desk@angelone.in
DISCLAIMER
We, Angel One Limited (hereinafter referred to as “Angel”) a company duly incorporated under the provisions of the Companies Act, 1956 with
its registered office at 601, 6th Floor, Ackruti Star, Central Road, MIDC, Andheri East, Mumbai – 400093, CIN: (L67120MH1996PLC101709) and
duly registered as a member of National Stock Exchange of India Limited, Bombay Stock Exchange Limited, Metropolitan Stock Exchange Limited,
Multi Commodity Exchange of India Ltd and National Commodity & Derivatives Exchange Ltd. Angel One limited is a company engaged in
diversified financial services business including securities broking, DP services, distribution of Mutual Fund products. It is also registered as a
Depository Participant with CDSL and Portfolio Manager and Investment Adviser with SEBI. It also has registration with AMFI as a Mutual Fund
Distributor. Angel One Limited is a registered entity with SEBI for Research Analyst in terms of SEBI (Research Analyst) Regulations, 2014 vide
registration number INH000000164 and also registered with PFRDA as PoP ,Registration No.19092018. Angel Group does not have any joint
ventures or associates. Angel One Limited is the ultimate parent company of the Group. Angel or its associates has not been debarred/ suspended
by SEBI or any other regulatory authority for accessing /dealing in securities Market.
AOL was merged with Angel Global Capital Private Limited and subsequently name of Angel Global Capital Private Limited was changed to Angel
Broking Private Limited (AOL) pursuant to scheme of Amalgamation sanctioned by the Hon'ble High Court of Judicature at Bombay by Orders
passed in Company Petition No 710 of 2011 and the approval granted by the Registrar of Companies. Further, name of Angel Broking Private
Limited again got changed to Angel Broking Limited (AOL) pursuant to fresh certificate of incorporation issued by Registrar of Companies (ROC)
dated June 28, 2018. Further name of Angel Broking name changed to Angel One Ltd pursuant to fresh certificate of incorporation issued by
Registrar of Companies (ROC) dated 23-09-21.
In case of any grievances please write to: support@angelone.in, Compliance Officer Details: Name : Hiren Thakkar, Tel No. –08657864228, Email
id - compliance@angelone.in
Registration granted by SEBI and certification from NISM in no way guarantee performance of the intermediary or provide any assurance of returns
to investors.
This document is solely for the personal information of the recipient, and must not be singularly used as the basis of any investment decision.
Nothing in this document should be construed as investment or financial advice. Each recipient of this document should make such investigations
as they deem necessary to arrive at an independent evaluation of an investment in the securities of the companies referred to in this document
(including the merits and risks involved), and should consult their own advisors to determine the merits and risks of such an investment.
Angel or its associates or research analyst or his relative may have actual/beneficial ownership of 1% or more in the securities of the subject
company at the end of the month immediately preceding the date of publication of the research report. Neither Angel or its associates nor
Research Analysts or his relative has any material conflict of interest at the time of publication of research report.
Angel or its associates might have received any compensation from the companies mentioned in the report during the period preceding twelve
months from the date of this report for services in respect of managing or co-managing public offerings, corporate finance, investment banking or
merchant banking, brokerage services or other advisory service in a merger or specific transaction in the normal course of business. Angel or its
associates did not receive any compensation or other benefits from the companies mentioned in the report or third party in connection with the
research report. Neither research entity nor research analyst has been engaged in market making activity for the subject company.

www.angelone.in
Technical & Derivatives Report
October
2
7
, 2023
*
Reports based on technical and derivative analysis center on studying charts of a stock's price movement, outstanding positions and trading
volume, as opposed to focusing on a company's fundamentals and, as such, may not match with a report on a company's fundamentals. Investors
are advised to refer the Fundamental and Technical Research Reports available on our website to evaluate the contrary view, if any.
The information in this document has been printed on the basis of publicly available information, internal data and other reliable sources believed
to be true, but we do not represent that it is accurate or complete and it should not be relied on as such, as this document is for general guidance
only. Angel One Limited or any of its affiliates/ group companies shall not be in any way responsible for any loss or damage that may arise to any
person from any inadvertent error in the information contained in this report. Angel One Limited does not warrant the accuracy, adequacy or
completeness of the service, information and materials and expressly disclaims liability for errors or omissions in the service, information and
materials. While Angel One Limited endeavours to update on a reasonable basis the information discussed in this material, there may be
regulatory, compliance, or other reasons that prevent us from doing so.
This document is being supplied to you solely for your information, and its contents, information or data may not be reproduced, redistributed or
passed on, directly or indirectly.
Neither Angel One Limited, nor its directors, employees or affiliates shall be liable for any loss or damage that may arise from or in connection
with the use of this information. Angel or its associates or Research Analyst or his relative might have financial interest in the subject company.
Research analyst has not served as an officer, director or employee of the subject company.
Investment in securities market are subject to market risks. Read all the related documents carefully before investing.
Any communication sent to clients on phone numbers or e-mail ids registered with the Trading Member is meant for client consumption and such
material should not be redistributed. Brokerage will not exceed SEBI prescribed limit. Any Information provided by us through any medium based
on our research or that of our affiliates or third parties or other external sources is subject to domestic and international market conditions and
we do not guarantee the availability or otherwise of any securities or other instruments and such Information is merely an estimation of certain
investments, and we have not and shall not be deemed to have assumed any responsibility for any such Information. You should seek independent
professional advice and/or tax advice regarding the suitability of any investment decision whether based on any Information provided by us
through the Site from inhouse research or third party reports or otherwise.
The report and information contained herein is strictly confidential and meant solely for the selected recipient and may not be altered in any way,
transmitted to, copied or distributed, in part or in whole, to any other person or to the media or reproduced in any form, without prior written
consent.
