OCT 27, 2022
www.angelone.in
Technical & Derivatives Report
xOOOOOOOO
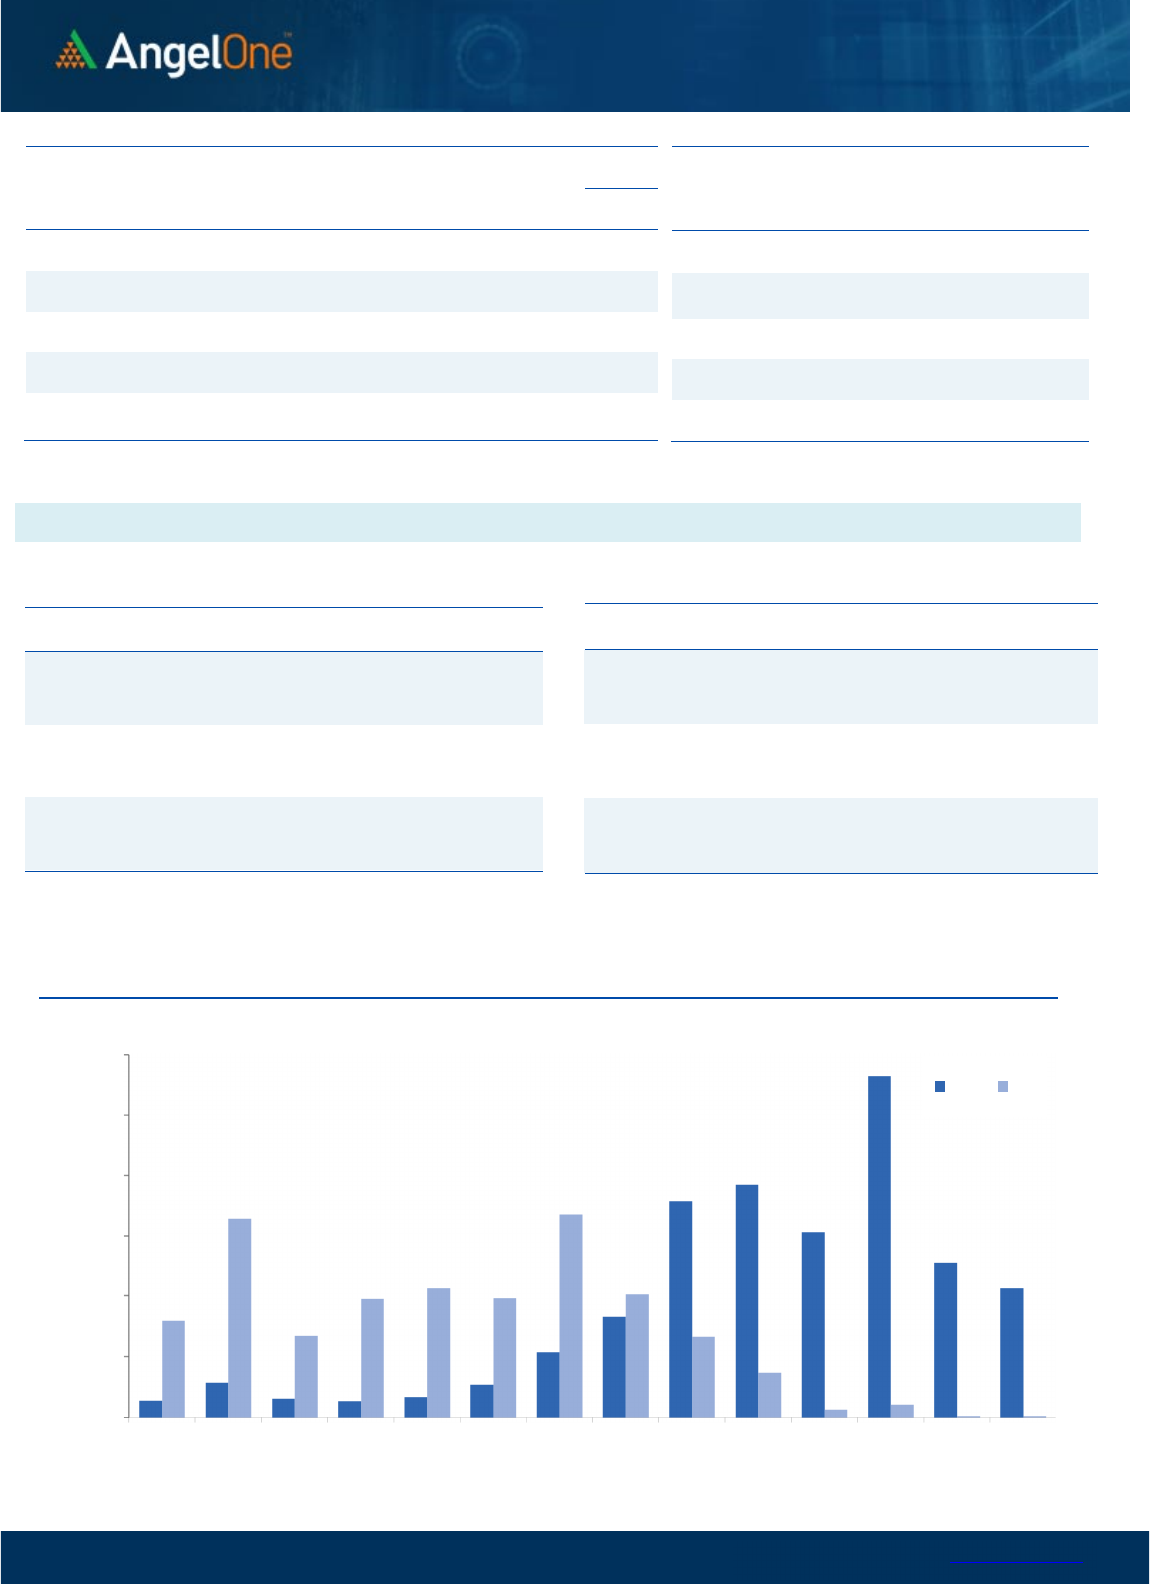
Nifty Bank Outlook (41123)
The BANKNIFTY opened higher in tandem with benchmark index
on Tuesday. However, the profit booking took place almost from
the initial trades. Due to some extended decline in the latter half,
the banking index not only pared down losses but also went on to
close in the negative terrain by shedding near half a percent from
previous close.
Honestly speaking, it was surprising to see banking space failing to
capitalise on the initial lead. Although, purely from technical
observations, we can see Tuesday’s candle overshadowing
previous candle, which in general is a sign of caution. But there are
times, practically we shouldn’t be going with such theories.
Considering the inherent strength of our markets and the improved
sentiments globally, we expect market to resume upward
momentum. We reiterate that it’s a matter of time BANKNIFTY will
surpass its previous highs to enter the uncharted territory. Before
this, 41500 - 41650 are the immediate levels to watch out for. As
far as support is concerned, 41000 followed by 40600 are to be
treated as key levels.
K
ey Levels
Support 1 – 41000 Resistance 1 – 41500
Support 2 – 40600 Resistance 2 – 41650
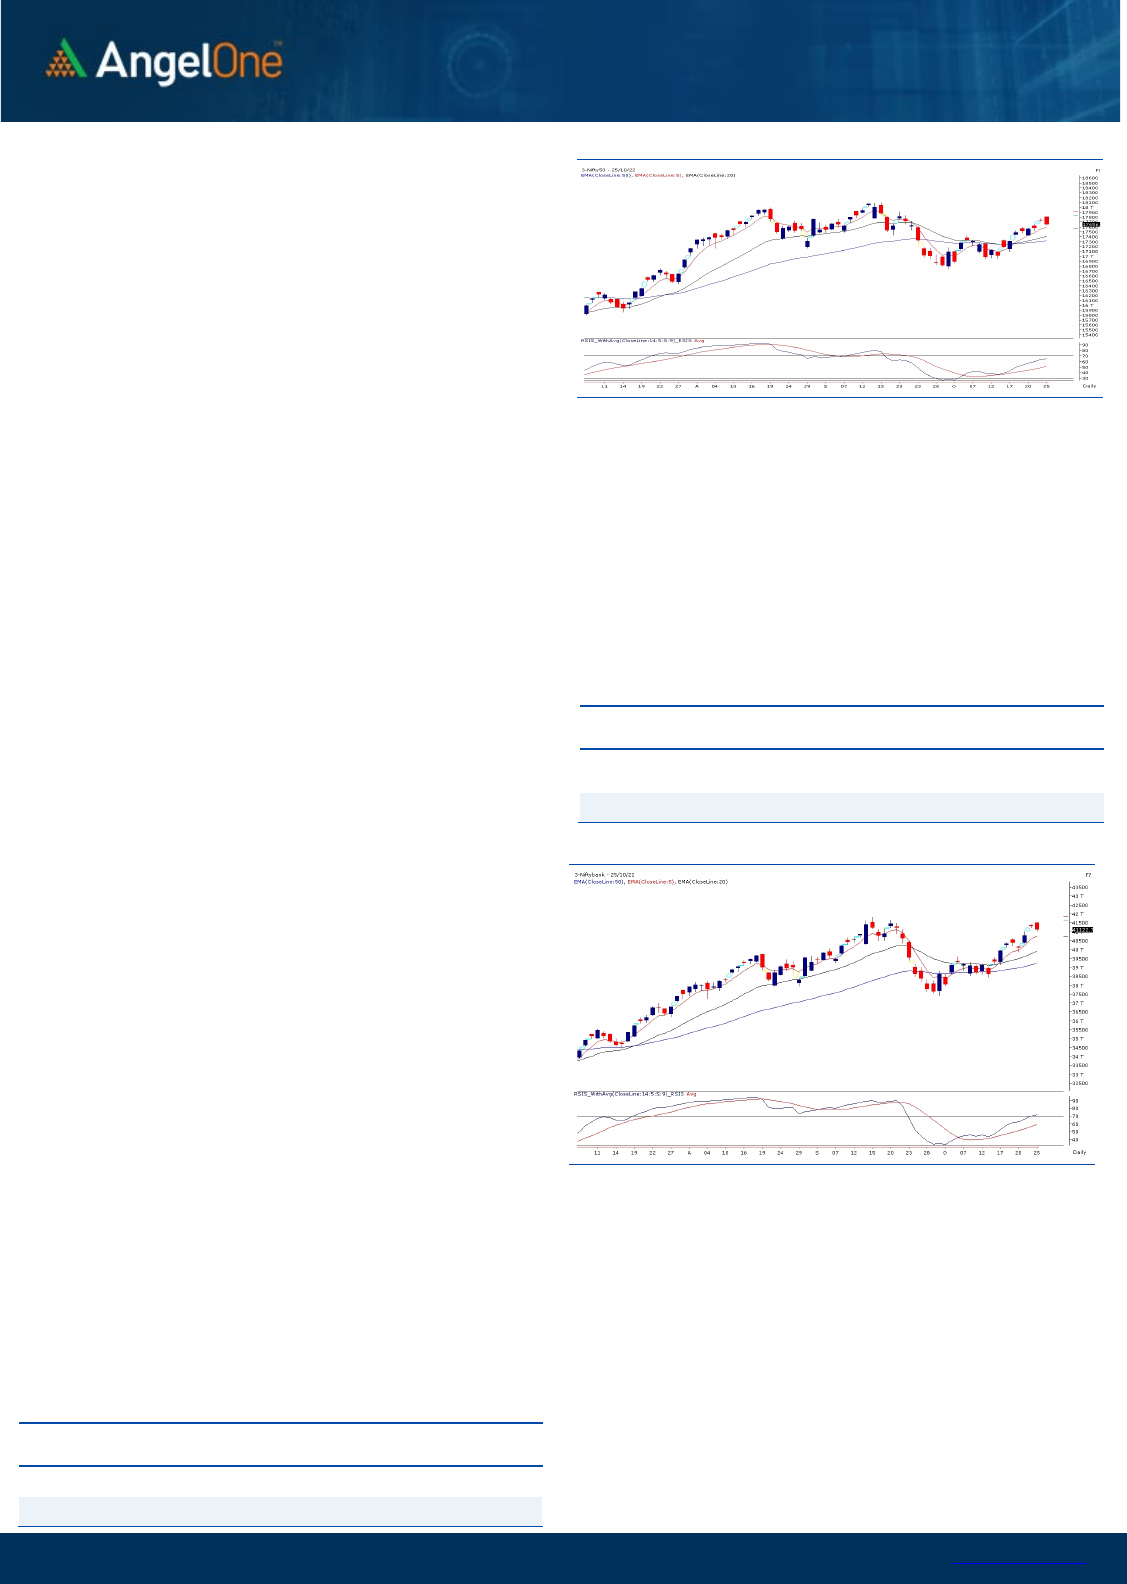
Exhibit 1: Nifty
Daily
Chart
Exhibit 2: Nifty Bank
Daily
Chart
Sensex (59544) / Nifty (17656)
The Samvat 2079 started on a promising note on the day of Muhurat
trading with a bullish gap, which was followed by a minor correction
on the consecutive day. The benchmark index witnessed some
tentativeness around the 17800 zone ahead of the mid-week
holiday; however, the bullish stature remains unchanged with the
higher highs formation on the daily chart. The Nifty50 index settled
a tad above 17650 levels, with a mere gain of 0.46 percent in the
current truncated week.
On a technical aspect, the index is firmly placed above all the major
exponential moving averages on the daily chart and has maintained
its cycle of higher highs – higher lows, construing to have a bullish
setup. However, ahead of the monthly expiry, Nifty has seen some
tentativeness at higher levels; but we do not construe this as any
sign of worry. Traders are just opting to take some money off the
table after seeing a decent up move in the last two weeks. As far as
levels are concerned,17600-17560 is likely to cushion any fall on an
immediate basis; whereas on the flipside, a decisive breach over the
immediate resistance of 17800 (which we expect soon) could trigger
a strong rally towards 18000 and beyond.
There have been contributions across the board, wherein the
significant benefactors that boosted the bullish sentiments were
from the PSU Banking space and the Auto sector. Looking at the
recent developments, the undertone is likely to remain in favor
of the bulls, and any intraday blip is expected to augur well for
the bulls. Also, it is advisable to avoid aggressive bets as the
market might act volatile on the expiry day. Meanwhile, we
advocate to keep Identifying apt themes and potential movers
within the same that are likely to provide better trading
opportunities and stay abreast with global developments.
Key Levels
Support 1 – 17600 Resistance 1 – 17840
Support 2 – 17560 Resistance 2 – 17940

www.angelone.in
Technical & Derivatives Report
OCT 27, 2022
View
On Tuesday, we saw index reclaiming 17800 but
unfortunately due to profit taking at higher levels
concluded the day on a negative note with a cut of
0.42%.
FIIs were net sellers in the cash market segment to
the tune of Rs. 247 crores. Simultaneously, in Index
futures, they bought marginally with a good amount of
decline in open interest, indicating trimming of shorts
on Tuesday’s session.
In F&O space, the banking index added fresh shorts
and long unwinding seen in Nifty futures. Stronger
hands were net sellers in equities, but they preferred
covering shorts in index and stock futures, long short
ratio increased to 34% from 30%. PCR-OI plunged
below 1 due to massive writing in call strikes. Call
writers added decent positions in 17650-18000 call
options, suggesting 17700-17800 to act as hurdle for
monthly expiry session. Maximum open interest
concentration remains in 17500 puts, which may act as
support zone. Considering the above data point, we
still maintain our optimistic stance on market and
would advocate considering intraday dips as a buying
opportunity.
Comments
The Nifty futures open interest has decreased by
4.46%. and Bank Nifty futures open interest has
increased by 4.44% as the market closed at 17656.35.
The Nifty October future closed with a discount of
1.40 point against a discount of 11.85 point in the last
trading session. The November series closed at a
premium of 32.30 point.
The INDIA VIX decreased from 17.23 to 16.88. At the
same time, the PCR-OI of Nifty has decreased from
1.03 to 0.96.
Few of the liquid counters where we have seen high
cost of carry are IDEA, PETRONET, INDUSTOWER,
FSL and IOC.
Historical Volatility
SCRIP HV
MCX 46.09
MGL 41.05
NESTLEIND 25.92
HINDUNILVR 29.34
IGL 43.02
Nifty Vs OI
16400
16600
16800
17000
17200
17400
17600
17800
18000
12,000
12,500
13,000
13,500
14,000
14,500
15,000
15,500
16,000
10/6 10/10 10/12 10/14 10/18 10/20 10/25
Openinterest Nifty
OI Gainers
SCRIP OI
OI
CHG. (%)
PRICE
PRICE
CHG. (%)
BHEL 148228500 17.19 71.10 7.24
SBIN 63072000 13.07 578.55 1.44
MCX 2706800 12.28 1495.20 8.74
CANBK 50274000 10.54 284.20 4.97
SBICARD 6451200 10.34 844.85 -1.12
MOTHERSON 106359750 9.51 62.10 -0.72
PNB 318016000 7.04 43.30 5.48
INDIGO 4018200 6.17 1768.10 -1.07
OI Losers
SCRIP OI
OI
CHG. (%)
PRICE
PRICE
CHG. (%)
NMDC 23426550 -42.06 130.75 0.62
UBL 1144400 -16.17 1615.85 -0.37
SHREECEM 355475 -15.18 21299.55 1.51
POLYCAB 834000 -14.54 2765.30 2.31
INDIAMART 277650 -14.07 4393.65 0.72
JUBLFOOD 11506250 -13.36 591.35 -0.24
MRF 52720 -13.15 87342.75 1.17
METROPOLIS 636900 -13.10 1629.95 2.77
Put-Call Ratio
SCRIP PCR (OI) PCR (VOL)
NIFTY 0.96 1.03
BANKNIFTY 1.02 0.96
RELIANCE 0.57 0.55
ICICIBANK 0.71 0.49
INFY 0.64 0.49
www.angelone.in
Technical & Derivatives Report
OCT 27, 2022
Note: Above mentioned Bullish or Bearish Spreads in Nifty (Oct Series) are given as an information and not as a recommendation.
Nifty Spot =
17
656.35
FII Statistics for
October
2
5
, 2022
Detail Buy
Contracts
Open
Interest
Value
(in Cr.)
Sell
Net
CHANGE
INDEX
FUTURES
6279.81 6227.08 52.73
179638 16594.05 (8.40)
INDEX
OPTIONS
898589.06 903744.00 (5154.94) 1698468 156104.27 (8.95)
STOCK
FUTURES
47910.60 44919.16 2991.44
2152718 150103.31 (1.40)
STOCK
OPTIONS
8787.74 8816.39 (28.65) 134934 9953.14 (18.88)
Total 961567.21
963706.63
(2139.42) 4165758
332754.77
(5.56)
Turnover on
October
2
5
, 2022
Instrument
No. of
Contracts
Turnover
( in Cr. )
Change
(%)
Index Futures
441889 41707.47 -6.99
Index Options
147583187 39508.46 -7.03
Stock
Futures
2539219 178868.47 5.35
Stock Options
3365730 2930.84 -26.72
Total
3,365,730 2930.84 0.73
Bull-Call Spreads
Action Strike Price Risk Reward BEP
Buy
17700 48.90
29.95
70.05
17729.95
Sell
17800 18.95
Buy
17700 48.90
42.95
157.05
17742.95
Sell
17900 5.95
Buy
17800 18.95
13.00 87.00 17813.00
Sell 17900 5.95
Bear
-
Put Spreads
Action Strike Price Risk Reward BEP
Buy 17700 90.60
46.00
54.00
17654.00
Sell
17600 44.60
Buy 17700 90.60
70.95
129.05
17629.05
Sell 17500 19.65
Buy
17600 44.60
24.95 75.05 17575.05
Sell 17500 19.65
Nifty Put
-
Call Analysis
,0
2000,000
4000,000
6000,000
8000,000
10000,000
12000,000
16900 17000 17100 17200 17300 17400 17500 17600 17700 17800 17900 18000 18100 18200
Call Put

www.angelone.in
Technical & Derivatives Report
OCT 27, 2022
`
Daily Pivot Levels for Nifty Constituents
Scrips
S2
S1
PIVOT
R1 R2
ADANIENT
3,262
3,281
3,313
3,332
3,364
ADANIPORTS
788
794
803
810 819
APOLLOHOSP
4,331
4,367
4,409
4,445
4,487
ASIANPAINT 3,045 3,065
3,100
3,120
3,155
AXISBANK
883
893
902
912
921
BAJAJ-AUTO
3,592
3,623
3,675
3,706
3,758
BAJFINANCE
6,993
7,048
7,145
7,200
7,298
BAJAJFINSV
1,626
1,642
1,671
1,688
1,717
BPCL
294
298
302
306
309
BHARTIARTL 795 799
802
806 810
BRITANNIA
3,621
3,667
3,736
3,782
3,851
CIPLA 1,138 1,147
1,156 1,165
1,174
COALINDIA 237 238
240
241
243
DIVISLAB 3,543 3,570
3,594
3,622
3,646
DRREDDY 4,324 4,383
4,430
4,490 4,537
EICHERMOT
3,621
3,666
3,695
3,740
3,769
GRASIM
1,676
1,695
1,712 1,732
1,748
HCLTECH 1,012 1,019
1,028
1,036
1,045
HDFCBANK
1,432
1,441
1,455
1,464
1,477
HDFCLIFE
523
528
537
542
550
HDFC
2,322
2,339
2,370
2,388
2,418
HEROMOTOCO 2,549 2,567
2,585 2,603
2,621
HINDALCO
386
392
398
404
409
HINDUNILVR 2,444 2,475
2,530 2,561
2,616
ICICIBANK
910
918
930
938
951
INDUSINDBK 1,106 1,122
1,137 1,153
1,169
INFY 1,515 1,521
1,527
1,532
1,539
ITC 341 343
346
349
352
JSW STEEL
613
629
640
655
667
KOTAKBANK
1,797
1,822
1,867
1,891
1,936
LT
1,869
1,909
1,932
1,972
1,995
M&M 1,251 1,266
1,275
1,290
1,299
MARUTI 8,720 8,863
8,940
9,082
9,159
NESTLEIND
19,684
19,983
20,516
20,815
21,348
NTPC 164 167
168 171
172
ONGC 128 129
131
132
134
POWERGRID
212
215
217
221
223
RELIANCE
2,399
2,420
2,460
2,481
2,521
SBILIFE
1,223
1,239
1,259
1,275
1,294
SBIN
559
569
578
587
596
SUNPHARMA
980
986
991
997
1,003
TCS
3,133
3,147
3,166
3,181
3,199
TATACONSUM
757 762
769
774
782
TATAMOTORS 399 402
406
409 413
TATASTEEL 100 100
101
102 103
TECHM
1,038
1,060
1,073
1,095
1,108
TITAN
2,641
2,656
2,677
2,691
2,712
ULTRACEMCO
6,339
6,377
6,426 6,464
6,512
UPL
680
687
699
706
717
WIPRO
382
383
385
386
388

www.angelone.in
Technical & Derivatives Report
OCT 27, 2022
*
Technical and Derivatives Team:
Sameet Chavan Chief Analyst – Technical & Derivatives sameet.chavan@angelone.in
Sneha Seth Senior Analyst – Technical & Derivatives sneha.seth@angelone.in
Rajesh Bhosale Technical Analyst rajesh.bhosle@angelone.in
Osho Krishan Senior Analyst – Technical & Derivatives osho.krishan@angelone.in
Research Team Tel: 022 – 39357600 Website: www.angelone.in
For Technical Queries E-mail: technicalresearch-cso@angelone.in
For Derivatives Queries E-mail: derivatives.desk@angelone.in
DISCLAIMER
Angel One Limited (hereinafter referred to as “Angel”) is a registered Member of National Stock Exchange of India Limited, Bombay
Stock Exchange Limited and Metropolitan Stock Exchange Limited. It is also registered as a Depository Participant with CDSL and
Portfolio Manager and investment advisor with SEBI. It also has registration with AMFI as a Mutual Fund Distributor. Angel One
Limited is a registered entity with SEBI for Research Analyst in terms of SEBI (Research Analyst) Regulations, 2014 vide registration
number INH000000164. Angel or its associates has not been debarred/ suspended by SEBI or any other regulatory authority for
accessing /dealing in securities Market.
This document is solely for the personal information of the recipient, and must not be singularly used as the basis of any investment
decision. Nothing in this document should be construed as investment or financial advice. Each recipient of this document should
make such investigations as they deem necessary to arrive at an independent evaluation of an investment in the securities of the
companies referred to in this document (including the merits and risks involved), and should consult their own advisors to determine
the merits and risks of such an investment.
Angel or its associates or research analyst or his relative may have actual/beneficial ownership of 1% or more in the securities of
the subject company at the end of the month immediately preceding the date of publication of the research report. Neither Angel or
its associates nor Research Analysts or his relative has any material conflict of interest at the time of publication of research report.
Angel or its associates might have received any compensation from the companies mentioned in the report during the period
preceding twelve months from the date of this report for services in respect of managing or co-managing public offerings, corporate
finance, investment banking or merchant banking, brokerage services or other advisory service in a merger or specific transaction
in the normal course of business. Angel or its associates did not receive any compensation or other benefits from the companies
mentioned in the report or third party in connection with the research report. Neither Angel nor its research analyst entity has been
engaged in market making activity for the subject company.
Reports based on technical and derivative analysis center on studying charts of a stock's price movement, outstanding positions and
trading volume, as opposed to focusing on a company's fundamentals and, as such, may not match with a report on a company's
fundamentals. Investors are advised to refer the Fundamental and Technical Research Reports available on our website to evaluate
the contrary view, if any.
The information in this document has been printed on the basis of publicly available information, internal data and other reliable
sources believed to be true, but we do not represent that it is accurate or complete and it should not be relied on as such, as this
document is for general guidance only. Angel One Limited or any of its affiliates/ group companies shall not be in any way responsible
for any loss or damage that may arise to any person from any inadvertent error in the information contained in this report. Angel One
Limited has not independently verified all the information contained within this document. Accordingly, we cannot testify, nor make
any representation or warranty, express or implied, to the accuracy, contents or data contained within this document. While Angel
One Limited endeavors to update on a reasonable basis the information discussed in this material, there may be regulatory,
compliance, or other reasons that prevent us from doing so.
This document is being supplied to you solely for your information, and its contents, information or data may not be reproduced,
redistributed or passed on, directly or indirectly.
Neither Angel One Limited, nor its directors, employees or affiliates shall be liable for any loss or damage that may arise from or in
connection with the use of this information. Angel or its associates or Research Analyst or his relative might have financial interest
in the subject company. Research analyst has not served as an officer, director or employee of the subject company.
