September
2
7
, 2023
www.angelone.in
Technical & Derivatives Report
8
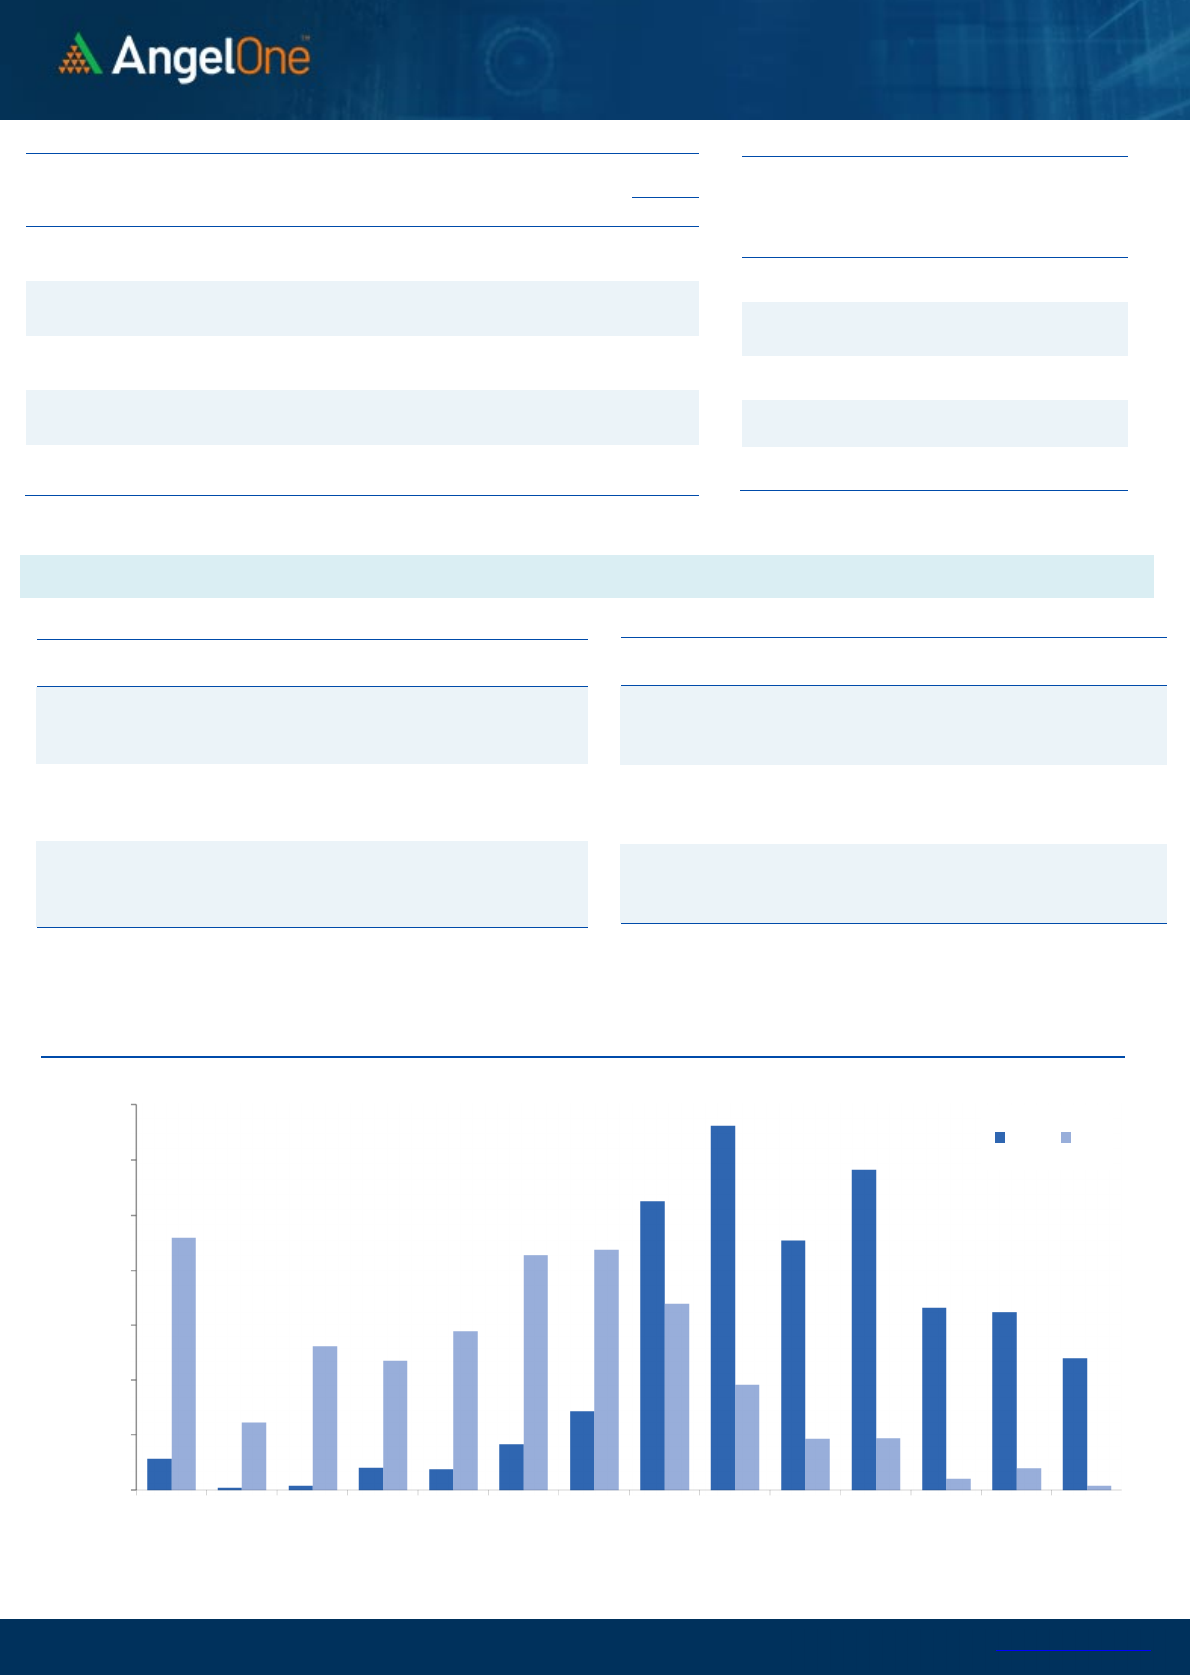
Nifty Bank Outlook (
4
4
624
)
Trading for the rate-sensitive index began slightly lower and in the
absence of any buying interest kept oscillating within a narrow range
of just three hundred points. By the end of the day, the BankNifty
concluded the dull session tad above 44600, with a cut of three-tenth
of a percent.
From a technical perspective, there hasn't been significant price action
as the index continued to stay within Monday's trading range.
Currently, the crucial zone to monitor is the 89-day Exponential
Moving Average (EMA) on the daily chart, which coincides with
Monday's low, i.e. 44400. This level holds importance as the index
rebounded precisely from this same moving average in the previous
month. In terms of key levels, as long as we manage to sustain above
the recent swing lows around 44000-43800, there is room for
optimism. On the upside, any sustained movement beyond 45000-
45300 would provide some relief for the bullish sentiment.
Key Levels
Support 1 – 44400 Resistance 1 – 45000
Support 2 – 44000 Resistance 2 – 45300
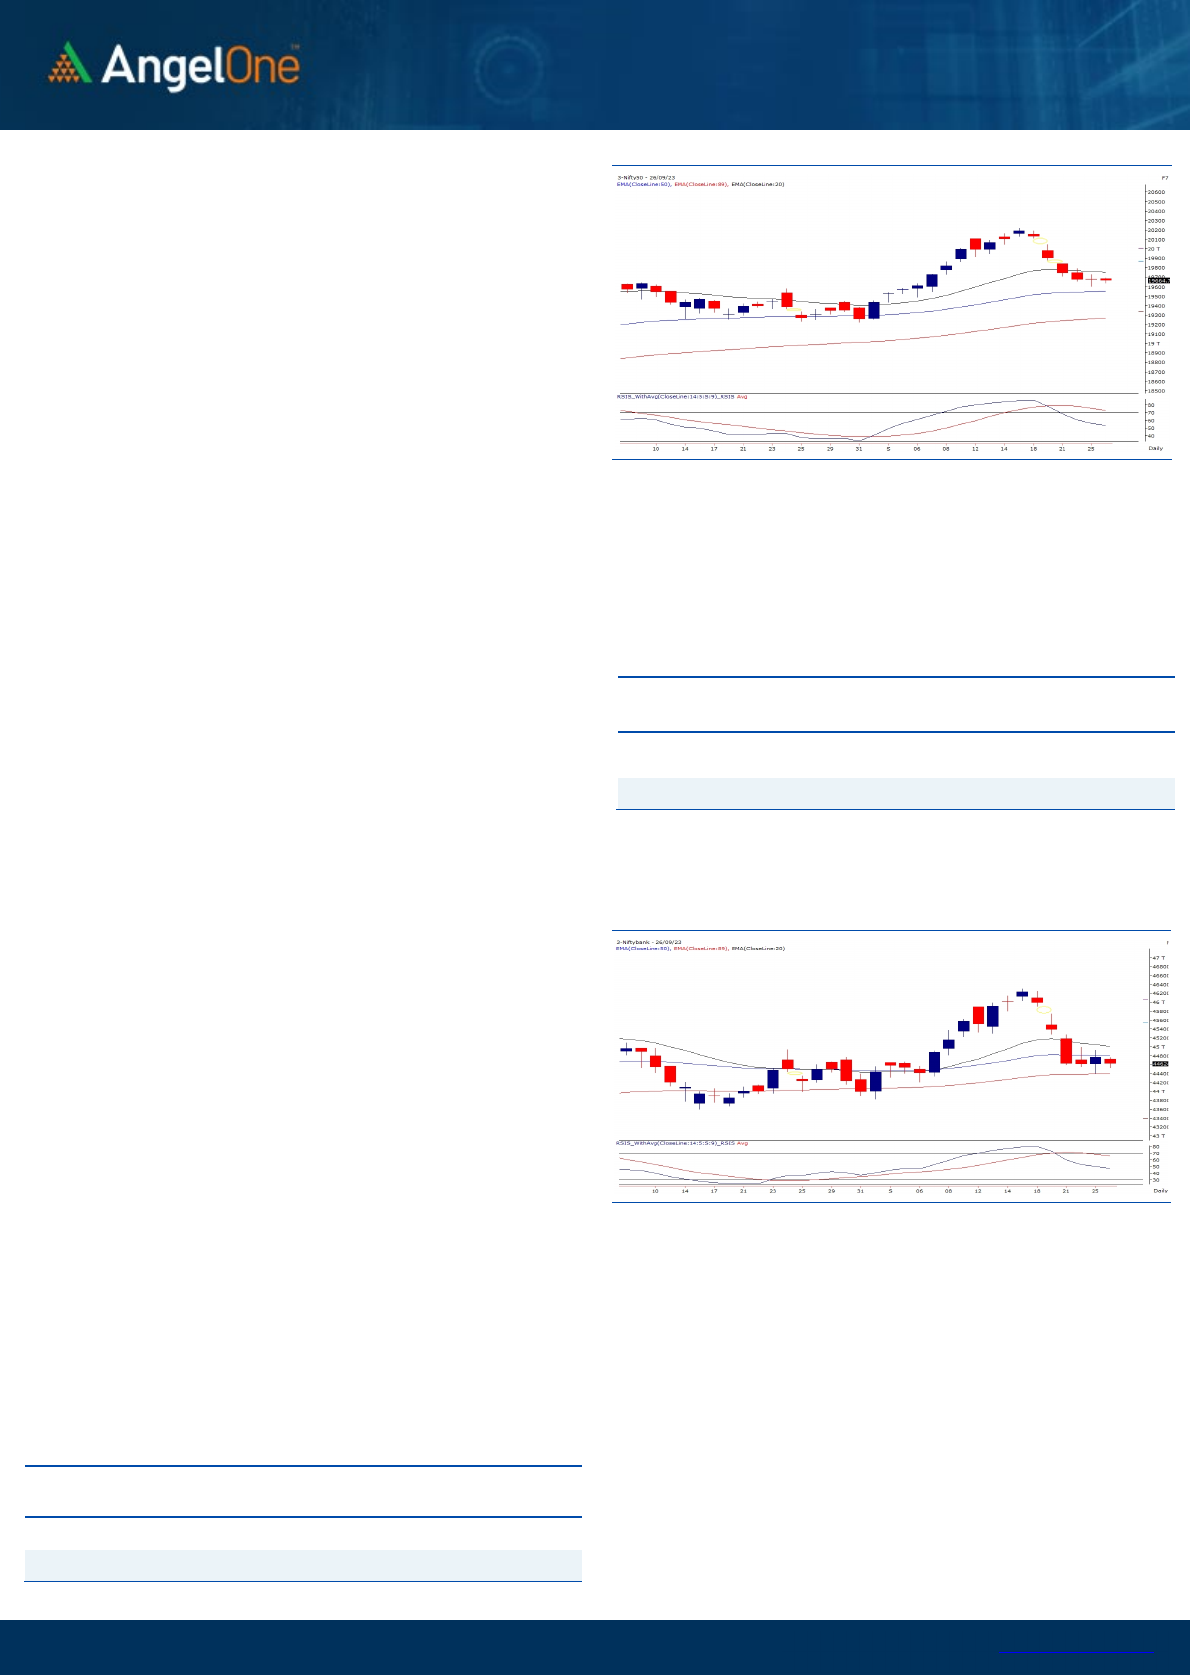
Exhibit 1: Nifty Daily Chart
Exhibit 2: Nifty Bank Daily Chart
Sensex (
6
5946
) / Nifty (
19
6
6
5
)
Once again, the benchmark index started the session on a flat note, and
as the day unfolded, prices continued to move within a narrow range
of around 50 points. Ultimately, prices closed the session on a relatively
flat note, not deviating significantly from last Friday's closing levels.
Boredom seems to have settled in for the key indices, as there has been
a lack of significant movement over the past two days. The benchmark
index is currently hovering around the crucial support level of 19600,
which forms a confluence zone created by the 50-day Simple Moving
Average (SMA) and the 61.8% retracement levels of the recent rally. It
appears that traders are awaiting a catalyst to spark momentum, and
we remain optimistic that the index can defend these levels. This could
potentially lead to a strong upward move as we approach the end of
September, a month that initially began on a robust note. As
highlighted, 19600 followed by 19500 is considered robust support,
especially leading up to the monthly expiry. At present, we advise
caution against initiating short positions, as the hourly indicators still
show an oversold condition with a noticeable positive divergence.
Ideally, one should consider buying on dips. On the other hand, the
immediate resistance levels are at 19800 - 19850. Taking it one step at
a time, traders may contemplate booking long positions around these
levels.
It's essential for traders to monitor these levels closely and make
trading decisions accordingly. It's advisable to avoid aggressive
trading until a clear momentum shift is observed in the market.
Additionally, when selecting individual stocks, one should be
discerning, as there hasn't been a substantial follow-up move in
specific stocks either.
Key Levels
Support 1 – 19600 Resistance 1 – 19800
Support 2 – 19500 Resistance 2 – 19850

www.angelone.in
Technical & Derivatives Report
September
2
7
, 2023
View
The Indian equity market witnessed a lackluster day
of trade, wherein the benchmark index Nifty50
restricted its move within 50 points and settled on a
muted note, with a mere cut of 0.05 percent.
FIIs were net sellers in the cash market segment to
the tune of Rs. 693 cr. Simultaneously, they sold
worth Rs. 359 cr in Index futures with a fall in open
interest, suggesting long unwinding.
On the derivatives front, there have been
insignificant changes in both indices. On the options
front, the 19600 put strike holds the highest OI
concentration, followed by 19500 PE, indicating a
nearby support zone. On the other side, the highest
OI concentration stands at 19800 call strike,
indicating the intermediate resistance. Considering
the mentioned data, the benchmark index is likely to
hover within the mentioned range for the expiry
week. Additionally, it seems our market awaits some
trigger to come out of the slumber phase. Until then,
avoiding aggressive bets and staying vigilant with
global developments is advisable.
Comments
The Nifty futures open interest has increased by 1.99%
and Bank Nifty futures open interest has decreased by
3.69% as the market closed at 19664.70.
The Nifty September future closed with a premium of
12.35 points against 25.95 points in the last trading
session. The October series closed at a premium of
128.85 points.
The INDIA VIX has increased from 10.90 to 11.19. At the
same time, the PCR-OI of Nifty has increased from 0.91
to 0.92.
A few of the liquid counters where we have seen high
cost of carry are COLPAL, IDEA, DIXON, ASTRAL and
RAMCOCEM.
Historical Volatility
SCRIP HV
BERGEPAINT 29.60
CANBK 42.45
ZYDUSLIFE 28.70
GRANULES 38.21
DRREDDY 25.00
Nifty Vs OI
19200
19400
19600
19800
20000
20200
20400
20600
10,000
10,500
11,000
11,500
12,000
12,500
13,000
9-8 9-12 9-14 9-18 9-21 9-26
Openinterest Nifty
OI Gainers
SCRIP OI
OI
CHG. (%)
PRICE
PRICE
CHG. (%)
DELTACORP 18544400 37.66 140.40 -2.06
COLPAL 3679200 30.84 2068.05 3.24
IPCALAB 2315300 15.05 905.05 0.90
DIXON 1481600 13.38 5098.10 4.34
ONGC 75691000 12.98 187.75 0.67
NAVINFLUOR 672600 11.32 4440.90 -0.32
COFORGE 1658850 11.29 5193.15 -1.58
MUTHOOTFIN 7383200 10.29 1236.80 -1.80
OI Losers
SCRIP OI
OI
CHG. (%)
PRICE
PRICE
CHG. (%)
MGL 17600 -13.56 1029.75 1.55
ASTRAL 3612748 -11.93 1919.80 3.11
BALRAMCHIN 11476800 -9.97 432.10 -2.21
CANBK 54094500 -9.63 370.05 -1.43
SBICARD 10740000 -8.31 786.35 -0.12
LAURUSLABS 12869000 -7.94 385.30 -0.99
MCX 3277600 -6.72 1901.60 -0.03
CONCOR 5897000 -6.17 731.55 0.21
Put-Call Ratio
SCRIP PCR (OI) PCR (VOL)
NIFTY 0.92 0.91
BANKNIFTY 0.77 1.00
RELIANCE 0.48 0.46
ICICIBANK 0.40 0.50
INFY 0.43 0.49
www.angelone.in
Technical & Derivatives Report
September
2
7
, 2023
Note: Above mentioned Bullish or Bearish Spreads in Nifty (Sep Series) are given as an information and not as a recommendation.
Nifty Spot =
19
6
6
4.
70
FII Statistics for
September
2
6
, 2023
Detail Buy
Contracts
OI Value
(in Cr.)
Sell Net
CHANGE
INDEX
FUTURES
3439.85 3798.57 (358.72) 191089 16536.80 (2.70)
INDEX
OPTIONS
1691195.07 1721799.75 (30604.68) 4330643 354802.42 (3.45)
STOCK
FUTURES
73895.54 75092.70 (1197.16) 2394160 189739.94 0.29
STOCK
OPTIONS
21254.73 20967.68 287.05
324230 26189.14 (5.14)
Total
1789785.19
1821658.70
(31873.51) 7240122
587268.30
(2.30)
Turnover on
September
2
6
, 2023
Instrument
No. of
Contracts
Turnover
(in Cr.)
Change
(%)
Index Futures
262145 21860.49
-32.28
Index Options
438100947
47837.63
-23.04
Stock Futures
2368986 189708.08
5.96
Stock Options
4507380 3299.37 -15.50
Total
45,07,380
3299.37 -5.29
Bull-Call Spreads
Action Strike Price Risk Reward BEP
Buy
19600 107.65
58.50
41.50
19658.50
Sell
19700 49.15
Buy
19600 107.65
89.65
110.35
19689.65
Sell
19800 18.00
Buy
19700 49.15
31.15 68.85 19731.15
Sell
19800 18.00
Bear-Put Spreads
Action Strike Price Risk Reward BEP
Buy
19800 143.35
68.55
31.45
19731.45
Sell 19700 74.80
Buy 19800 143.35
109.90
90.10
19690.10
Sell
19600 33.45
Buy
19700 74.80
41.35 58.65 19658.65
Sell 19600 33.45
Nifty Put
-
Call Analysis
,0
2000,000
4000,000
6000,000
8000,000
10000,000
12000,000
14000,000
19000 19100 19200 19300 19400 19500 19600 19700 19800 19900 20000 20100 20200 20300
Call Put

www.angelone.in
Technical & Derivatives Report
September
2
7
, 2023
`
Daily Pivot Levels for Nifty Constituents
Scrips S2 S1 PIVOT R1 R2
ADANIENT 2,423 2,441 2,470 2,487 2,516
ADANIPORTS 812 817 824 829 836
APOLLOHOSP 4,994 5,024 5,060 5,090 5,127
ASIANPAINT 3,228 3,260 3,293 3,325 3,357
AXISBANK 1,006 1,010 1,015 1,020 1,025
BAJAJ-AUTO 4,955 5,012 5,057 5,115 5,160
BAJFINANCE 7,724 7,797 7,849 7,922 7,973
BAJAJFINSV 1,535 1,551 1,567 1,583 1,599
BPCL 349 350 352 354 356
BHARTIARTL 901 907 914 920 927
BRITANNIA 4,527 4,563 4,586 4,623 4,646
CIPLA 1,147 1,155 1,170 1,179 1,194
COALINDIA 283 285 288 290 293
DIVISLAB 3,684 3,719 3,742 3,776 3,799
DRREDDY 5,403 5,436 5,481 5,513 5,559
EICHERMOT 3,338 3,405 3,472 3,539 3,606
GRASIM 1,928 1,943 1,951 1,967 1,975
HCLTECH 1,251 1,256 1,263 1,268 1,274
HDFCBANK 1,519 1,528 1,534 1,543 1,549
HDFCLIFE 633 639 644 649 654
HEROMOTOCO 2,946 2,990 3,014 3,059 3,083
HINDALCO 463 467 471 475 479
HINDUNILVR 2,449 2,464 2,476 2,492 2,504
ICICIBANK 940 944 952 956 963
INDUSINDBK 1,394 1,408 1,426 1,441 1,459
INFY 1,446 1,453 1,467 1,474 1,487
ITC 437 440 442 445 447
JSW STEEL 772 776 782 786 792
KOTAKBANK 1,738 1,751 1,767 1,779 1,795
LT 2,888 2,900 2,922 2,934 2,956
LTIMINDTREE 5,318 5,341 5,376 5,398 5,433
M&M 1,570 1,583 1,595 1,607 1,619
MARUTI 10,465 10,511 10,572 10,618 10,680
NESTLEIND 22,421 22,713 22,888 23,180 23,355
NTPC 237 238 241 243 245
ONGC 184 186 187 189 190
POWERGRID 196 197 199 200 201
RELIANCE 2,328 2,335 2,343 2,350 2,357
SBILIFE 1,275 1,282 1,292 1,300 1,310
SBIN 590 592 594 596 597
SUNPHARMA 1,113 1,120 1,125 1,131 1,136
TCS 3,513 3,549 3,572 3,608 3,631
TATACONSUM
880 888 899 906 917
TATAMOTORS 613 617 621 624 629
TATASTEEL 127 128 129 130 131
TECHM 1,264 1,273 1,288 1,297 1,312
TITAN 3,222 3,242 3,275 3,295 3,328
ULTRACEMCO 8,133 8,181 8,254 8,303 8,376
UPL 611 614 619 622 627
WIPRO 409 411 414 416 419

www.angelone.in
Technical & Derivatives Report
September
2
7
, 2023
Technical and Derivatives Team:
Sameet Chavan Head Research – Technical & Derivatives sameet.chavan@angelone.in
Sneha Seth Senior Analyst – Technical & Derivatives sneha.seth@angelone.in
Rajesh Bhosale Analyst - Technical rajesh.bhosle@angelone.in
Osho Krishan Senior Analyst – Technical & Derivatives osho.krishan@angelone.in
Hitesh Rathi Analyst – Technical & Derivatives hitesh.rathi@angelone.in
Research Team Tel: 022 – 39357600 Website: www.angelone.in
For Technical Queries E-mail: technicalresearch-cso@angelone.in
For Derivatives Queries E-mail: derivatives.desk@angelone.in
DISCLAIMER
We, Angel One Limited (hereinafter referred to as “Angel”) a company duly incorporated under the provisions of the Companies Act, 1956 with
its registered office at 601, 6th Floor, Ackruti Star, Central Road, MIDC, Andheri East, Mumbai – 400093, CIN: (L67120MH1996PLC101709) and
duly registered as a member of National Stock Exchange of India Limited, Bombay Stock Exchange Limited, Metropolitan Stock Exchange Limited,
Multi Commodity Exchange of India Ltd and National Commodity & Derivatives Exchange Ltd. Angel One limited is a company engaged in
diversified financial services business including securities broking, DP services, distribution of Mutual Fund products. It is also registered as a
Depository Participant with CDSL and Portfolio Manager and Investment Adviser with SEBI. It also has registration with AMFI as a Mutual Fund
Distributor. Angel One Limited is a registered entity with SEBI for Research Analyst in terms of SEBI (Research Analyst) Regulations, 2014 vide
registration number INH000000164 and also registered with PFRDA as PoP ,Registration No.19092018. Angel Group does not have any joint
ventures or associates. Angel One Limited is the ultimate parent company of the Group. Angel or its associates has not been debarred/ suspended
by SEBI or any other regulatory authority for accessing /dealing in securities Market.
AOL was merged with Angel Global Capital Private Limited and subsequently name of Angel Global Capital Private Limited was changed to Angel
Broking Private Limited (AOL) pursuant to scheme of Amalgamation sanctioned by the Hon'ble High Court of Judicature at Bombay by Orders
passed in Company Petition No 710 of 2011 and the approval granted by the Registrar of Companies. Further, name of Angel Broking Private
Limited again got changed to Angel Broking Limited (AOL) pursuant to fresh certificate of incorporation issued by Registrar of Companies (ROC)
dated June 28, 2018. Further name of Angel Broking name changed to Angel One Ltd pursuant to fresh certificate of incorporation issued by
Registrar of Companies (ROC) dated 23-09-21.
In case of any grievances please write to: support@angelone.in, Compliance Officer Details: Name : Hiren Thakkar, Tel No. –08657864228, Email
id - compliance@angelone.in
Registration granted by SEBI and certification from NISM in no way guarantee performance of the intermediary or provide any assurance of returns
to investors.
This document is solely for the personal information of the recipient, and must not be singularly used as the basis of any investment decision.
Nothing in this document should be construed as investment or financial advice. Each recipient of this document should make such investigations
as they deem necessary to arrive at an independent evaluation of an investment in the securities of the companies referred to in this document
(including the merits and risks involved), and should consult their own advisors to determine the merits and risks of such an investment.
Angel or its associates or research analyst or his relative may have actual/beneficial ownership of 1% or more in the securities of the subject
company at the end of the month immediately preceding the date of publication of the research report. Neither Angel or its associates nor
Research Analysts or his relative has any material conflict of interest at the time of publication of research report.
Angel or its associates might have received any compensation from the companies mentioned in the report during the period preceding twelve
months from the date of this report for services in respect of managing or co-managing public offerings, corporate finance, investment banking or
merchant banking, brokerage services or other advisory service in a merger or specific transaction in the normal course of business. Angel or its
associates did not receive any compensation or other benefits from the companies mentioned in the report or third party in connection with the
research report. Neither research entity nor research analyst has been engaged in market making activity for the subject company.

www.angelone.in
Technical & Derivatives Report
September
2
7
, 2023
*
Reports based on technical and derivative analysis center on studying charts of a stock's price movement, outstanding positions and trading
volume, as opposed to focusing on a company's fundamentals and, as such, may not match with a report on a company's fundamentals. Investors
are advised to refer the Fundamental and Technical Research Reports available on our website to evaluate the contrary view, if any.
The information in this document has been printed on the basis of publicly available information, internal data and other reliable sources believed
to be true, but we do not represent that it is accurate or complete and it should not be relied on as such, as this document is for general guidance
only. Angel One Limited or any of its affiliates/ group companies shall not be in any way responsible for any loss or damage that may arise to any
person from any inadvertent error in the information contained in this report. Angel One Limited does not warrant the accuracy, adequacy or
completeness of the service, information and materials and expressly disclaims liability for errors or omissions in the service, information and
materials. While Angel One Limited endeavours to update on a reasonable basis the information discussed in this material, there may be
regulatory, compliance, or other reasons that prevent us from doing so.
This document is being supplied to you solely for your information, and its contents, information or data may not be reproduced, redistributed or
passed on, directly or indirectly.
Neither Angel One Limited, nor its directors, employees or affiliates shall be liable for any loss or damage that may arise from or in connection
with the use of this information. Angel or its associates or Research Analyst or his relative might have financial interest in the subject company.
Research analyst has not served as an officer, director or employee of the subject company.
Investment in securities market are subject to market risks. Read all the related documents carefully before investing.
Any communication sent to clients on phone numbers or e-mail ids registered with the Trading Member is meant for client consumption and such
material should not be redistributed. Brokerage will not exceed SEBI prescribed limit. Any Information provided by us through any medium based
on our research or that of our affiliates or third parties or other external sources is subject to domestic and international market conditions and
we do not guarantee the availability or otherwise of any securities or other instruments and such Information is merely an estimation of certain
investments, and we have not and shall not be deemed to have assumed any responsibility for any such Information. You should seek independent
professional advice and/or tax advice regarding the suitability of any investment decision whether based on any Information provided by us
through the Site from inhouse research or third party reports or otherwise.
The report and information contained herein is strictly confidential and meant solely for the selected recipient and may not be altered in any way,
transmitted to, copied or distributed, in part or in whole, to any other person or to the media or reproduced in any form, without prior written
consent.
