FEB 27, 2023
www.angelone.in
Technical & Derivatives Report
Nifty Bank
Outlook (
39909
)
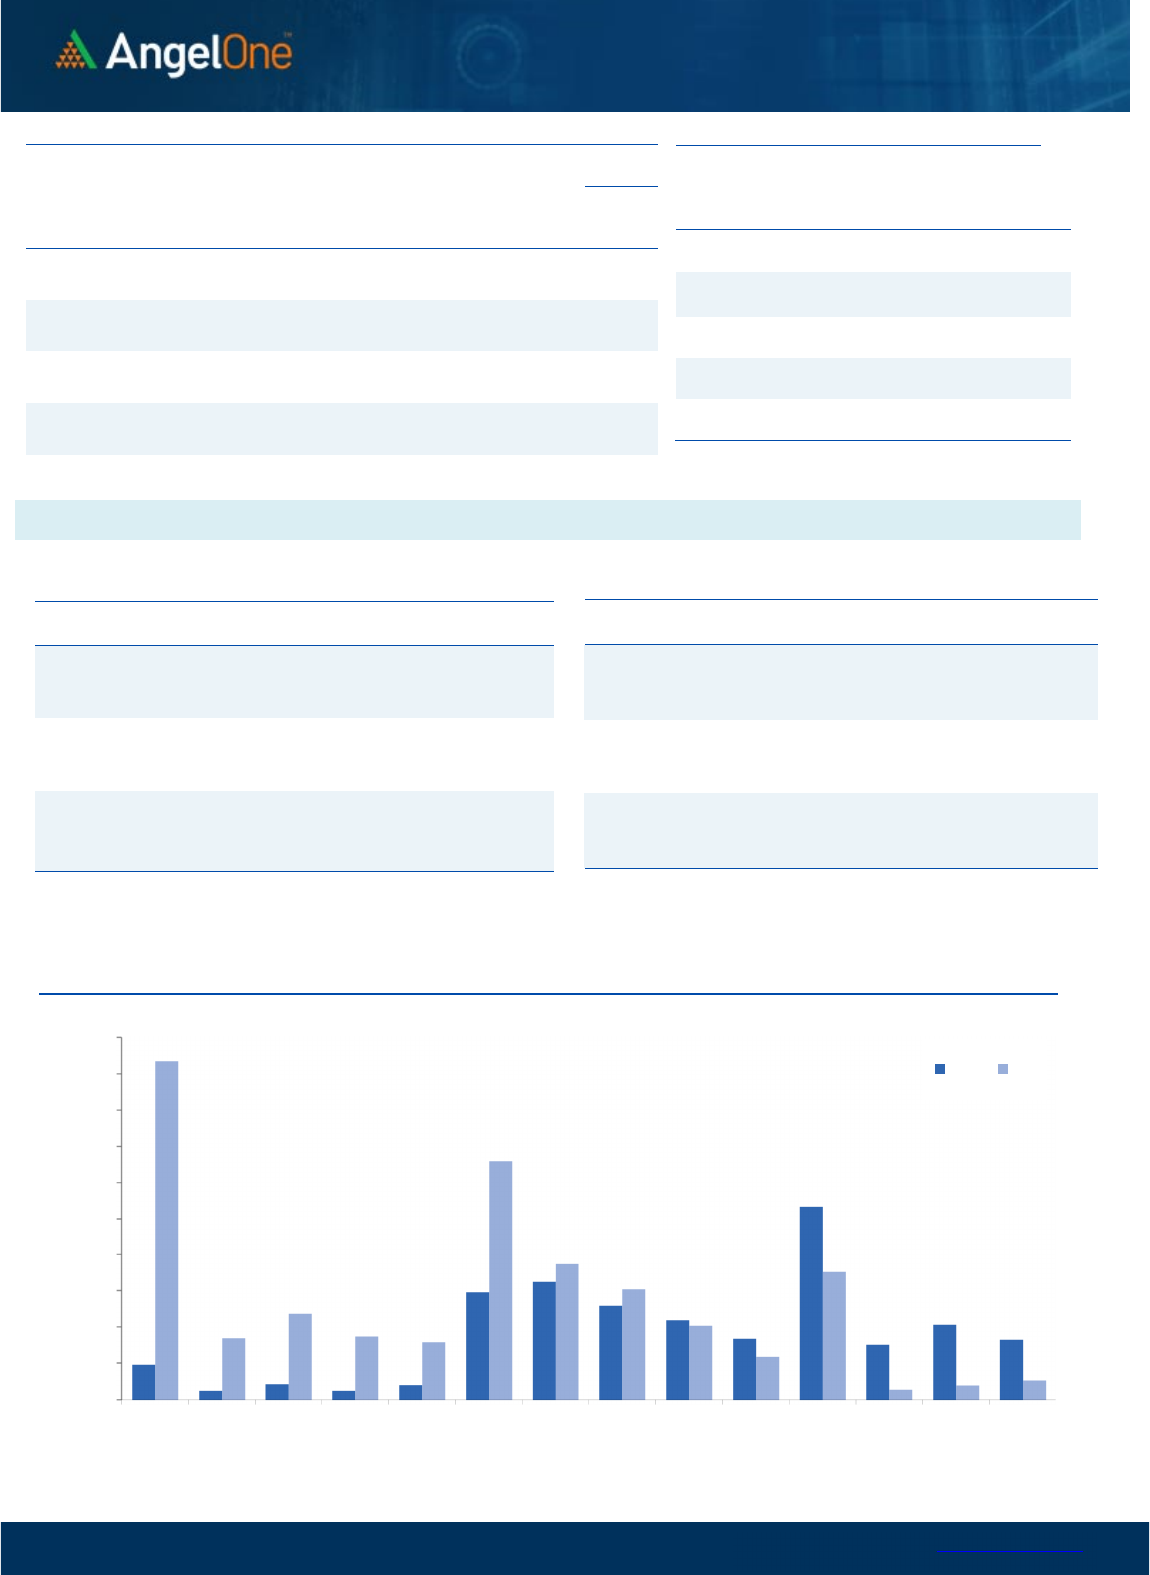
The bank index was the major culprit during the week as it dragged
the broader markets down. It was down around 3% on weekly basis
and ended a tad above the 39900 level.
Similar to the benchmark, the move during the February month for
the Banking space has been precisely within the trading range of
the Union Budget Day and after failing to surpass the 42000 levels
the prices have now slipped towards the lower range placed in the
vicinity of 39500. Now, prices are also placed around a key
ascending trend line support coinciding with 200SMA, where on
Thursday we saw a formation known as ‘Dragon Fly Doji’. Despite
the weakness on Friday, the low of this pattern is still intact, and
hence also considering the oversold conditions of major indicators,
we refrain from going fresh shorts at current levels. Going ahead,
we continue to see strong support in the zone of 39500 – 39300
levels whereas, on the flip side, we sense a sustained trade beyond
40200 – 40300 can trigger a smart bounce back. Traders are
advised to keep an eye on recent draggers from the banking space
that are trading around key supports, as they can certainly provide
better trading opportunities.
Key Levels
Support 1 – 39600 Resistance 1 – 40300
Support 2 – 39300 Resistance 2 – 40800
Exhibit 1: Nifty Daily Chart
Exhibit 2: Nifty Bank Daily Chart
Sensex (
59
464
) / Nifty (
1
7
466
)
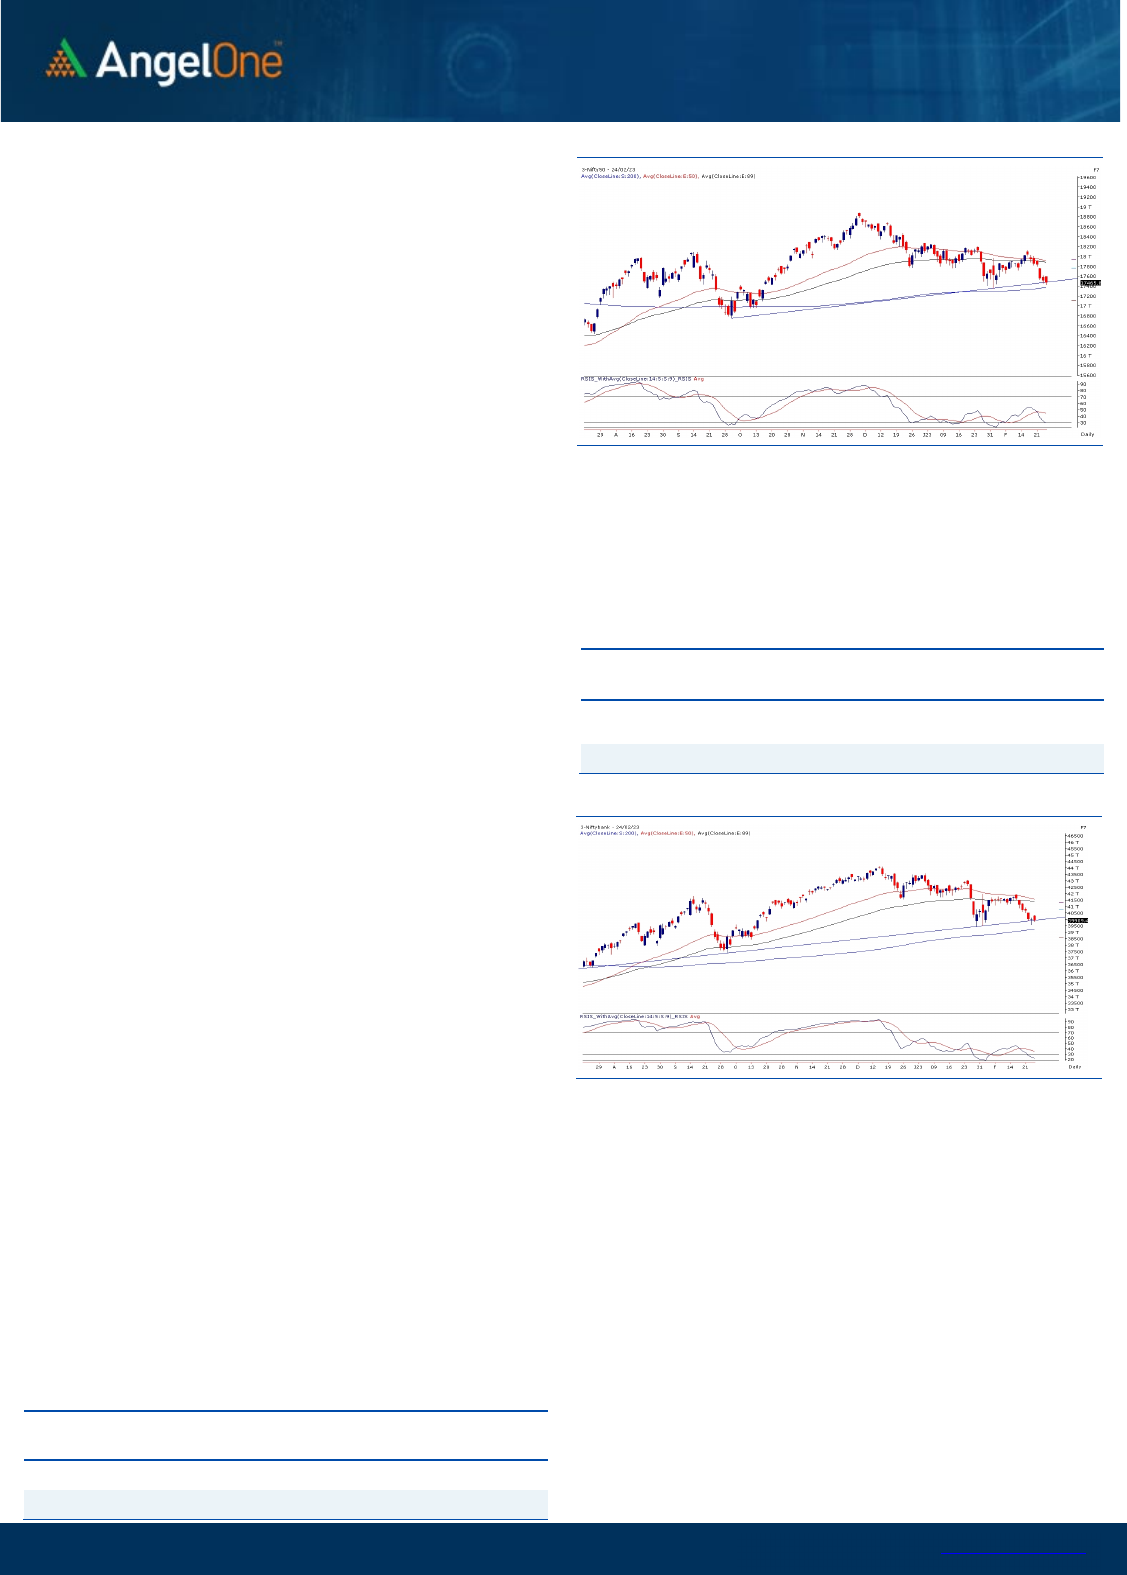
During the last week, the sell-off exaggerated once the 17800
support was broken and like a tumbling house of cards, there was
selling in the broader markets. After five days of continuous
weakness, the prices had the lowest close in the last four months to
end a tad above 17450 with a weekly loss of more than 2.5%
After the major traction seen on the Union Budget Day, the entire
February month has traded in a range and after failing to hold the
higher end of the range the prices have now slipped towards the
lower end of this range. Technically, if we see this lower end around
17400 – 17350 coincides with an ascending trendline and 200SMA
support. This set-up of support is visible in all the major indices and
hence the market is at a make-or-break level. Considering the
oversold conditions, we remain hopeful that this key support will be
defended and hence we refrain from creating fresh short positions
over here. If in case the support is broken, then the 17200 – 17100
would be the next support to watch out for, where one can pick
good quality propositions in a staggered manner.
Immediate resistance is seen around 17600 beyond which some
positive developments may trigger and for the tide to turn back
in the bulls' favor will have to close above 17800 on a sustained
basis. With global uncertainty, volatility is likely to remain on the
higher side and hence traders are advised to keep a tab on the
mentioned levels and trade accordingly.
Key Levels
Support 1 – 17400 Resistance 1 – 17600
Support 2 – 17350 Resistance 2 – 17700

www.angelone.in
Technical & Derivatives Report
FEB 27, 2023
View
The selling extended on Friday to end the week tad
above 17450 mark.
FIIs were net sellers in the cash market segment to
the tune of Rs. 1470 crores. Simultaneously, in Index
futures, they sold worth Rs. 260 crores with some fall
in open interest, indicating long unwinding.
During February series, we saw addition of shorts in
both the key indices. However, we saw open interest
addition series on series and especially banking index
which added more than 35%, suggesting decent
amount of positions have been rolled over to March
series. Stronger hands have been adding shorts and
they also preferred rolling over same hence their
index futures ‘Long Short Ratio’ declined to 18% from
23% on a weekly basis. The above data hints, decent
portion of shorts are intact in system and considering
FIIs LSR, we believe market is extremely oversold for
now. Hence, traders should lighten up shorts if any.
For now, 17600 strikes are attracting decent build-up
and surpassing of same should fuel the momentum
on the upside.
Comments
The Nifty futures open interest has decreased by 6.77%
and Bank Nifty futures open interest has increased by
37.19% as the market closed at 17465.80.
The Nifty March future closed with a premium of 90.45
point against a premium of 111.75 point in the last
trading session. The April series closed at a premium of
190.20 point.
The INDIA VIX decreased from 15.07 to 14.18. At the
same time, the PCR-OI of Nifty has decreased from 0.93
to 0.79.
Few of the liquid counters where we have seen high
cost of carry are COALINDIA, AARTIIND, CUB,
RAMCOCEM and CANBK.
Historical Volatility
SCRIP HV
GAIL 35.64
WHIRLPOOL 31.87
HINDALCO 48.15
SYNGENE 33.39
NATIONALUM 50.25
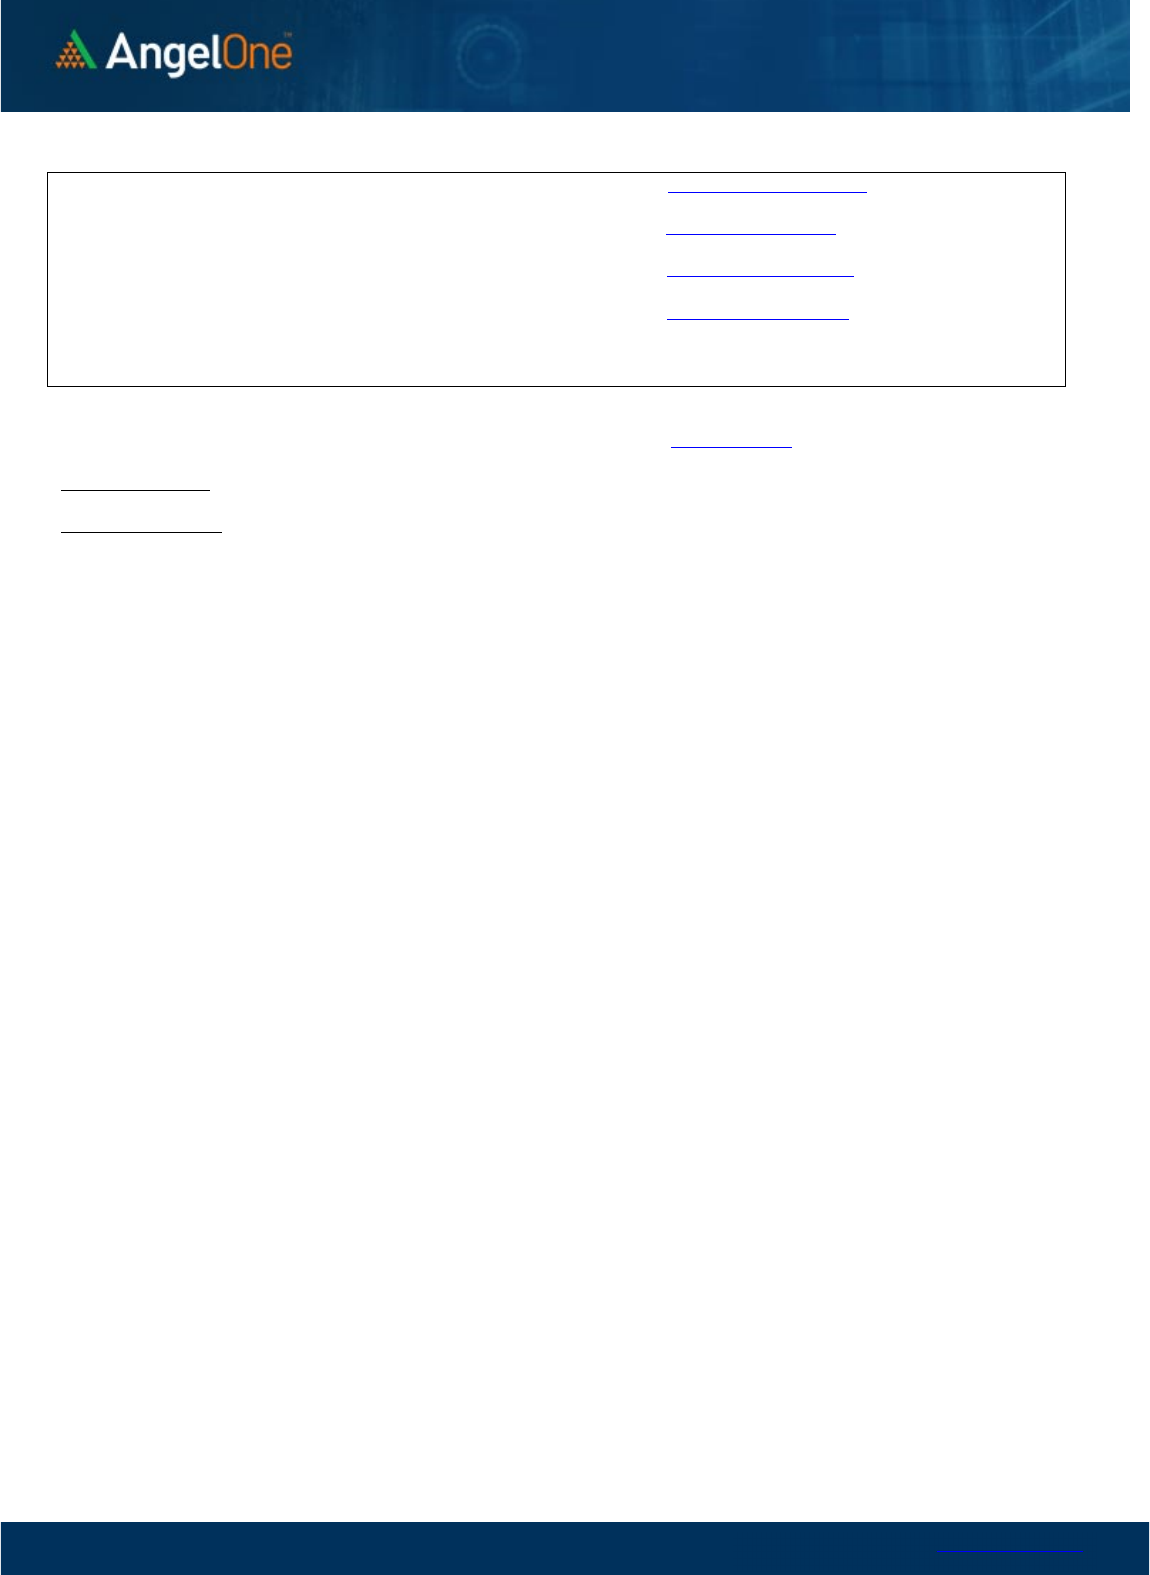
Nifty Vs OI
17400
17500
17600
17700
17800
17900
18000
18100
18200
4,000
6,000
8,000
10,000
12,000
14,000
16,000
2/2 2/7 2/9 2/13 2/15 2/17 2/22
Openinterest Nifty
OI Gainers
SCRIP OI
OI
CHG. (%)
PRICE
PRICE
CHG. (%)
GAIL 65797650 18.21 103.45 5.31
PEL 5861350 15.96 794.15 0.04
GNFC 8216000 12.38 551.70 5.05
ADANIENT 13792000 11.17 1315.55 -4.96
HDFCAMC 2521800 10.93 1815.25 2.57
ESCORTS 1068650 9.96 2016.00 -1.38
MPHASIS 1608750 6.73 2198.05 0.68
BERGEPAINT 6997100 6.67 558.05 -0.66
OI Losers
SCRIP OI
OI
CHG. (%)
PRICE
PRICE
CHG. (%)
ZEEL 73266000 -9.87 195.55 -1.80
AARTIIND 4340950 -5.93 537.00 2.82
ONGC 33121550 -5.61 155.00 2.57
ASHOKLEY 65185000 -5.34 141.30 0.32
VOLTAS 4494000 -4.76 895.20 -1.10
TECHM 10676400 -4.08 1119.00 -0.94
GLENMARK 4484850 -4.06 438.55 -2.00
APOLLOTYRE 11238500 -3.57 318.65 -3.02
Put-Call Ratio
SCRIP PCR (OI) PCR (VOL)
NIFTY 0.79 0.89
BANKNIFTY 0.62 0.99
RELIANCE 0.71 0.45
ICICIBANK 0.83 0.67
INFY 0.65 0.62
www.angelone.in
Technical & Derivatives Report
FEB 27, 2023
Note: Above mentioned Bullish or Bearish Spreads in Nifty (March Series) are given as an information and not as a recommendation.
Nifty Spot =
1
7
465.80
0900
Lot Size = 75
FII Statistics for
February
2
4
, 202
3
Detail Buy
Contracts
Open
Interest
Value
(in Cr.)
Sell
Net
CHANGE
INDEX
FUTURES
4870.69
5130.94
(260.25) 168553
15296.99
(1.45)
INDEX
OPTIONS
868160.95
871207.01
(3046.06) 2165380
194829.61
18.92
STOCK
FUTURES
8216.71
8355.08
(138.37) 2161898
140758.20
0.78
STOCK
OPTIONS
8465.24
8208.49
256.75
69503
4548.30
136.04
Total 889713.59
892901.52
(3187.93) 4565334
355433.10
9.57
Turnover
on
February
2
4
, 202
3
Instrumen
t
No. of
Contracts
Turnover
( in Cr. )
Change
(%)
Index Futures
388505
37011.53 -39.13
Index Options
1217549
33
47456.29 -26.88
Stock Futures
625299
39616.36 -71.09
Stock Options
2087576
2891.54 -1.09
Total
2,087,57
6
2891.54 -52.20
Bull-Call Spreads
Action Strike Price Risk Reward BEP
Buy
17500 280.15
55.55
44.45
17555.55
Sell
17600 224.60
Buy
17500 280.15
103.65
96.35
17603.65
Sell
17700 176.50
Buy
17600 224.60
48.10 51.90 17648.10
Sell
17700 176.50
Bear-Put Spreads
Action Strike Price Risk Reward BEP
Buy
17500 222.45
37.80
62.20
17462.20
Sell 17400 184.65
Buy 17500 222.45
71.45
128.55
17428.55
Sell
17300 151.00
Buy
17400 184.65
33.65 66.35 17366.35
Sell 17300 151.00
Nifty Put-Call Analysis
,0
500,000
1000,000
1500,000
2000,000
2500,000
3000,000
3500,000
4000,000
4500,000
5000,000
17000 17100 17200 17300 17400 17500 17600 17700 17800 17900 18000 18100 18200 18300
Call Put

www.angelone.in
Technical & Derivatives Report
FEB 27, 2023
`
Daily
Pivot Levels for Nifty Constituents
Scrips
S2
S1
PIVOT
R1
R2
ADANIENT
1,169
1,243
1,335
1,408
1,500
ADANIPORTS 533 546
556
569
579
APOLLOHOSP
4,362
4,416
4,451
4,505
4,540
ASIANPAINT
2,685
2,712
2,737
2,764
2,789
AXISBANK 840 846
850
856
860
BAJAJ-AUTO
3,811
3,831
3,853
3,872
3,894
BAJFINANCE
6,155
6,196
6,241
6,282
6,327
BAJAJFINSV
1,329
1,344
1,365
1,380
1,401
BPCL 313 315
319
321
324
BHARTIARTL 742 749
763
770
783
BRITANNIA
4,377
4,410
4,453
4,486
4,528
CIPLA 950 956
961
967
972
COALINDIA 214 215
216
218
219
DIVISLAB
2,830
2,873
2,922
2,965
3,014
DRREDDY
4,413
4,452
4,481
4,520
4,549
EICHERMOT
3,122
3,164
3,207
3,249
3,292
GRASIM
1,557
1,566
1,580
1,589
1,604
HCLTECH
1,071
1,083
1,094
1,106
1,116
HDFCBANK
1,565
1,577
1,597
1,610
1,630
HDFCLIFE
477
480
485
488
493
HDFC
2,541
2,559
2,588
2,607
2,636
HEROMOTOCO
2,465
2,475
2,492
2,502
2,519
HINDALCO 399 407
423
431
446
HINDUNILVR
2,450
2,467
2,489
2,506
2,528
ICICIBANK 830 835
840
845
850
INDUSINDBK
1,059
1,069
1,079
1,089
1,100
INFY
1,531
1,541
1,555
1,565
1,579
ITC 377 381
385
389
393
JSW STEEL 660 673
690
702
719
KOTAKBANK
1,675
1,686
1,705
1,716
1,735
LT
2,088
2,111
2,142
2,165
2,195
M&M
1,251
1,265
1,293
1,308
1,335
MARUTI
8,539
8,600
8,670
8,731
8,801
NESTLEIND
18,481
18,581
18,715
18,815
18,949
NTPC 169 170
171
172
172
ONGC 148 151
153
157
159
POWERGRID 211 213
214
216
217
RELIANCE
2,354
2,369
2,383
2,397
2,411
SBILIFE
1,105
1,113
1,128
1,137
1,151
SBIN 512 517
522
527
532
SUNPHARMA 953 962
973
981
992
TCS
3,354
3,377
3,406
3,429
3,457
TATACONSUM
709 713
717
720
725
TATAMOTORS 421 424
430
434
440
TATASTEEL 107 109
111
112
114
TECHM
1,100
1,110
1,125
1,135
1,150
TITAN
2,361
2,380
2,397
2,416
2,433
ULTRACEMCO
7,132
7,174
7,208
7,250
7,284
UPL 724 731
743
750
762
WIPRO 390 392
394
396
398
www.angelone.in
Technical & Derivatives Report
FEB 27, 2023
*
Technical and Derivatives Team:
Sameet Chavan Chief Analyst – Technical & Derivatives sameet.chavan@angelone.in
Sneha Seth Senior Analyst – Technical & Derivatives sneha.seth@angelone.in
Rajesh Bhosale Technical Analyst rajesh.bhosle@angelone.in
Osho Krishan Senior Analyst – Technical & Derivatives osho.krishan@angelone.in
Research Team Tel: 022 – 39357600 Website: www.angelone.in
For Technical Queries E-mail: technicalresearch-cso@angelone.in
For Derivatives Queries E-mail: derivatives.desk@angelone.in
DISCLAIMER
Angel One Limited (hereinafter referred to as “Angel”) is a registered Member of National Stock Exchange of India Limited, Bombay Stock Exchange
Limited and Metropolitan Stock Exchange Limited. It is also registered as a Depository Participant with CDSL and Portfolio Manager and investment
advisor with SEBI. It also has registration with AMFI as a Mutual Fund Distributor. Angel One Limited is a registered entity with SEBI for Research
Analyst in terms of SEBI (Research Analyst) Regulations, 2014 vide registration number INH000000164. Angel or its associates has not been
debarred/ suspended by SEBI or any other regulatory authority for accessing /dealing in securities Market.
This document is solely for the personal information of the recipient, and must not be singularly used as the basis of any investment decision.
Nothing in this document should be construed as investment or financial advice. Each recipient of this document should make such investigations
as they deem necessary to arrive at an independent evaluation of an investment in the securities of the companies referred to in this document
(including the merits and risks involved), and should consult their own advisors to determine the merits and risks of such an investment.
Angel or its associates or research analyst or his relative may have actual/beneficial ownership of 1% or more in the securities of the subject
company at the end of the month immediately preceding the date of publication of the research report. Neither Angel or its associates nor
Research Analysts or his relative has any material conflict of interest at the time of publication of research report.
Angel or its associates might have received any compensation from the companies mentioned in the report during the period preceding twelve
months from the date of this report for services in respect of managing or co-managing public offerings, corporate finance, investment banking or
merchant banking, brokerage services or other advisory service in a merger or specific transaction in the normal course of business. Angel or its
associates did not receive any compensation or other benefits from the companies mentioned in the report or third party in connection with the
research report. Neither Angel nor its research analyst entity has been engaged in market making activity for the subject company.
Reports based on technical and derivative analysis center on studying charts of a stock's price movement, outstanding positions and trading
volume, as opposed to focusing on a company's fundamentals and, as such, may not match with a report on a company's fundamentals. Investors
are advised to refer the Fundamental and Technical Research Reports available on our website to evaluate the contrary view, if any.
The information in this document has been printed on the basis of publicly available information, internal data and other reliable sources believed
to be true, but we do not represent that it is accurate or complete and it should not be relied on as such, as this document is for general guidance
only. Angel One Limited or any of its affiliates/ group companies shall not be in any way responsible for any loss or damage that may arise to any
person from any inadvertent error in the information contained in this report. Angel One Limited has not independently verified all the information
contained within this document. Accordingly, we cannot testify, nor make any representation or warranty, express or implied, to the accuracy,
contents or data contained within this document. While Angel One Limited endeavors to update on a reasonable basis the information discussed
in this material, there may be regulatory, compliance, or other reasons that prevent us from doing so.
This document is being supplied to you solely for your information, and its contents, information or data may not be reproduced, redistributed or
passed on, directly or indirectly.
Neither Angel One Limited, nor its directors, employees or affiliates shall be liable for any loss or damage that may arise from or in connection
with the use of this information. Angel or its associates or Research Analyst or his relative might have financial interest in the subject company.
Research analyst has not served as an officer, director or employee of the subject company.
