October
2
6
, 2023
www.angelone.in
Technical & Derivatives Report
8
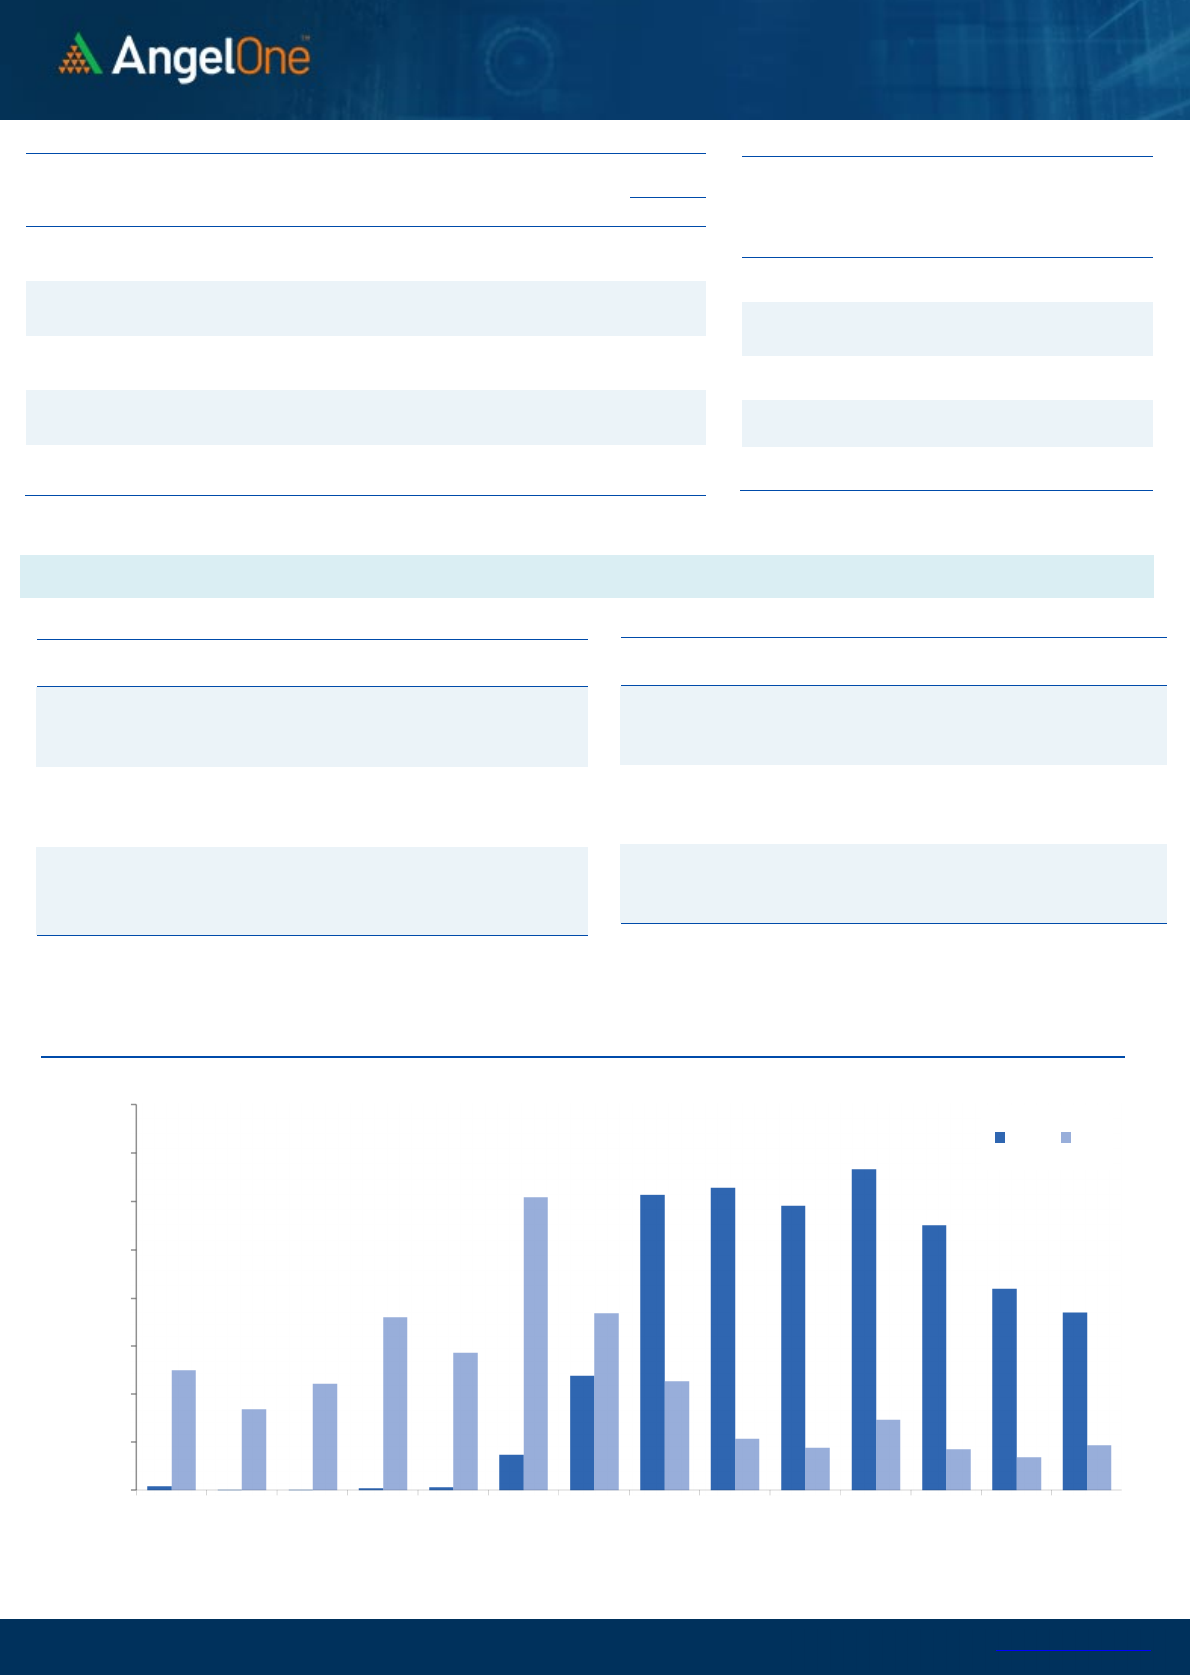
Nifty Bank Outlook (
4
2832
)
Bank Nifty started with a slight uptick, but following the recent trend,
participants used this opportunity to impose some selling pressure at
higher levels. Subsequently, the index continued to decline
throughout the day, forming a trended day. The intense selling halted
around the mid session followed by some consolidation for the
remainder of the day. Ultimately, Bank Nifty closed with a seven-
tenths of a percent cut.
At present, the index seems to be firmly under bear’s control. This is
evident, from the consistent formation of long red candles on its daily
chart. The outlook for monthly expiry is not at all promising, as there
is an expectation that bears are likely to maintain their dominance. On
its hourly chart, the index does exhibit an oversold reading, which may
provide intraday rebounds. It is advisable, that participants should
remain cautious, remain patient and be vigilant while navigating the
markets during period of extreme negative sentiments. The
psychological level of 43000 is likely to impose a stiff challenge;
whereas on the downside, support can be seen in the range of 42650-
42700. However, breaching these levels could indicate significant red
flags for the monthly expiry session.
Key Levels
Support 1 – 42700 Resistance 1 – 43000
Support 2 – 42500 Resistance 2 – 43200
Exhibit 1: Nifty Daily Chart
Exhibit 2: Nifty Bank Daily Chart
Sensex (
64
049
) / Nifty (
19
12
2
)
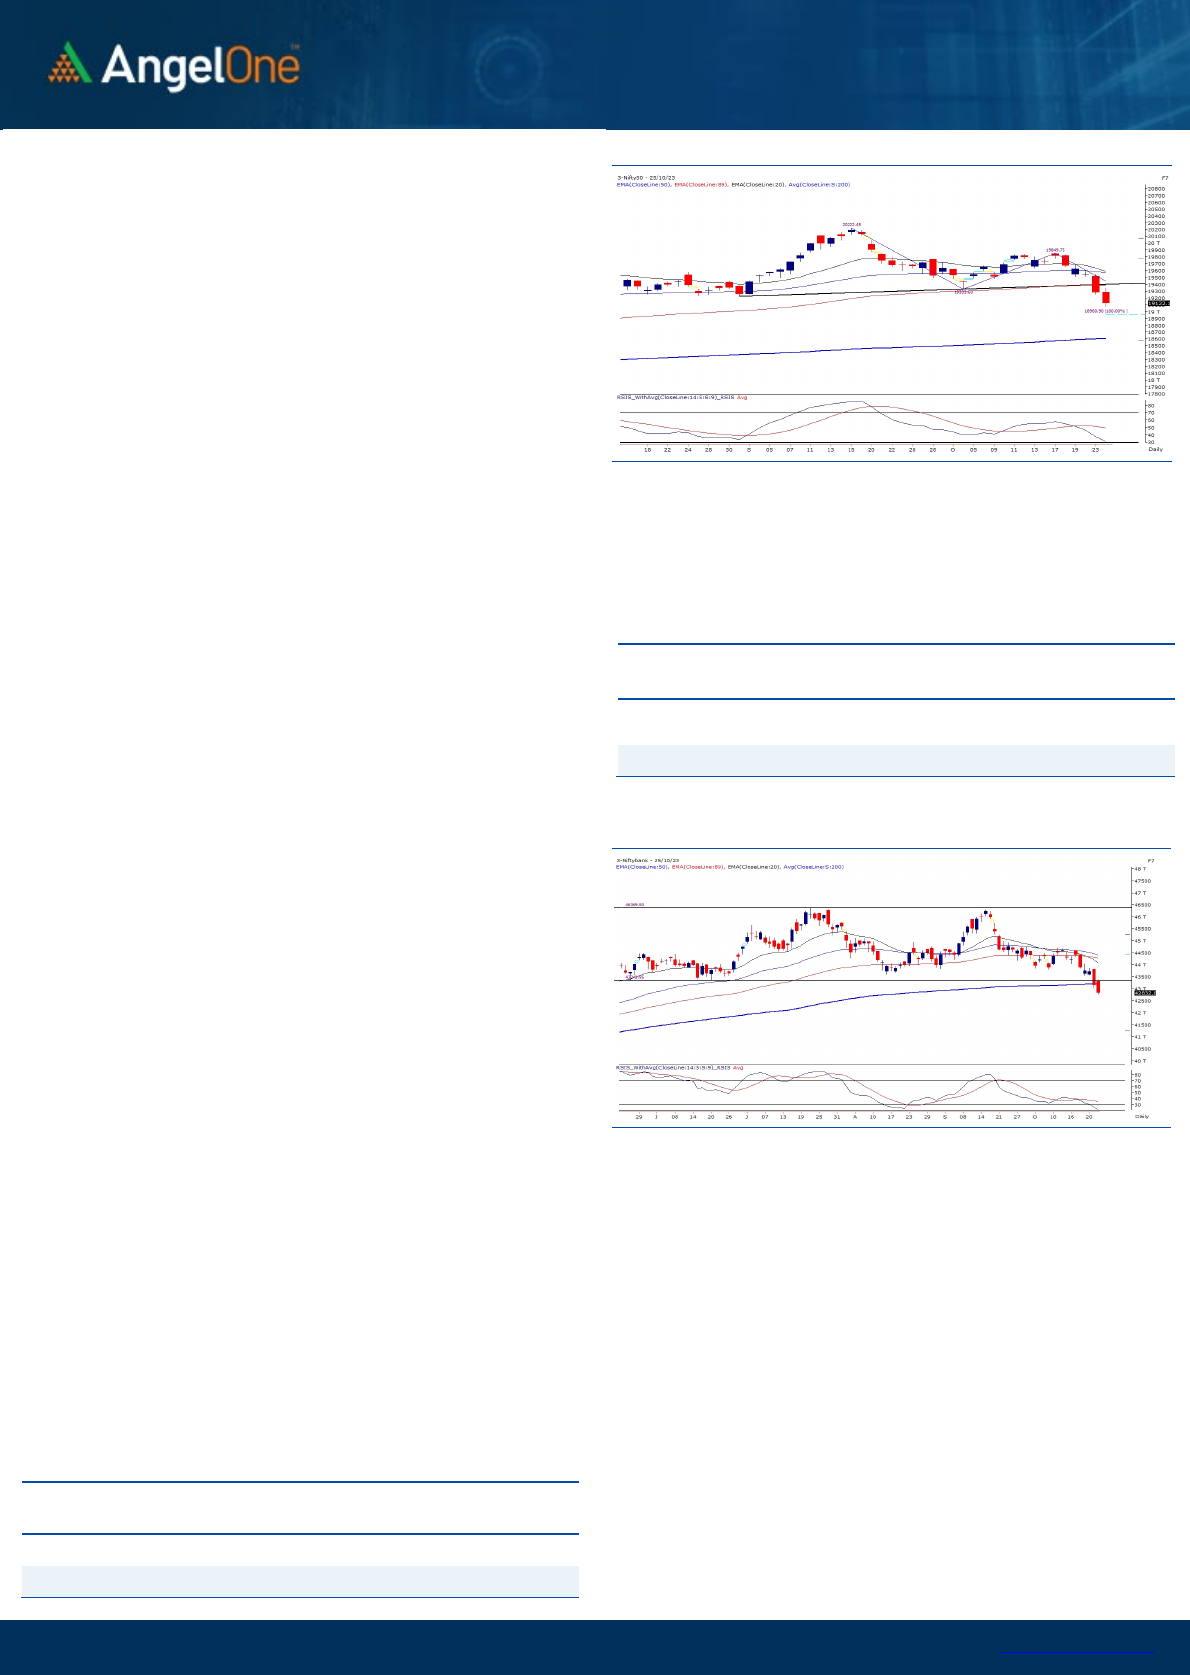
Following a mid-week holiday, the Nifty index commenced the trading
session with a slight negative note. In the initial hour, there were some
attempts for a rebound; however, the bears viewed this as an
opportunity, leading to a substantial price decline for the major part of
the session. During the final hour of trading, prices fluctuated within a
range, displaying a prevailing negative trend, eventually concluding
with a 0.83% cut, settling at 19122.
Bearish sentiment has taken a firm hold, with prices declining for the
fifth consecutive session, resulting in the erasing of more than 1,000
points from the all-time high levels, with approximately 400 points
being shed in just the past two sessions. The bearish momentum
appears to be dominating, and the outlook for the monthly expiry
suggests the likelihood of further weakness. Nevertheless, it's worth
noting that the hourly charts indicate oversold conditions, and with
prices nearing a psychological support level, one can avoid aggressive
sell bets at lower levels. It would be prudent to utilize any rebounds to
initiate short positions. On the monthly expiry, the range between
19000 - 18960 presents itself as a significant retracement support level,
while on the contrary, the range between 19250 and 19300 stands as
an immediate resistance zone.
In falling markets, it is advisable to exercise caution, as they can be
quite unforgiving, and it's often not wise to attempt to identify
support levels unless there are clear reversal signals. Additionally, it's
essential to maintain vigilance regarding geopolitical factors, as they
have the potential to exert a significant impact on market trends.
Key Levels
Support 1 – 19000 Resistance 1 – 19250
Support 2 – 18960 Resistance 2 – 19300

www.angelone.in
Technical & Derivatives Report
October
2
6
,
2023
View
Our market witnessed another day of intense sell-
off, wherein the benchmark index Nifty50 slipped for
the fifth consecutive session to conclude around the
19100 zone, shedding 0.83 percent.
FIIs were net sellers in the cash market segment to
the tune of Rs. 4237 cr. Simultaneously, they sold
worth Rs. 152 cr in Index futures with an increase in
open interest, indicating short formation.
On the derivatives front, we witnessed short
formation in the benchmark and long unwinding in
the banking index ahead of the expiry day. On the
options front, the highest piling of OI is seen at the
19000 put strike, suggesting an immediate support
zone. While 19200-19300 call strikes have a decent
piling of OI, suggesting an intermediate resistance.
The Long Short Ratio remains unchanged at around
26% on a weekly basis. Considering the recent
developments and the expiry day, markets are likely
to remain volatile and one needs to maintain caution
and avoid aggressive bets under the current oversold
market conditions.
Comments
The Nifty futures open interest has increased by 3.71%
and Bank Nifty futures open interest has decreased by
1.86% as the market closed at 19122.15.
The Nifty October future closed with a premium of 5.85
points against a discount of 12.55 points in the last
trading session. The November series closed at a
premium of 102.80 points.
The INDIA VIX has increased from 10.91 to 11.31. At the
same time, the PCR-OI of Nifty has decreased from 0.70
to 0.67.
A few of the liquid counters where we have seen high
cost of carry are SHRIRAMFIN, TORNTPHARM, CIPLA,
BHARATFORG and UBL.
Historical Volatility
SCRIP HV
IGL 38.30
MGL 37.19
HAVELLS 30.42
ITC 23.66
MPHASIS 37.68
Nifty Vs OI
18400
18600
18800
19000
19200
19400
19600
19800
20000
20200
9,000
10,000
11,000
12,000
13,000
14,000
10-6 10-10 10-13 10-17 10-20 10-25
Openinterest Nifty
OI Gainers
SCRIP OI
OI
CHG. (%)
PRICE
PRICE
CHG. (%)
TATACHEM 9843350 14.10 963.65 -1.46
NTPC 87066000 7.75 232.05 -1.57
SUNTV 9349500 7.48 634.55 0.22
IDFC 89370000 6.81 120.10 0.46
IBULHSGFIN 57849300 6.76 156.10 -0.70
MARUTI 3371200 5.68 10588.95 0.14
HINDALCO 28830200 5.19 461.25 1.07
BATAINDIA 1479375 4.48 1588.60 0.94
OI Losers
SCRIP OI
OI
CHG. (%)
PRICE
PRICE
CHG. (%)
IDFCFIRSTB 17600 -13.20 87.15 0.75
METROPOLIS 1806000 -11.12 1443.00 -2.46
RAMCOCEM 3481600 -10.80 982.00 0.47
RBLBANK 55345000 -10.71 225.45 -1.71
TVSMOTOR 7831600 -10.62 1574.85 -0.88
FEDERALBNK 107820000 -10.39 141.85 -1.15
IPCALAB 2674100 -9.42 993.60 -0.32
ONGC 40290250 -9.18 184.35 -0.35
Put-Call Ratio
SCRIP PCR (OI) PCR (VOL)
NIFTY 0.67 1.02
BANKNIFTY 0.51 1.08
RELIANCE 0.58 0.58
ICICIBANK 0.47 0.51
INFY 0.36 0.61
www.angelone.in
Technical & Derivatives Report
October
2
6
,
2023
Note: Above mentioned Bullish or Bearish Spreads in Nifty (Oct Series) are given as an information and not as a recommendation.
Nifty Spot =
19
122
.
1
5
FII Statistics for
October
2
5
, 2023
Detail Buy
Contracts
OI Value
(in Cr.)
Sell Net
CHANGE
INDEX
FUTURES
8459.02 8610.72 (151.70) 194442 15670.63 2.58
INDEX
OPTIONS
1571388.63 1541198.74 30189.89
5243279 416697.49 22.68
STOCK
FUTURES
62767.74 60613.10 2154.64
2394605 182556.30 (1.62)
STOCK
OPTIONS
12007.98 12761.56 (753.58) 157336 12328.41 (19.39)
Total
1654623.37
1623184.12
31439.25
7989662
627252.83
12.65
Turnover on
October
2
5
, 2023
Instrument
No. of
Contracts
Turnover
(in Cr.)
Change
(%)
Index Futures
556211 45922.09
30.02
Index Options
439407402
72098.43
37.93
Stock Futures
2811407 217262.81
-6.80
Stock Options
4417295 3317.65 -10.53
Total
44,17,295 3317.65 4.38
Bull-Call Spreads
Action Strike Price Risk Reward BEP
Buy
19200
126.95 75.15
24.85
19075.15
Sell
19300
73.75
Buy
19200 126.95 123.05
76.95
19123.05
Sell
19400 38.65
Buy
19300
73.75 47.90 52.10 19147.90
Sell
19400 38.65
Bear-Put Spreads
Action Strike Price Risk Reward BEP
Buy
19400 162.65
51.85
48.15
19148.15
Sell 19300 101.30
Buy 19400 162.65
79.50
120.50
19120.50
Sell
19200 56.95
Buy
19300 101.30
27.65 72.35 19072.35
Sell 19200 56.95
Nifty Put
-
Call Analysis
,0
2000,000
4000,000
6000,000
8000,000
10000,000
12000,000
14000,000
16000,000
18500 18600 18700 18800 18900 19000 19100 19200 19300 19400 19500 19600 19700 19800
Call Put

www.angelone.in
Technical & Derivatives Report
October
2
6
,
2023
`
Daily Pivot Levels for Nifty Constituents
Scrips S2 S1 PIVOT R1 R2
ADANIENT 2,167 2,212 2,280 2,325 2,393
ADANIPORTS 749 759 771 781 793
APOLLOHOSP 4,748 4,804 4,888 4,944 5,027
ASIANPAINT 3,018 3,039 3,074 3,095 3,130
AXISBANK 938 947 960 969 983
BAJAJ-AUTO 5,276 5,312 5,368 5,403 5,460
BAJFINANCE 7,562 7,628 7,742 7,809 7,923
BAJAJFINSV 1,582 1,597 1,613 1,628 1,645
BPCL 334 337 342 345 350
BHARTIARTL 906 915 927 935 948
BRITANNIA 4,414 4,474 4,530 4,590 4,645
CIPLA 1,132 1,145 1,167 1,179 1,201
COALINDIA 302 306 309 314 317
DIVISLAB 3,363 3,403 3,462 3,502 3,560
DRREDDY 5,430 5,472 5,542 5,584 5,654
EICHERMOT 3,322 3,353 3,400 3,431 3,477
GRASIM 1,838 1,858 1,889 1,909 1,940
HCLTECH 1,208 1,219 1,236 1,246 1,263
HDFCBANK 1,472 1,484 1,504 1,516 1,535
HDFCLIFE 597 607 617 627 638
HEROMOTOCO 3,053 3,097 3,134 3,178 3,215
HINDALCO 451 456 465 470 478
HINDUNILVR 2,452 2,465 2,477 2,490 2,502
ICICIBANK 898 907 920 929 943
INDUSINDBK 1,386 1,400 1,423 1,436 1,460
INFY 1,337 1,353 1,378 1,395 1,419
ITC 422 427 433 438 444
JSW STEEL 730 739 751 760 771
KOTAKBANK 1,698 1,713 1,737 1,753 1,777
LT 2,875 2,896 2,931 2,951 2,986
LTIMINDTREE 5,113 5,158 5,227 5,272 5,341
M&M 1,535 1,552 1,564 1,581 1,594
MARUTI 10,433 10,511 10,579 10,657 10,725
NESTLEIND 23,939 24,101 24,315 24,477 24,692
NTPC 224 228 232 236 240
ONGC 182 183 184 186 187
POWERGRID 197 198 199 201 202
RELIANCE 2,223 2,240 2,261 2,278 2,299
SBILIFE 1,286 1,300 1,323 1,337 1,360
SBIN 550 553 557 560 564
SUNPHARMA 1,104 1,112 1,121 1,129 1,138
TCS 3,350 3,370 3,397 3,418 3,445
TATACONSUM
877 883 889 896 901
TATAMOTORS 626 632 642 648 658
TATASTEEL 120 120 122 123 124
TECHM 1,119 1,130 1,148 1,160 1,178
TITAN 3,144 3,166 3,201 3,223 3,258
ULTRACEMCO 8,068 8,162 8,280 8,374 8,493
UPL 569 574 584 589 598
WIPRO 377 379 384 386 390

www.angelone.in
Technical & Derivatives Report
October
2
6
,
2023
Technical and Derivatives Team:
Sameet Chavan Head Research – Technical & Derivatives sameet.chavan@angelone.in
Sneha Seth Senior Analyst – Technical & Derivatives sneha.seth@angelone.in
Rajesh Bhosale Analyst - Technical rajesh.bhosle@angelone.in
Osho Krishan Senior Analyst – Technical & Derivatives osho.krishan@angelone.in
Hitesh Rathi Analyst – Technical & Derivatives hitesh.rathi@angelone.in
Research Team Tel: 022 – 39357600 Website: www.angelone.in
For Technical Queries E-mail: technicalresearch-cso@angelone.in
For Derivatives Queries E-mail: derivatives.desk@angelone.in
DISCLAIMER
We, Angel One Limited (hereinafter referred to as “Angel”) a company duly incorporated under the provisions of the Companies Act, 1956 with
its registered office at 601, 6th Floor, Ackruti Star, Central Road, MIDC, Andheri East, Mumbai – 400093, CIN: (L67120MH1996PLC101709) and
duly registered as a member of National Stock Exchange of India Limited, Bombay Stock Exchange Limited, Metropolitan Stock Exchange Limited,
Multi Commodity Exchange of India Ltd and National Commodity & Derivatives Exchange Ltd. Angel One limited is a company engaged in
diversified financial services business including securities broking, DP services, distribution of Mutual Fund products. It is also registered as a
Depository Participant with CDSL and Portfolio Manager and Investment Adviser with SEBI. It also has registration with AMFI as a Mutual Fund
Distributor. Angel One Limited is a registered entity with SEBI for Research Analyst in terms of SEBI (Research Analyst) Regulations, 2014 vide
registration number INH000000164 and also registered with PFRDA as PoP ,Registration No.19092018. Angel Group does not have any joint
ventures or associates. Angel One Limited is the ultimate parent company of the Group. Angel or its associates has not been debarred/ suspended
by SEBI or any other regulatory authority for accessing /dealing in securities Market.
AOL was merged with Angel Global Capital Private Limited and subsequently name of Angel Global Capital Private Limited was changed to Angel
Broking Private Limited (AOL) pursuant to scheme of Amalgamation sanctioned by the Hon'ble High Court of Judicature at Bombay by Orders
passed in Company Petition No 710 of 2011 and the approval granted by the Registrar of Companies. Further, name of Angel Broking Private
Limited again got changed to Angel Broking Limited (AOL) pursuant to fresh certificate of incorporation issued by Registrar of Companies (ROC)
dated June 28, 2018. Further name of Angel Broking name changed to Angel One Ltd pursuant to fresh certificate of incorporation issued by
Registrar of Companies (ROC) dated 23-09-21.
In case of any grievances please write to: support@angelone.in, Compliance Officer Details: Name : Hiren Thakkar, Tel No. –08657864228, Email
id - compliance@angelone.in
Registration granted by SEBI and certification from NISM in no way guarantee performance of the intermediary or provide any assurance of returns
to investors.
This document is solely for the personal information of the recipient, and must not be singularly used as the basis of any investment decision.
Nothing in this document should be construed as investment or financial advice. Each recipient of this document should make such investigations
as they deem necessary to arrive at an independent evaluation of an investment in the securities of the companies referred to in this document
(including the merits and risks involved), and should consult their own advisors to determine the merits and risks of such an investment.
Angel or its associates or research analyst or his relative may have actual/beneficial ownership of 1% or more in the securities of the subject
company at the end of the month immediately preceding the date of publication of the research report. Neither Angel or its associates nor
Research Analysts or his relative has any material conflict of interest at the time of publication of research report.
Angel or its associates might have received any compensation from the companies mentioned in the report during the period preceding twelve
months from the date of this report for services in respect of managing or co-managing public offerings, corporate finance, investment banking or
merchant banking, brokerage services or other advisory service in a merger or specific transaction in the normal course of business. Angel or its
associates did not receive any compensation or other benefits from the companies mentioned in the report or third party in connection with the
research report. Neither research entity nor research analyst has been engaged in market making activity for the subject company.

www.angelone.in
Technical & Derivatives Report
October
2
6
,
2023
*
Reports based on technical and derivative analysis center on studying charts of a stock's price movement, outstanding positions and trading
volume, as opposed to focusing on a company's fundamentals and, as such, may not match with a report on a company's fundamentals. Investors
are advised to refer the Fundamental and Technical Research Reports available on our website to evaluate the contrary view, if any.
The information in this document has been printed on the basis of publicly available information, internal data and other reliable sources believed
to be true, but we do not represent that it is accurate or complete and it should not be relied on as such, as this document is for general guidance
only. Angel One Limited or any of its affiliates/ group companies shall not be in any way responsible for any loss or damage that may arise to any
person from any inadvertent error in the information contained in this report. Angel One Limited does not warrant the accuracy, adequacy or
completeness of the service, information and materials and expressly disclaims liability for errors or omissions in the service, information and
materials. While Angel One Limited endeavours to update on a reasonable basis the information discussed in this material, there may be
regulatory, compliance, or other reasons that prevent us from doing so.
This document is being supplied to you solely for your information, and its contents, information or data may not be reproduced, redistributed or
passed on, directly or indirectly.
Neither Angel One Limited, nor its directors, employees or affiliates shall be liable for any loss or damage that may arise from or in connection
with the use of this information. Angel or its associates or Research Analyst or his relative might have financial interest in the subject company.
Research analyst has not served as an officer, director or employee of the subject company.
Investment in securities market are subject to market risks. Read all the related documents carefully before investing.
Any communication sent to clients on phone numbers or e-mail ids registered with the Trading Member is meant for client consumption and such
material should not be redistributed. Brokerage will not exceed SEBI prescribed limit. Any Information provided by us through any medium based
on our research or that of our affiliates or third parties or other external sources is subject to domestic and international market conditions and
we do not guarantee the availability or otherwise of any securities or other instruments and such Information is merely an estimation of certain
investments, and we have not and shall not be deemed to have assumed any responsibility for any such Information. You should seek independent
professional advice and/or tax advice regarding the suitability of any investment decision whether based on any Information provided by us
through the Site from inhouse research or third party reports or otherwise.
The report and information contained herein is strictly confidential and meant solely for the selected recipient and may not be altered in any way,
transmitted to, copied or distributed, in part or in whole, to any other person or to the media or reproduced in any form, without prior written
consent.
