September
2
6
, 2023
www.angelone.in
Technical & Derivatives Report
8
Nifty Bank Outlook (
4
4
766
)
Last week's correction was followed by a mild start for the monthly
expiry week; courtesy to mixed global cues. Post this, the banking
index had a decent decline; which represented an ideal opportunity
for buyers to step in and set the trend for the remainder of the day.
Prices thereafter swung to and fro, rising intermittently to only face
selling at higher prices; indicating an intense tug of war between bulls
and bears to reinforce their control. Amidst this engaging volatile day
of trend, Nifty Bank settled for the day above 44750; almost 154 points
higher from previous days close.
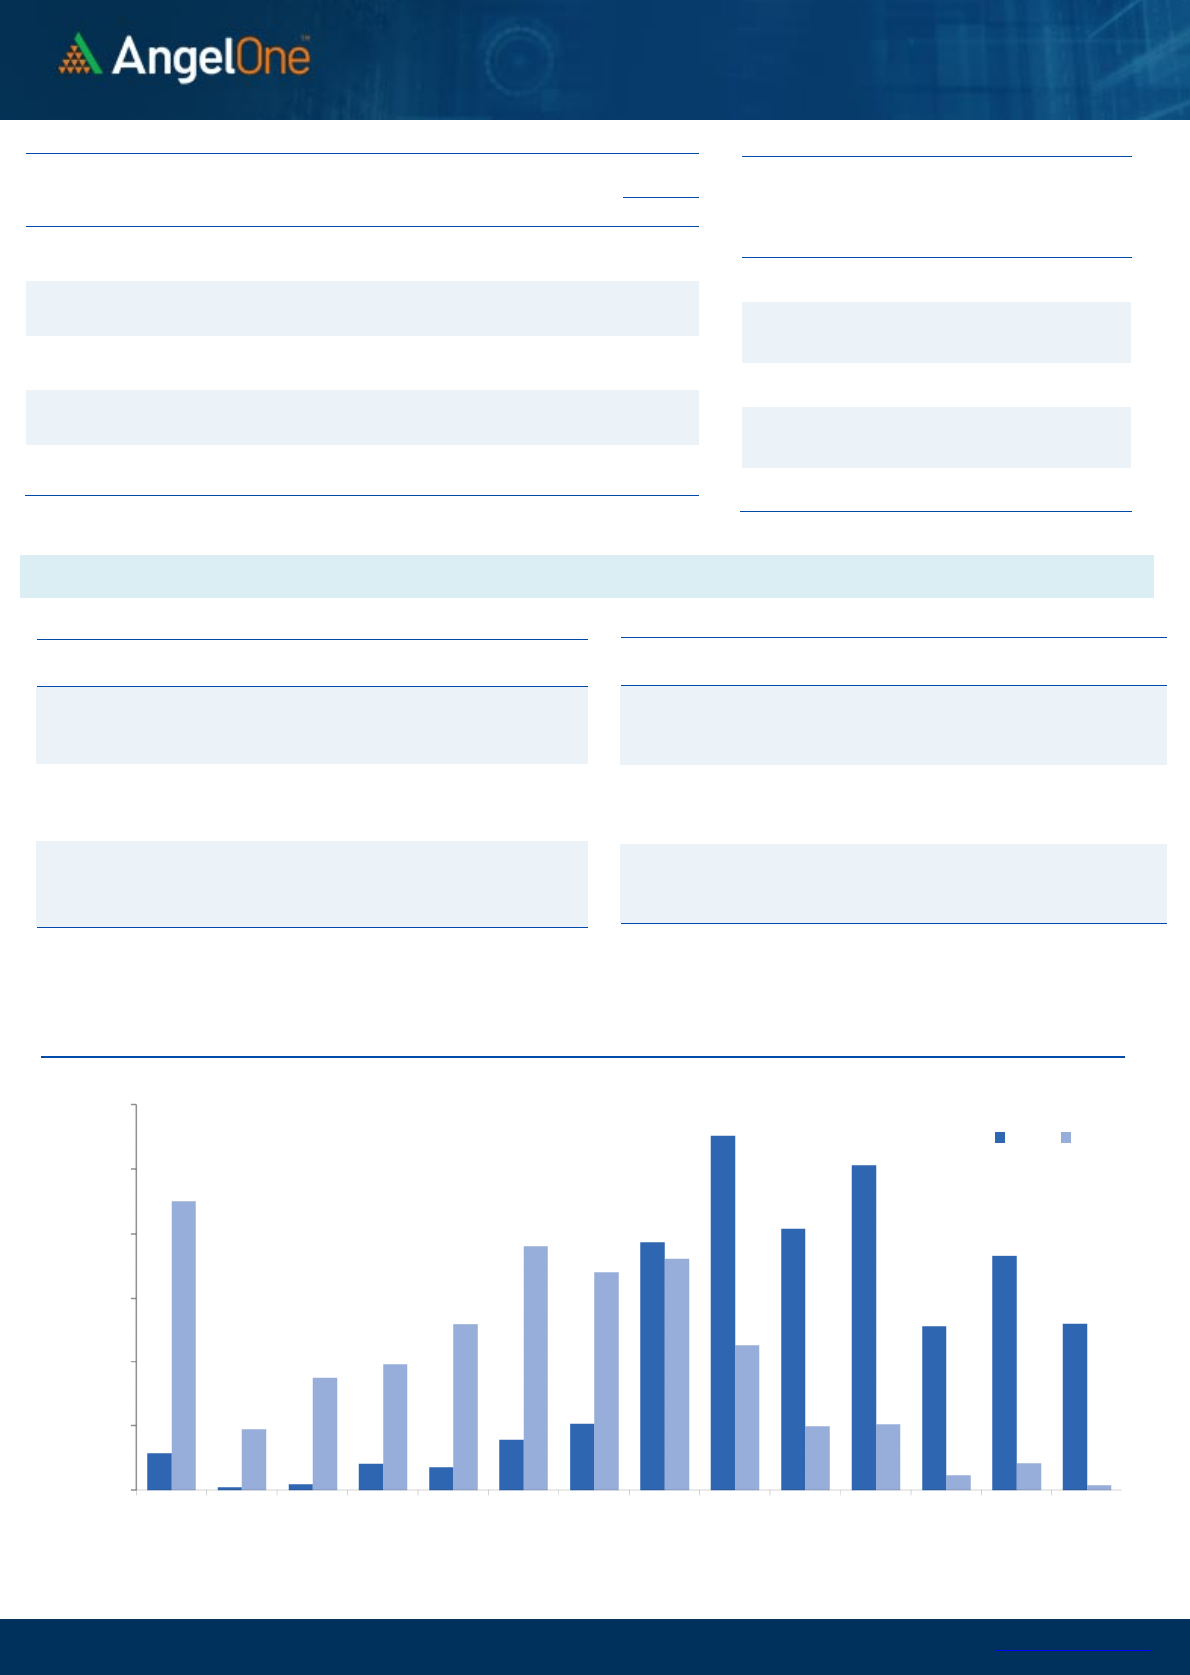
From a Technical standpoint, it appears to be a slight change post 4-
days of intensive sell-off last week. Prices for this heavyweight index,
have so far failed to facilitate trades to the downside on Friday and
yesterday as well, suggested by the fact that the index did not make a
sustained new low and have bounced back every time prices went
below the low of 44592.45 made on Thursday. However, despite this
slight change, a lot needs to be done from bulls if they are to assert
their control over Bank Nifty and to start with a close above the
psychological 45000 level would be very ideal.
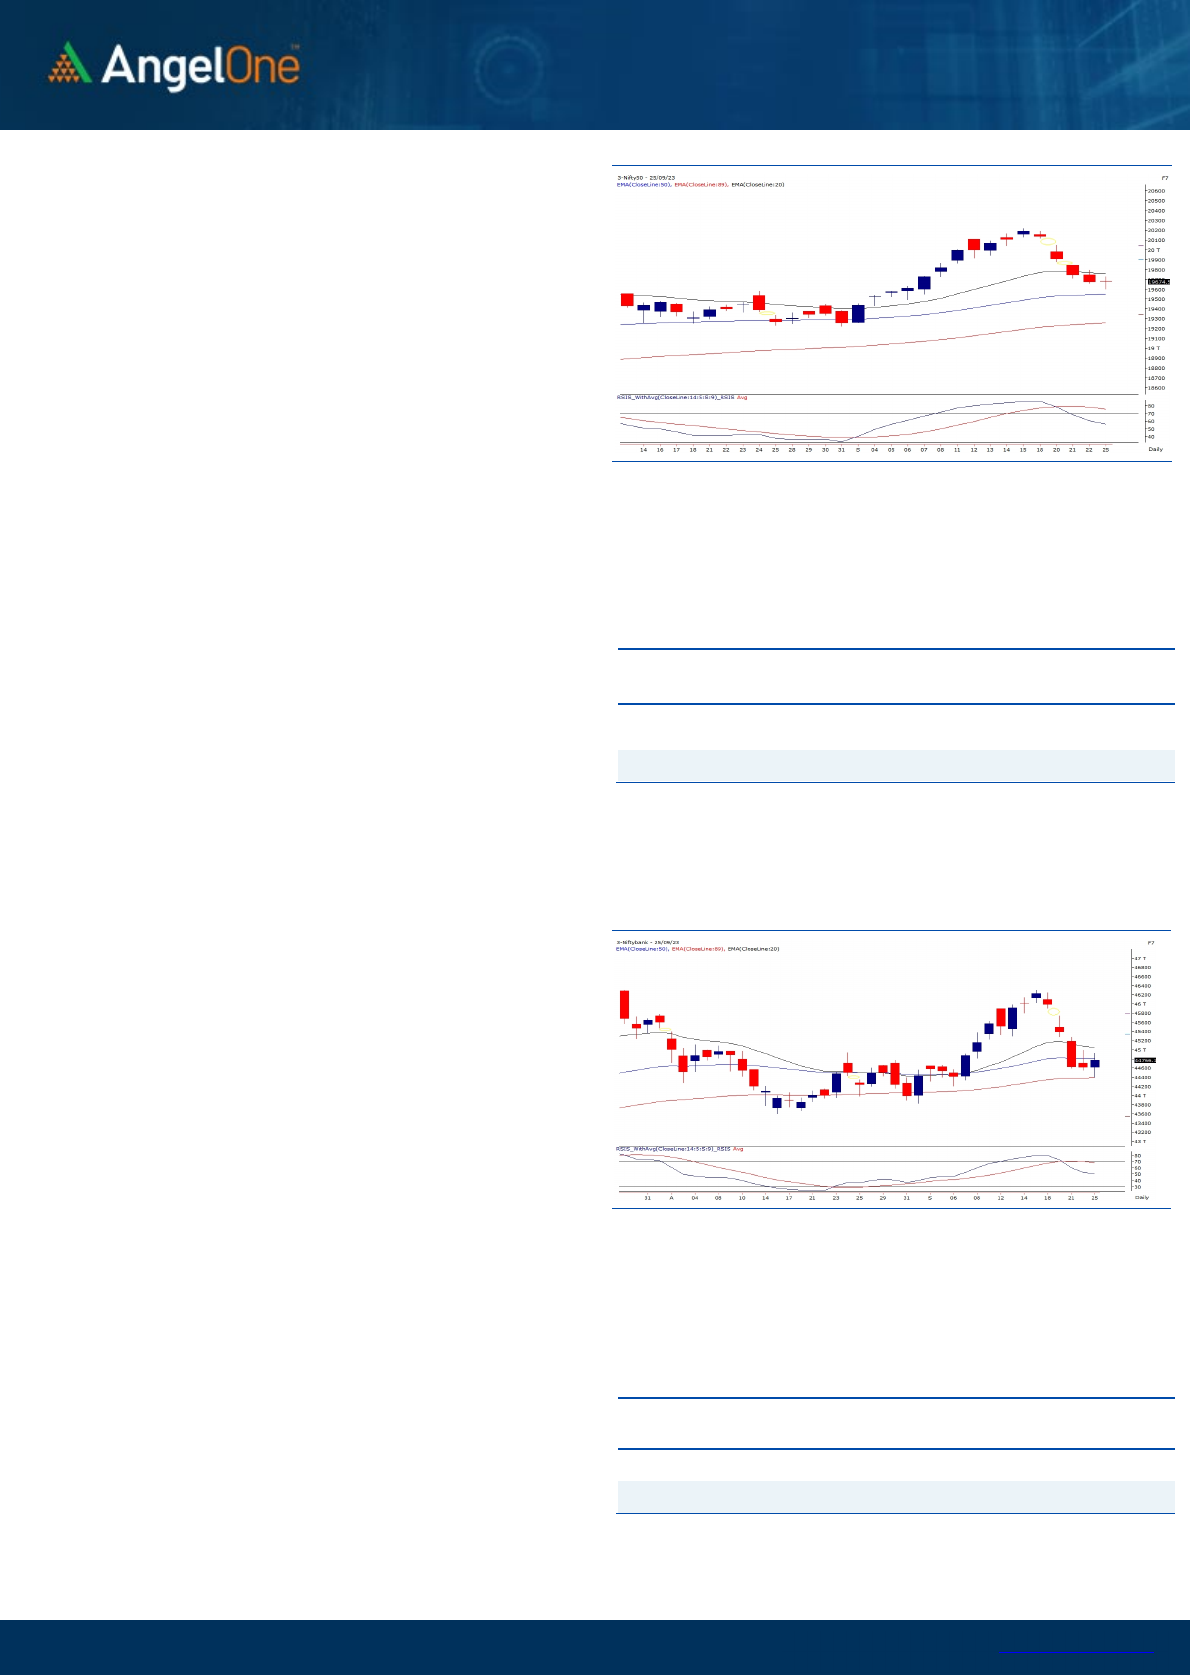
Exhibit 1: Nifty Daily Chart
Exhibit 2: Nifty Bank Daily Chart
Sensex (
6
6
0
24
) / Nifty (
19
67
5
)
The week began with a lack of significant movement, and as the day
progressed, the key index showed no clear direction. Prices
experienced volatile moves within a certain range and eventually
concluded near the opening level, displaying no major change from the
closing levels of Friday.
From a technical standpoint, there are no major noteworthy
alterations, although there was a bit of relief yesterday following the
sharp sell-off witnessed during the last week. Amid a tug-of-war
between bulls and bears within a tight range, prices formed a classic
'Doji' pattern, indicating uncertainty at the current levels. On the daily
chart, prices found support at 19600, which represents a convergence
of support derived from the 50SMA and a 61.8% retracement of the
recent rally. For the bulls to stage a comeback, they must safely defend
this level and potentially initiate a strong rebound in the days ahead.
With the market breadth improving and intraday indicators still
showing oversold conditions with positive divergence, there remains a
sense of optimism. However, it's essential to acknowledge that last
week's decline was disheartening, and the task of the bulls in regaining
control is formidable. Traders are advised to proceed cautiously and
take measured steps. Buying opportunities can be considered on price
dips, while profit-taking should be exercised at higher levels. In this
context, the immediate resistance levels are seen at 19800 to 19850,
whereas immediate support lies at 19600, followed by 19500.
Traders should monitor these levels closely and make their trading
decisions accordingly. Additionally, individual stocks in the midcap
segment displayed strength after the last week's turmoil, offering
potential for outperformance, making it worthwhile for traders to
focus on specific stock-related opportunities.
Key Levels
Support 1 – 19600 Resistance 1 – 19800
Support 2 – 19500 Resistance 2 – 19850
As far as levels are concerned, 45250-45300 is likely to resist any rise
and challenge the repair job from bulls. On the other hand, the zone
of 44200-44300 is likely to cushion any aggression from sellers.
Key Levels
Support 1 – 44300 Resistance 1 – 45250
Support 2 – 44200 Resistance 2 – 45300

www.angelone.in
Technical & Derivatives Report
September
2
6
, 2023
View
The Indian equity market witnessed a volatile day of
trade, wherein the benchmark index Nifty50 made
some strong whipsaw moves but settled on a muted
note, forming a ‘Doji’ on the daily time frame chart.
FIIs were net sellers in the cash market segment to
the tune of Rs. 2333 cr. Simultaneously, they sold
worth Rs. 1466 cr in Index futures with a fall in open
interest, suggesting short formation.
On the derivatives front, we witnessed a mixed trade
in key indices at the start of the expiry week. On the
options front, the 19500 put strike holds the highest
OI concentration, indicating strong support. On the
other side, the highest OI concentration stands at
19800 call strike, indicating the intermediate
resistance. Considering the mentioned data, the
benchmark index is likely to hover within the
mentioned range for the expiry week. Also, we would
advise traders to avoid aggressive bets for the time
being and stay selective with stock performance for
an outperformance.
Comments
The Nifty futures open interest has increased by 3.33%
and Bank Nifty futures open interest has increased by
6.67% as the market closed at 19674.55.
The Nifty September future closed with a premium of
25.95 points against 34 points in the last trading
session. The October series closed at a premium of
145.80 points.
The INDIA VIX has increased from 10.66 to 10.90. At the
same time, the PCR-OI of Nifty has decreased from 0.93
to 0.91.
A few of the liquid counters where we have seen high
cost of carry are DELTACORP, BERGEPAINT, MCX,
RAMCOCEM and BALRAMCHIN.
Historical Volatility
SCRIP HV
BERGEPAINT 29.56
CANBK 42.52
ZYDUSLIFE 28.74
GRANULES 38.28
DRREDDY 25.05
Nifty Vs OI
19200
19400
19600
19800
20000
20200
20400
20600
10,000
10,500
11,000
11,500
12,000
12,500
13,000
9-7 9-11 9-13 9-15 9-19 9-25
Openinterest Nifty
OI Gainers
SCRIP OI
OI
CHG. (%)
PRICE
PRICE
CHG. (%)
DALBHARAT 1731500 23.55 2337.25 3.73
PNB 273440000 16.77 80.20 3.55
GODREJPROP 4129175 14.43 1595.85 3.70
BALRAMCHIN 12747200 14.11 440.25 6.45
PERSISTENT 1165325 13.27 5917.40 1.23
BAJFINANCE 4582125 12.01 7819.80 4.69
ESCORTS 1757800 11.85 3235.05 3.68
TVSMOTOR 8311100 11.14 1515.55 1.01
OI Losers
SCRIP OI
OI
CHG. (%)
PRICE
PRICE
CHG. (%)
DELTACORP 17600 -18.91 142.80 -18.43
TATACHEM 8204900 -13.56 1045.30 0.86
CANBK 59861700 -12.27 375.05 -2.17
IRCTC 16408875 -11.11 689.20 4.09
HEROMOTOCO 4003200 -8.95 2974.70 -0.96
CUMMINSIND 5788800 -8.16 1736.25 0.83
GRANULES 13910000 -8.11 333.75 -1.30
M&MFIN 43000000 -7.25 300.10 -0.12
Put-Call Ratio
SCRIP PCR (OI) PCR (VOL)
NIFTY 0.91 0.90
BANKNIFTY 0.82 0.92
RELIANCE 0.46 0.48
ICICIBANK 0.40 0.50
INFY 0.45 0.54
www.angelone.in
Technical & Derivatives Report
September
2
6
, 2023
Note: Above mentioned Bullish or Bearish Spreads in Nifty (Sep Series) are given as an information and not as a recommendation.
Nifty Spot =
19
674.
55
FII Statistics for
September
2
5
, 2023
Detail Buy
Contracts
OI Value
(in Cr.)
Sell Net CHANGE
INDEX
FUTURES
4080.62 5546.64 (1466.02) 196388 16901.08 7.53
INDEX
OPTIONS
1282288.85 1281370.16 918.69
4485396 363940.42 7.66
STOCK
FUTURES
65447.53 63108.13 2339.40
2387137 189288.52 1.01
STOCK
OPTIONS
31762.22 31863.44 (101.22) 341788 27575.95 (4.56)
Total
1383579.22
1381888.37
1690.85
7410709
597705.97
4.81
Turnover on
September
2
5
, 2023
Instrument
No. of
Contracts
Turnover
(in Cr.)
Change
(%)
Index Futures
396791 32280.36
-11.60
Index
Options
396086557
62159.92
9.61
Stock Futures
2204365 179045.05
98.56
Stock
Options
5435263 3904.50 -15.55
Total
54,35,263
3904.50 47.53
Bull-Call Spreads
Action Strike Price Risk Reward BEP
Buy
19600 138.15
63.10
36.90
19663.10
Sell
19700 75.05
Buy
19600 138.15
103.45
96.55
19703.45
Sell
19800 34.70
Buy
19700 75.05
40.35 59.65 19740.35
Sell
19800 34.70
Bear-Put Spreads
Action Strike Price Risk Reward BEP
Buy
19800 134.30
59.75
40.25
19740.25
Sell 19700 74.55
Buy 19800 134.30
96.20
103.80
19703.80
Sell
19600 38.10
Buy
19700 74.55
36.45 63.55 19663.55
Sell 19600 38.10
Nifty Put
-
Call Analysis
,0
2000,000
4000,000
6000,000
8000,000
10000,000
12000,000
19000 19100 19200 19300 19400 19500 19600 19700 19800 19900 20000 20100 20200 20300
Call Put

www.angelone.in
Technical & Derivatives Report
September
2
6
, 2023
`
Daily Pivot Levels for Nifty Constituents
Scrips S2 S1 PIVOT R1 R2
ADANIENT 2,400 2,441 2,465 2,506 2,530
ADANIPORTS 813 819 825 832 838
APOLLOHOSP 4,921 5,009 5,061 5,149 5,202
ASIANPAINT 3,246 3,285 3,310 3,348 3,373
AXISBANK 996 1,007 1,017 1,028 1,038
BAJAJ-AUTO 4,952 4,979 5,019 5,046 5,087
BAJFINANCE 7,387 7,603 7,727 7,943 8,066
BAJAJFINSV 1,527 1,552 1,572 1,597 1,616
BPCL 346 349 351 354 357
BHARTIARTL 897 904 909 915 920
BRITANNIA 4,481 4,525 4,555 4,600 4,630
CIPLA 1,164 1,172 1,185 1,192 1,205
COALINDIA 278 283 286 291 294
DIVISLAB 3,660 3,694 3,722 3,756 3,784
DRREDDY 5,357 5,398 5,469 5,510 5,581
EICHERMOT 3,350 3,369 3,399 3,417 3,448
GRASIM 1,885 1,913 1,929 1,957 1,973
HCLTECH 1,243 1,253 1,267 1,277 1,290
HDFCBANK 1,517 1,524 1,532 1,539 1,548
HDFCLIFE 632 637 645 650 658
HEROMOTOCO 2,934 2,955 2,989 3,009 3,043
HINDALCO 460 465 472 476 483
HINDUNILVR 2,439 2,457 2,479 2,497 2,518
ICICIBANK 933 945 953 965 973
INDUSINDBK 1,423 1,433 1,444 1,454 1,464
INFY 1,460 1,467 1,479 1,485 1,497
ITC 435 439 442 445 448
JSW STEEL 770 775 779 784 788
KOTAKBANK 1,744 1,764 1,777 1,797 1,809
LT 2,846 2,874 2,899 2,927 2,952
LTIMINDTREE 5,300 5,338 5,399 5,437 5,498
M&M 1,560 1,575 1,597 1,612 1,635
MARUTI 10,423 10,505 10,613 10,695 10,803
NESTLEIND 22,342 22,490 22,599 22,748 22,857
NTPC 236 238 239 241 242
ONGC 184 185 186 186 187
POWERGRID 195 197 199 201 203
RELIANCE 2,320 2,330 2,345 2,356 2,371
SBILIFE 1,257 1,276 1,308 1,326 1,359
SBIN 584 589 595 600 606
SUNPHARMA 1,112 1,118 1,128 1,133 1,143
TCS 3,524 3,551 3,585 3,612 3,647
TATACONSUM
857 879 892 914 927
TATAMOTORS 613 616 621 623 628
TATASTEEL 125 126 127 128 129
TECHM 1,285 1,292 1,303 1,311 1,322
TITAN 3,233 3,259 3,287 3,312 3,340
ULTRACEMCO 8,090 8,148 8,214 8,272 8,338
UPL 607 612 618 623 630
WIPRO 408 411 415 419 423

www.angelone.in
Technical & Derivatives Report
September
2
6
, 2023
Technical and Derivatives Team:
Sameet Chavan Head Research – Technical & Derivatives sameet.chavan@angelone.in
Sneha Seth Senior Analyst – Technical & Derivatives sneha.seth@angelone.in
Rajesh Bhosale Analyst - Technical rajesh.bhosle@angelone.in
Osho Krishan Senior Analyst – Technical & Derivatives osho.krishan@angelone.in
Hitesh Rathi Analyst – Technical & Derivatives hitesh.rathi@angelone.in
Research Team Tel: 022 – 39357600 Website: www.angelone.in
For Technical Queries E-mail: technicalresearch-cso@angelone.in
For Derivatives Queries E-mail: derivatives.desk@angelone.in
DISCLAIMER
We, Angel One Limited (hereinafter referred to as “Angel”) a company duly incorporated under the provisions of the Companies Act, 1956 with
its registered office at 601, 6th Floor, Ackruti Star, Central Road, MIDC, Andheri East, Mumbai – 400093, CIN: (L67120MH1996PLC101709) and
duly registered as a member of National Stock Exchange of India Limited, Bombay Stock Exchange Limited, Metropolitan Stock Exchange Limited,
Multi Commodity Exchange of India Ltd and National Commodity & Derivatives Exchange Ltd. Angel One limited is a company engaged in
diversified financial services business including securities broking, DP services, distribution of Mutual Fund products. It is also registered as a
Depository Participant with CDSL and Portfolio Manager and Investment Adviser with SEBI. It also has registration with AMFI as a Mutual Fund
Distributor. Angel One Limited is a registered entity with SEBI for Research Analyst in terms of SEBI (Research Analyst) Regulations, 2014 vide
registration number INH000000164 and also registered with PFRDA as PoP ,Registration No.19092018. Angel Group does not have any joint
ventures or associates. Angel One Limited is the ultimate parent company of the Group. . Angel or its associates has not been debarred/ suspended
by SEBI or any other regulatory authority for accessing /dealing in securities Market.
AOL was merged with Angel Global Capital Private Limited and subsequently name of Angel Global Capital Private Limited was changed to Angel
Broking Private Limited (AOL) pursuant to scheme of Amalgamation sanctioned by the Hon'ble High Court of Judicature at Bombay by Orders
passed in Company Petition No 710 of 2011 and the approval granted by the Registrar of Companies. Further, name of Angel Broking Private
Limited again got changed to Angel Broking Limited (AOL) pursuant to fresh certificate of incorporation issued by Registrar of Companies (ROC)
dated June 28, 2018. Further name of Angel Broking name changed to Angel One Ltd pursuant to fresh certificate of incorporation issued by
Registrar of Companies (ROC) dated 23-09-21.
In case of any grievances please write to: support@angelone.in, Compliance Officer Details: Name : Hiren Thakkar, Tel No. –08657864228, Email
id - compliance@angelone.in
Registration granted by SEBI and certification from NISM in no way guarantee performance of the intermediary or provide any assurance of returns
to investors.
This document is solely for the personal information of the recipient, and must not be singularly used as the basis of any investment decision.
Nothing in this document should be construed as investment or financial advice. Each recipient of this document should make such investigations
as they deem necessary to arrive at an independent evaluation of an investment in the securities of the companies referred to in this document
(including the merits and risks involved), and should consult their own advisors to determine the merits and risks of such an investment.
Angel or its associates or research analyst or his relative may have actual/beneficial ownership of 1% or more in the securities of the subject
company at the end of the month immediately preceding the date of publication of the research report. Neither Angel or its associates nor
Research Analysts or his relative has any material conflict of interest at the time of publication of research report.
Angel or its associates might have received any compensation from the companies mentioned in the report during the period preceding twelve
months from the date of this report for services in respect of managing or co-managing public offerings, corporate finance, investment banking or
merchant banking, brokerage services or other advisory service in a merger or specific transaction in the normal course of business. Angel or its
associates did not receive any compensation or other benefits from the companies mentioned in the report or third party in connection with the
research report. Neither research entity nor research analyst has been engaged in market making activity for the subject company.

www.angelone.in
Technical & Derivatives Report
September
2
6
, 2023
*
Reports based on technical and derivative analysis center on studying charts of a stock's price movement, outstanding positions and trading
volume, as opposed to focusing on a company's fundamentals and, as such, may not match with a report on a company's fundamentals. Investors
are advised to refer the Fundamental and Technical Research Reports available on our website to evaluate the contrary view, if any.
The information in this document has been printed on the basis of publicly available information, internal data and other reliable sources believed
to be true, but we do not represent that it is accurate or complete and it should not be relied on as such, as this document is for general guidance
only. Angel One Limited or any of its affiliates/ group companies shall not be in any way responsible for any loss or damage that may arise to any
person from any inadvertent error in the information contained in this report. Angel One Limited does not warrant the accuracy, adequacy or
completeness of the service, information and materials and expressly disclaims liability for errors or omissions in the service, information and
materials. While Angel One Limited endeavours to update on a reasonable basis the information discussed in this material, there may be
regulatory, compliance, or other reasons that prevent us from doing so.
This document is being supplied to you solely for your information, and its contents, information or data may not be reproduced, redistributed or
passed on, directly or indirectly.
Neither Angel One Limited, nor its directors, employees or affiliates shall be liable for any loss or damage that may arise from or in connection
with the use of this information. Angel or its associates or Research Analyst or his relative might have financial interest in the subject company.
Research analyst has not served as an officer, director or employee of the subject company.
Investment in securities market are subject to market risks. Read all the related documents carefully before investing.
Any communication sent to clients on phone numbers or e-mail ids registered with the Trading Member is meant for client consumption and such
material should not be redistributed. Brokerage will not exceed SEBI prescribed limit. Any Information provided by us through any medium based
on our research or that of our affiliates or third parties or other external sources is subject to domestic and international market conditions and
we do not guarantee the availability or otherwise of any securities or other instruments and such Information is merely an estimation of certain
investments, and we have not and shall not be deemed to have assumed any responsibility for any such Information. You should seek independent
professional advice and/or tax advice regarding the suitability of any investment decision whether based on any Information provided by us
through the Site from inhouse research or third party reports or otherwise.
The report and information contained herein is strictly confidential and meant solely for the selected recipient and may not be altered in any way,
transmitted to, copied or distributed, in part or in whole, to any other person or to the media or reproduced in any form, without prior written
consent.
