October
2
5
, 2023
www.angelone.in
Technical & Derivatives Report
8
Nifty Bank Outlook (
4
3
151
)
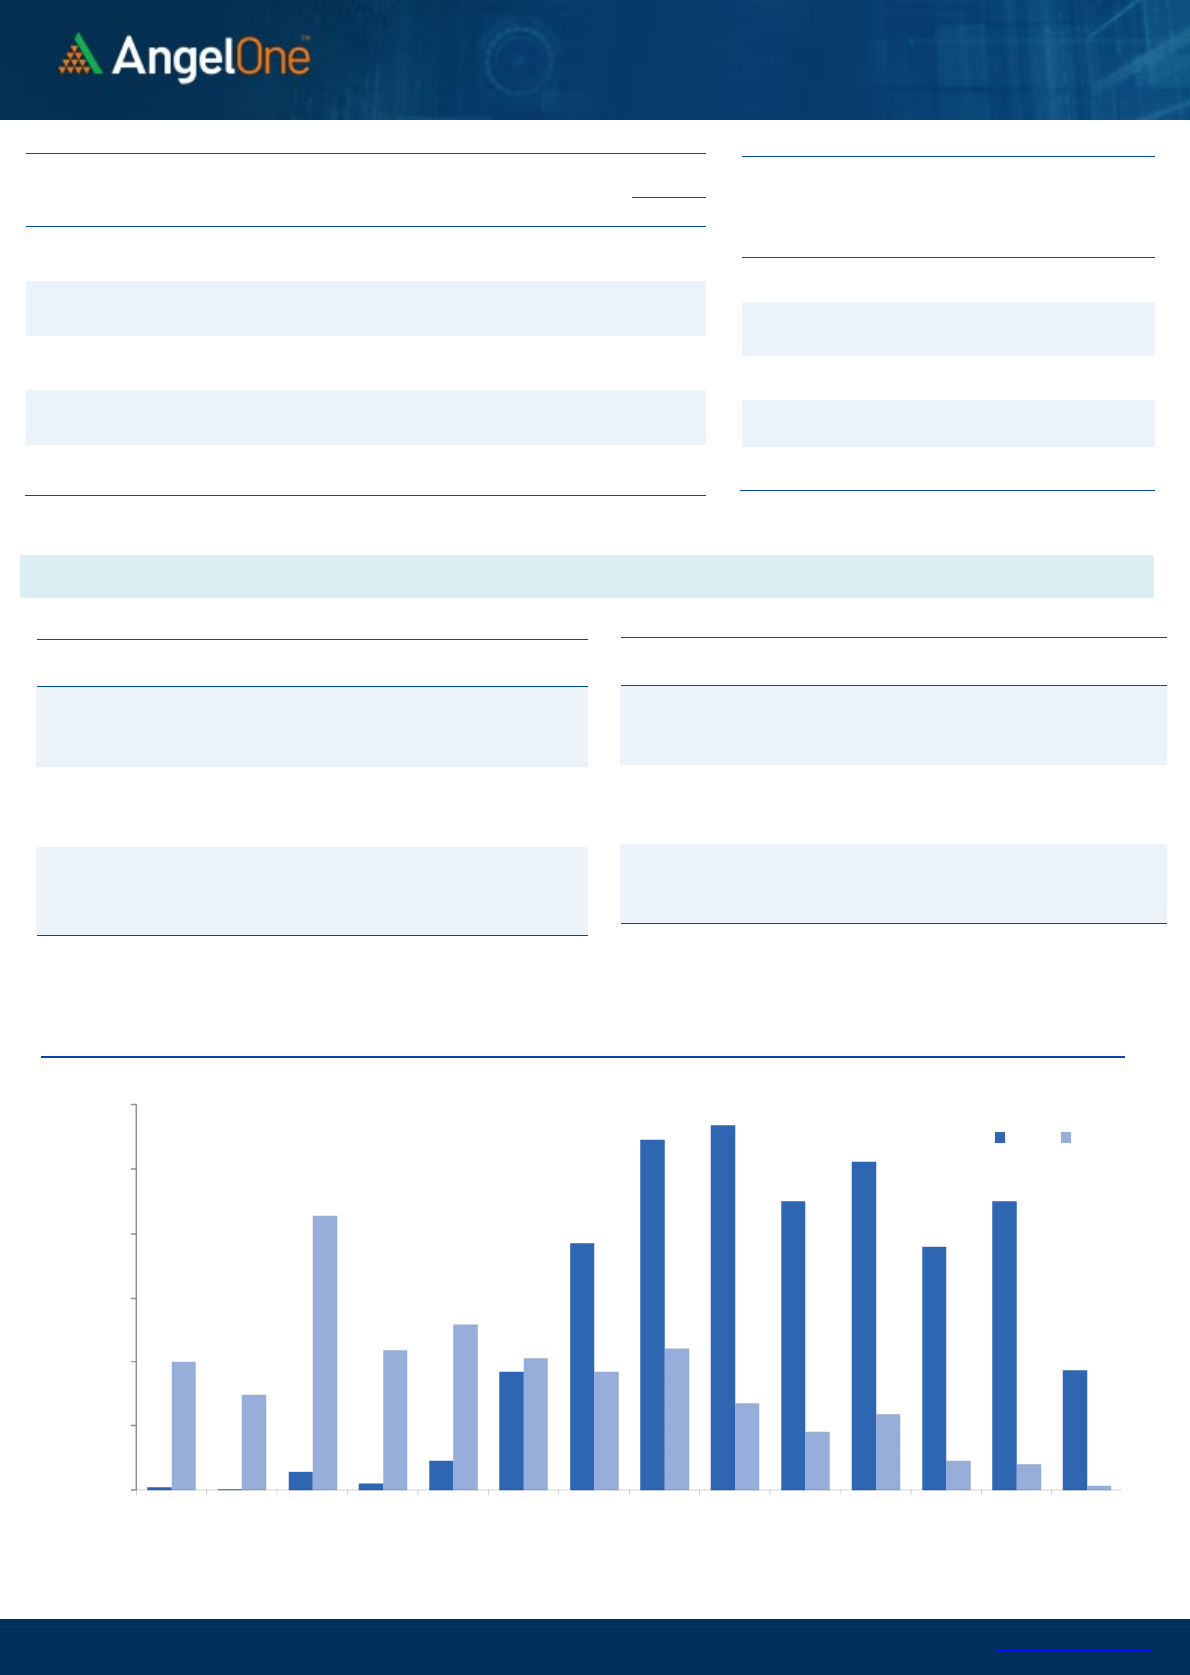
Bank Nifty began trading for this curtailed week on a subdued note, as
the index, along with all other major indices opened with a gap down.
However, the index post open did attempt to close the gap, which
ultimately proved futile. Afterward, the index spent some time
consolidating around day’s highs, before gradually moving lower,
culminating in a significant downward plunge to end the day. At one
point in the second half, the BANKNIFTY fell like a bottomless pit,
leading the index breaking below its key support clusters. Eventually,
the index ended the day, a touch below 43200 levels, marking a loss
of 1.31 percent for the day.
Monday’s move in this rate-sensitive index, validates our recent
bearish stance in Bank Nifty. The index has now breached key levels,
suggesting a likelihood of extended weakness in days ahead. A further
testament to this consistent weakness in Bank Nifty is the formation
of a long red candlestick on its daily chart. Additionally, the index has
also dipped below its significant long term 200-day SMA. Applying the
principles of polarity, former support zones are now expected to
function as resistance, impeding any effort by bulls to recover lost
grounds. Consequently, the index is likely to encounter obstacles
across the 43800-43900 band, in the short run.
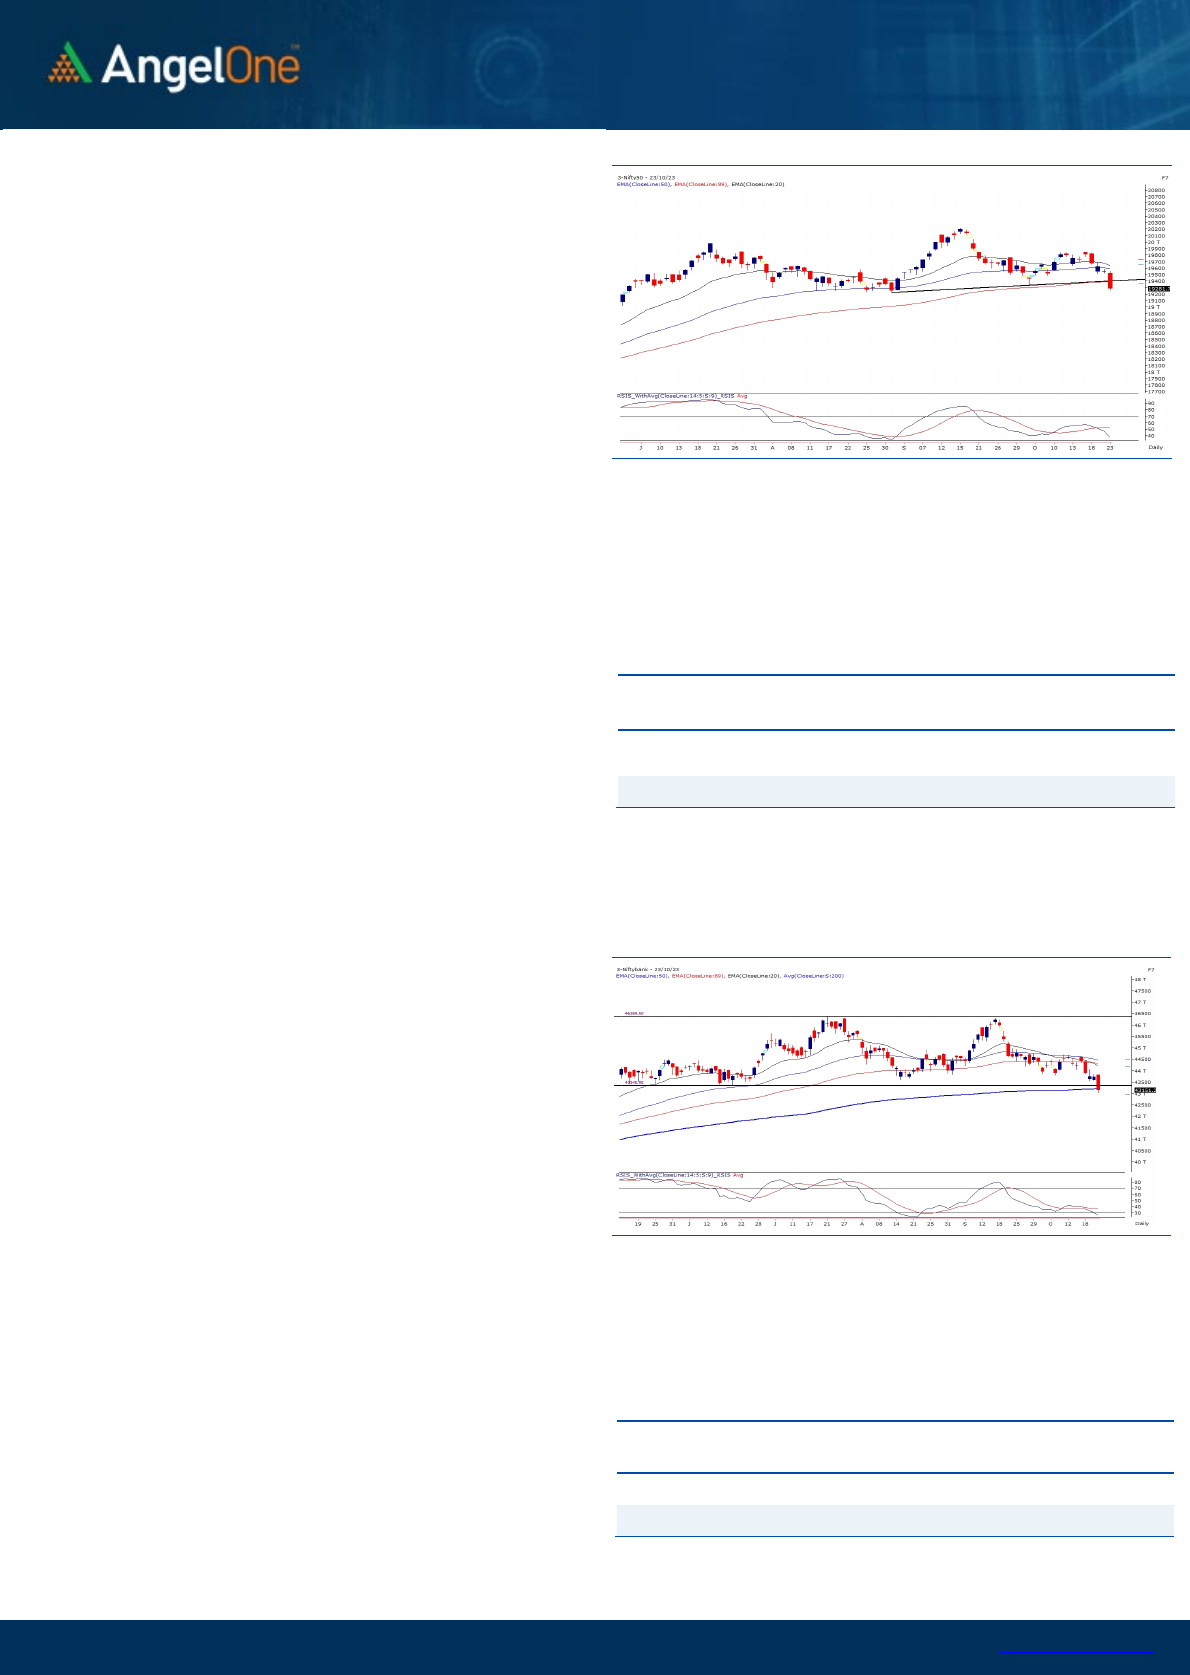
Exhibit 1: Nifty Daily Chart
Exhibit 2: Nifty Bank Daily Chart
Sensex (
64572
) /
Nifty (
19
282
)
Our market had a slightly muted start to the week and in fact, in the
initial trades, the market was showing some resilience. But in such a
kind of geopolitical uncertainty, prices tend to react adversely to any
negative development globally. As the day progressed, the initial selling
turned into a massive broader market destruction to eventually end the
session with a sharp cut of 1.34%, importantly closing below the 19300
mark.
Bears dominated the trading session, leading to breaching of some
critical supports. Of late, we have been maintaining our cautious stance
on the market and have been repeatedly advising against creating
aggressive long positions. The preemption has now become a
confirmation of short-term breakdown in the market, which certainly
does not bode well for the bulls. On the daily chart, prices have formed
a "Lower Top Lower Bottom" formation, signaling a bearish cycle, and
they have also broken below a crucial trend line support. Additionally,
prices have skidded below the key '89-EMA' for the first time since
April. These developments are unfavorable in the short term, and we
expect this tentativeness to continue. We will not be surprised to see
prices even hastening towards 19000 – 18960 in the near term. Hence,
until we observe clear signs of a bullish reversal, it is advisable not to
catch a falling market. During this period, any bounce should be seen
as an opportunity to exit long positions and establish short positions. In
this context, the range of 19380 - 19450 is likely to serve as immediate
resistance.
Last week, we mentioned the emergence of weakness in the midcap
segment, which had been a bright spot in recent months. However,
on Monday, they experienced significant selling pressure, and we
recommend traders to remain cautious in this space moving
forward. It's also crucial to stay vigilant regarding geopolitical
factors, as they can exert a substantial influence on market trends.
Key Levels
Support 1 – 19150 Resistance 1 – 19380
Support 2 – 19000 Resistance 2 – 19450
Conversely, with the breach of key levels and change of trend
indicated by the formation of lower highs and lower lows, support
levels are now like quicksand. As far as immediate supports are
concerned, 42750-42700 are to be treated as next levels.
Key Levels
Support 1 – 43000 Resistance 1 – 43500
Support 2 – 42700 Resistance 2 – 43800

www.angelone.in
Technical & Derivatives Report
October
2
5
,
2023
View
The market witnessed an intense day of sell-off,
wherein the benchmark index succumbed to the
rising global geopolitical uncertainties and slipped
below the 19300 zone, shedding around 1.34
percent at the start of the expiry week.
FIIs were net buyers in the cash market segment to
the tune of Rs. 252 cr. Simultaneously, they sold
worth Rs. 328 cr in Index futures with an increase in
open interest, indicating short formation.
On the derivatives front, we witnessed short
formation in the benchmark and long unwinding in
the banking index at the start of the expiry week. On
the options front, Put writers have shifted positions
at 19200-19000. While significant piling of OI is seen
at 19500-19400 call strikes, suggesting an
intermediate resistance. The Long Short Ratio
remains unchanged at around 26%. Considering the
recent price actions, we would advocate avoiding
bottom fishing and contradictory bets. Meanwhile, it
is crucial to stay vigilant regarding geopolitical
developments and stay light on positions.
Comments
The Nifty futures open interest has increased by 2.31%
and Bank Nifty futures open interest has decreased by
2.93% as the market closed at 19281.75.
The Nifty October future closed with a discount of
12.55 points against a discount of 14.80 points in the
last trading session. The November series closed at a
premium of 99.60 points.
The INDIA VIX has increased from 10.82 to 10.91. At the
same time, the PCR-OI of Nifty has decreased from 0.90
to 0.70.
A few of the liquid counters where we have seen high
cost of carry are LAURUSLABS, IPCALAB, ABFRL,
HINDCOPPER and IBULHSGFIN.
Historical Volatility
SCRIP HV
IGL 38.31
MGL 37.27
HAVELLS 30.44
ITC 23.70
MPHASIS 37.77
Nifty Vs OI
18800
19000
19200
19400
19600
19800
20000
20200
9,000
10,000
11,000
12,000
13,000
14,000
10-5 10-9 10-12 10-16 10-18 10-23
Openinterest Nifty
OI Gainers
SCRIP OI
OI
CHG. (%)
PRICE
PRICE
CHG. (%)
HDFCAMC 4461600 13.07 2828.95 -1.56
PERSISTENT 1441825 12.37 5806.35 -1.39
BALKRISIND 2342700 12.36 2566.90 1.25
IPCALAB 2952300 10.11 998.75 6.42
MUTHOOTFIN 7104350 9.98 1280.30 0.35
SBICARD 11241600 9.16 774.90 -1.83
GNFC 9785100 8.65 652.80 -1.02
MRF 50040 8.12 108972.45 -0.33
OI Losers
SCRIP OI
OI
CHG. (%)
PRICE
PRICE
CHG. (%)
M&MFIN 17600 -19.59 272.80 -2.05
ATUL 492300 -11.93 6391.70 -3.53
LTIM 1508100 -10.92 5201.75 -4.07
COROMANDEL 1209600 -9.95 1110.45 -2.74
LAURUSLABS 19094400 -8.81 362.40 -7.52
KOTAKBANK 26298400 -8.68 1740.75 -1.71
ONGC 44363550 -8.61 184.85 -0.65
VOLTAS 7770000 -8.38 821.25 0.65
Put-Call Ratio
SCRIP PCR (OI) PCR (VOL)
NIFTY 0.70 0.90
BANKNIFTY 0.51 0.90
RELIANCE 0.54 0.54
ICICIBANK 0.46 0.45
INFY 0.37 0.47
www.angelone.in
Technical & Derivatives Report
October
2
5
,
2023
Note: Above mentioned Bullish or Bearish Spreads in Nifty (Oct Series) are given as an information and not as a recommendation.
Nifty Spot =
19
281
.
7
5
FII Statistics for
October
2
3
, 2023
Detail Buy
Contracts
OI Value
(in Cr.)
Sell Net
CHANGE
INDEX
FUTURES
6457.26 6784.89 (327.63) 189554 15118.21 2.02
INDEX
OPTIONS
1500917.54 1515528.35 (14610.81) 4273793 340516.67 14.63
STOCK
FUTURES
91605.20 85233.05 6372.15
2433997 186718.01 0.19
STOCK
OPTIONS
27093.25 26753.07 340.18
195189 15492.68 (20.26)
Total
1626073.25
1634299.36
(8226.11) 7092533
557845.57
7.65
Turnover on
October
2
3
, 2023
Instrument
No. of
Contracts
Turnover
(in Cr.)
Change
(%)
Index Futures
439855 35320.26
37.38
Index Options
440410797
52271.28
-2.14
Stock Futures
2958459 233103.78
133.03
Stock Options
5650057 3708.21 -9.80
Total
56,50,057 3708.21 77.01
Bull-Call Spreads
Action Strike Price Risk Reward BEP
Buy
19200
126.95 53.20
46.80
19253.20
Sell
19300
73.75
Buy
19200 126.95 88.30
111.70
19288.30
Sell
19400 38.65
Buy
19300
73.75 35.10 64.90 19335.10
Sell
19400 38.65
Bear-Put Spreads
Action Strike Price Risk Reward BEP
Buy
19400 162.65
61.35
38.65
19338.65
Sell 19300 101.30
Buy 19400 162.65
105.70
94.30
19294.30
Sell
19200 56.95
Buy
19300 101.30
44.35 55.65 19255.65
Sell 19200 56.95
Nifty Put
-
Call Analysis
,0
2000,000
4000,000
6000,000
8000,000
10000,000
12000,000
18800 18900 19000 19100 19200 19300 19400 19500 19600 19700 19800 19900 20000 20100
Call Put

www.angelone.in
Technical & Derivatives Report
October
2
5
,
2023
`
Daily Pivot Levels for Nifty Constituents
Scrips S2 S1 PIVOT R1 R2
ADANIENT 2,230 2,270 2,341 2,380 2,451
ADANIPORTS 753 762 779 788 805
APOLLOHOSP 4,908 4,939 4,975 5,005 5,041
ASIANPAINT 3,037 3,054 3,082 3,099 3,127
AXISBANK 946 955 970 979 994
BAJAJ-AUTO 5,333 5,369 5,431 5,468 5,530
BAJFINANCE 7,692 7,745 7,815 7,869 7,939
BAJAJFINSV 1,577 1,595 1,623 1,641 1,670
BPCL 338 341 344 346 350
BHARTIARTL 930 935 942 947 954
BRITANNIA 4,465 4,498 4,549 4,582 4,633
CIPLA 1,159 1,171 1,191 1,203 1,223
COALINDIA 300 303 308 311 316
DIVISLAB 3,405 3,453 3,539 3,587 3,673
DRREDDY 5,440 5,496 5,581 5,637 5,723
EICHERMOT 3,388 3,417 3,455 3,484 3,522
GRASIM 1,855 1,879 1,909 1,933 1,963
HCLTECH 1,215 1,226 1,243 1,254 1,271
HDFCBANK 1,483 1,495 1,512 1,523 1,540
HDFCLIFE 608 616 631 639 653
HEROMOTOCO 3,081 3,115 3,174 3,209 3,267
HINDALCO 443 450 462 469 481
HINDUNILVR 2,462 2,473 2,491 2,502 2,521
ICICIBANK 914 922 933 941 953
INDUSINDBK 1,405 1,420 1,445 1,460 1,485
INFY 1,388 1,398 1,415 1,426 1,443
ITC 429 433 436 440 443
JSW STEEL 728 738 757 767 785
KOTAKBANK 1,698 1,719 1,744 1,766 1,791
LT 2,914 2,936 2,971 2,994 3,029
LTIMINDTREE 5,043 5,122 5,265 5,344 5,487
M&M 1,534 1,549 1,562 1,578 1,591
MARUTI 10,409 10,481 10,603 10,675 10,797
NESTLEIND 23,787 23,992 24,334 24,539 24,880
NTPC 232 234 237 240 243
ONGC 183 184 185 186 187
POWERGRID 195 197 201 204 207
RELIANCE 2,224 2,244 2,275 2,295 2,326
SBILIFE 1,307 1,323 1,345 1,360 1,382
SBIN 542 547 557 562 572
SUNPHARMA 1,099 1,111 1,130 1,142 1,161
TCS 3,352 3,381 3,430 3,459 3,508
TATACONSUM
864 874 890 899 916
TATAMOTORS 631 639 653 661 675
TATASTEEL 117 119 121 122 125
TECHM 1,140 1,148 1,159 1,167 1,179
TITAN 3,170 3,195 3,235 3,260 3,300
ULTRACEMCO 8,163 8,244 8,384 8,465 8,605
UPL 570 579 593 601 616
WIPRO 375 379 386 390 397

www.angelone.in
Technical & Derivatives Report
October
2
5
,
2023
Technical and Derivatives Team:
Sameet Chavan Head Research – Technical & Derivatives sameet.chavan@angelone.in
Sneha Seth Senior Analyst – Technical & Derivatives sneha.seth@angelone.in
Rajesh Bhosale Analyst - Technical rajesh.bhosle@angelone.in
Osho Krishan Senior Analyst – Technical & Derivatives osho.krishan@angelone.in
Hitesh Rathi Analyst – Technical & Derivatives hitesh.rathi@angelone.in
Research Team Tel: 022 – 39357600 Website: www.angelone.in
For Technical Queries E-mail: technicalresearch-cso@angelone.in
For Derivatives Queries E-mail: derivatives.desk@angelone.in
DISCLAIMER
We, Angel One Limited (hereinafter referred to as “Angel”) a company duly incorporated under the provisions of the Companies Act, 1956 with
its registered office at 601, 6th Floor, Ackruti Star, Central Road, MIDC, Andheri East, Mumbai – 400093, CIN: (L67120MH1996PLC101709) and
duly registered as a member of National Stock Exchange of India Limited, Bombay Stock Exchange Limited, Metropolitan Stock Exchange Limited,
Multi Commodity Exchange of India Ltd and National Commodity & Derivatives Exchange Ltd. Angel One limited is a company engaged in
diversified financial services business including securities broking, DP services, distribution of Mutual Fund products. It is also registered as a
Depository Participant with CDSL and Portfolio Manager and Investment Adviser with SEBI. It also has registration with AMFI as a Mutual Fund
Distributor. Angel One Limited is a registered entity with SEBI for Research Analyst in terms of SEBI (Research Analyst) Regulations, 2014 vide
registration number INH000000164 and also registered with PFRDA as PoP ,Registration No.19092018. Angel Group does not have any joint
ventures or associates. Angel One Limited is the ultimate parent company of the Group. Angel or its associates has not been debarred/ suspended
by SEBI or any other regulatory authority for accessing /dealing in securities Market.
AOL was merged with Angel Global Capital Private Limited and subsequently name of Angel Global Capital Private Limited was changed to Angel
Broking Private Limited (AOL) pursuant to scheme of Amalgamation sanctioned by the Hon'ble High Court of Judicature at Bombay by Orders
passed in Company Petition No 710 of 2011 and the approval granted by the Registrar of Companies. Further, name of Angel Broking Private
Limited again got changed to Angel Broking Limited (AOL) pursuant to fresh certificate of incorporation issued by Registrar of Companies (ROC)
dated June 28, 2018. Further name of Angel Broking name changed to Angel One Ltd pursuant to fresh certificate of incorporation issued by
Registrar of Companies (ROC) dated 23-09-21.
In case of any grievances please write to: support@angelone.in, Compliance Officer Details: Name : Hiren Thakkar, Tel No. –08657864228, Email
id - compliance@angelone.in
Registration granted by SEBI and certification from NISM in no way guarantee performance of the intermediary or provide any assurance of returns
to investors.
This document is solely for the personal information of the recipient, and must not be singularly used as the basis of any investment decision.
Nothing in this document should be construed as investment or financial advice. Each recipient of this document should make such investigations
as they deem necessary to arrive at an independent evaluation of an investment in the securities of the companies referred to in this document
(including the merits and risks involved), and should consult their own advisors to determine the merits and risks of such an investment.
Angel or its associates or research analyst or his relative may have actual/beneficial ownership of 1% or more in the securities of the subject
company at the end of the month immediately preceding the date of publication of the research report. Neither Angel or its associates nor
Research Analysts or his relative has any material conflict of interest at the time of publication of research report.
Angel or its associates might have received any compensation from the companies mentioned in the report during the period preceding twelve
months from the date of this report for services in respect of managing or co-managing public offerings, corporate finance, investment banking or
merchant banking, brokerage services or other advisory service in a merger or specific transaction in the normal course of business. Angel or its
associates did not receive any compensation or other benefits from the companies mentioned in the report or third party in connection with the
research report. Neither research entity nor research analyst has been engaged in market making activity for the subject company.

www.angelone.in
Technical & Derivatives Report
October
2
5
,
2023
*
Reports based on technical and derivative analysis center on studying charts of a stock's price movement, outstanding positions and trading
volume, as opposed to focusing on a company's fundamentals and, as such, may not match with a report on a company's fundamentals. Investors
are advised to refer the Fundamental and Technical Research Reports available on our website to evaluate the contrary view, if any.
The information in this document has been printed on the basis of publicly available information, internal data and other reliable sources believed
to be true, but we do not represent that it is accurate or complete and it should not be relied on as such, as this document is for general guidance
only. Angel One Limited or any of its affiliates/ group companies shall not be in any way responsible for any loss or damage that may arise to any
person from any inadvertent error in the information contained in this report. Angel One Limited does not warrant the accuracy, adequacy or
completeness of the service, information and materials and expressly disclaims liability for errors or omissions in the service, information and
materials. While Angel One Limited endeavours to update on a reasonable basis the information discussed in this material, there may be
regulatory, compliance, or other reasons that prevent us from doing so.
This document is being supplied to you solely for your information, and its contents, information or data may not be reproduced, redistributed or
passed on, directly or indirectly.
Neither Angel One Limited, nor its directors, employees or affiliates shall be liable for any loss or damage that may arise from or in connection
with the use of this information. Angel or its associates or Research Analyst or his relative might have financial interest in the subject company.
Research analyst has not served as an officer, director or employee of the subject company.
Investment in securities market are subject to market risks. Read all the related documents carefully before investing.
Any communication sent to clients on phone numbers or e-mail ids registered with the Trading Member is meant for client consumption and such
material should not be redistributed. Brokerage will not exceed SEBI prescribed limit. Any Information provided by us through any medium based
on our research or that of our affiliates or third parties or other external sources is subject to domestic and international market conditions and
we do not guarantee the availability or otherwise of any securities or other instruments and such Information is merely an estimation of certain
investments, and we have not and shall not be deemed to have assumed any responsibility for any such Information. You should seek independent
professional advice and/or tax advice regarding the suitability of any investment decision whether based on any Information provided by us
through the Site from inhouse research or third party reports or otherwise.
The report and information contained herein is strictly confidential and meant solely for the selected recipient and may not be altered in any way,
transmitted to, copied or distributed, in part or in whole, to any other person or to the media or reproduced in any form, without prior written
consent.
