September
2
5
, 2023
www.angelone.in
Technical & Derivatives Report
8
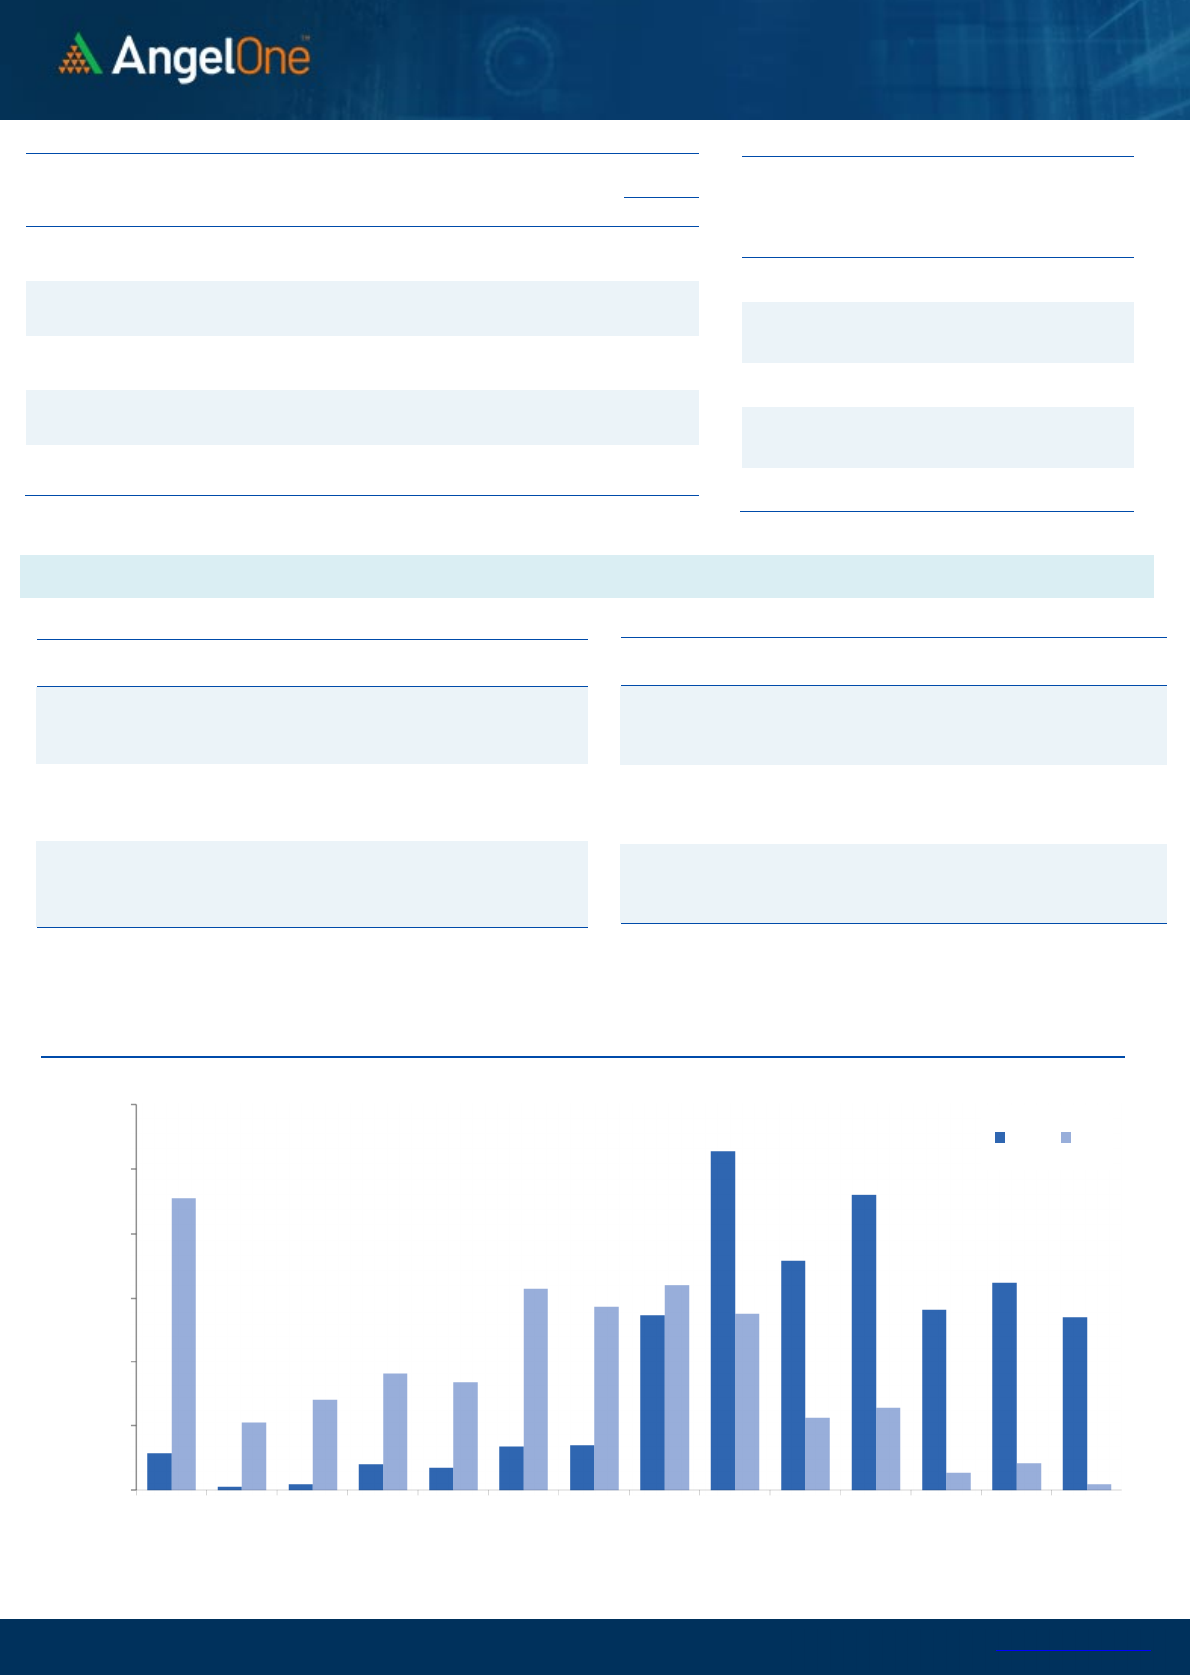
Nifty Bank Outlook (
4
46
12
)
The truncated week was completely dominated by the bears. The high
beta index had a gap-down opening to start the week and the sell-off
intensified as the week progressed, resulting in the bank index ending
its four-week winning streak with a 3.50% loss WoW, closing a tad
above 44600.
The week began with the potential for Bank Nifty to reach new highs,
but HDFCBANK, a significant player, acted as a spoiler, restricting the
market from reaching higher levels. As the week continued, the sell-
off intensified, with other heavyweights joining in and dragging the
bank index lower. This has resulted in the formation of a double-top
pattern on the daily chart, erasing most of the gains made in the last
three weeks of September in just one week. Currently, bears have the
upper hand, but it's worth noting that intraday indicators are now
placed in the oversold zone with some signs of positive divergence
emerging. Therefore, it's advisable to avoid initiating fresh short
positions at current levels, as there is potential for a strong bounce-
back. Going forward, attention should be on the 89EMA, which acted
as a support level in August, now placed around 44400. Additionally,
the starting point of the September rally at 43800 is a critical level to
monitor if bulls aim for a comeback. On the flip side, an attempt to
bounce back on Friday fizzled out around 45000, so 45000 to 45200
can be seen as an immediate resistance for this week.
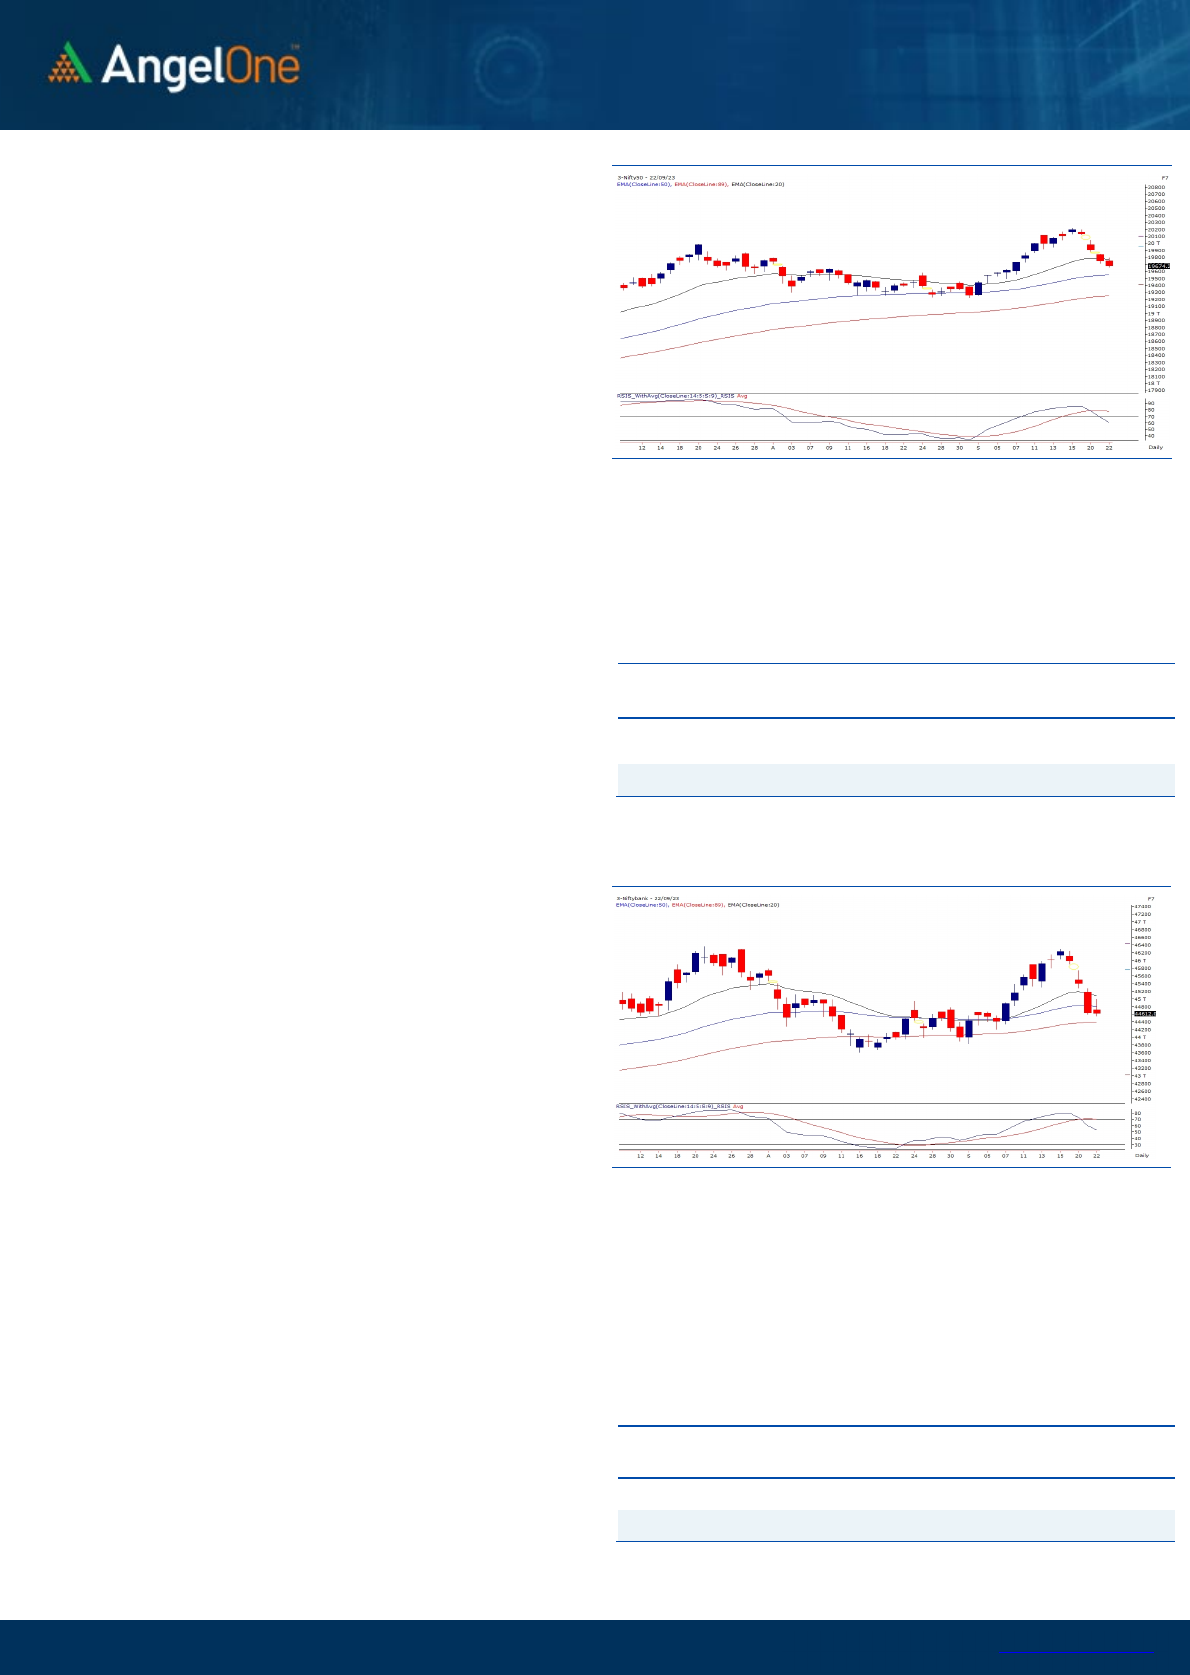
Exhibit 1: Nifty Daily Chart
Exhibit 2: Nifty Bank Daily Chart
Sensex (
6
6
009
) / Nifty (
19
674
)
The Indian equity markets started the week with a hint of profit
booking, taking cues from the nervousness in the global bourses. As we
slipped into the truncated week, the sell-off intensified, with a series of
gap-down openings and eroded over 50 percent of the September
month gains. Amidst global weakness and firm profit booking, the
Nifty50 index concluded the week with a deep cut of 2.57 percent and
settled a tad below the 19700 zone.
From a technical point of view, the Nifty index has seen an intense
correction after three consecutive weeks of rallying and settled below
the 50% Fibonacci retracement. The recent price action certainly
portrays the ferocity of the bears, which not only decisively dragged the
index below the psychological mark but yielded a dent in the ongoing
undertone. As far as levels are concerned, the 19600-19500 zone is
likely to cushion the blips. While on the higher end, 19780-19800 is
likely to be seen as intermediate resistance, followed by a series of
resilience from 19850-19900 and finally the 20000 mark in the near
term period.
Positive global developments could only put a halt to the
ongoing carnage and it would be very engaging to watch how
things pan out in the upcoming week. For now, one needs to
stay very selective with stock preferences and avoid being
aggressive in the markets.
Key Levels
Support 1 – 19600 Resistance 1 – 19780
Support 2 – 19500 Resistance 2 – 19850
The highlight of the week was the disappointment in the
heavyweight private banking space. However, the PSU banking
space continued its winning streak for a fourth consecutive week, up
3.35% WoW. Some mid-sized private banks also outperformed.
Traders can focus on such strong performers but should exercise
caution until market nervousness subsides.
Key Levels
Support 1 – 44400 Resistance 1 – 45000
Support 2 – 43800 Resistance 2 – 45200

www.angelone.in
Technical & Derivatives Report
September
2
5
, 2023
View
The Indian equity market witnessed a week of profit-
taking, wherein the Nifty dragged below 19700,
eroding 2.6% WoW.
FIIs were net sellers in the cash market segment to
the tune of Rs. 1327 cr. Simultaneously, they sold
worth Rs. 1124 cr in Index futures with a rise in open
interest, suggesting the formation of shorts.
On the derivatives front, the fall seen during last
week was mainly due to long unwinding in Nifty; but
the banking index witnessed meaningful short
formation. For the coming monthly expiry, put
writers' shifted position to 19600-19500 strikes,
indicating a downward shift in the support. On the
other side, the highest OI concentration stands at
19800 call strike, indicating the intermediate
resistance. Considering the quantum of shorts
formed in the banking index and writing in 19800 call
strikes, we would advise avoiding any aggressive bets
for the time being and waiting for the market to
stabilize.
Comments
The Nifty futures open interest has increased by 0.40%
and Bank Nifty futures open interest has increased by
4.39% as the market closed at 19,674.25.
The Nifty September future closed with a premium of
34.00 points against 36.35 points in the last trading
session. The October series closed at a premium of
148.40 points.
The INDIA VIX has decreased from 10.82 to 10.66. At
the same time, the PCR-OI of Nifty has increased from
0.82 to 0.93.
A few of the liquid counters where we have seen high
cost of carry are BHEL, IDEA, DALBHARAT, GAIL and
DLF.
Historical Volatility
SCRIP HV
BERGEPAINT 26.99
CANBK 42.52
ZYDUSLIFE 28.76
GRANULES 38.34
DRREDDY 25.04
Nifty Vs OI
19000
19200
19400
19600
19800
20000
20200
20400
20600
,0
2,000
4,000
6,000
8,000
10,000
12,000
14,000
9-6 9-8 9-12 9-14 9-18 9-21
Openinterest Nifty
OI Gainers
SCRIP OI
OI
CHG. (%)
PRICE
PRICE
CHG. (%)
BERGEPAINT 13866600 22.59 669.25 4.72
GRANULES 15138000 22.48 336.80 4.29
SHREECEM 192375 14.03 25939.65 -1.53
POLYCAB 2075400 12.07 5130.00 -1.59
ASTRAL 4385650 10.83 1841.05 -2.67
ULTRACEMCO 1507400 10.66 8186.60 -1.56
CANBK 68231700 10.30 382.95 5.17
IDEA 1540880000 8.59 11.30 4.13
OI Losers
SCRIP OI
OI
CHG. (%)
PRICE
PRICE
CHG. (%)
PIDILITIND 17600 -8.57 2517.70 0.14
BALRAMCHIN 11171200 -7.15 414.30 -1.45
OFSS 363400 -6.68 4195.30 -1.36
PNB 234176000 -5.85 77.50 2.99
COROMANDEL 1348200 -5.73 1101.95 1.06
LALPATHLAB 979800 -4.81 2339.55 -1.97
BEL 76209000 -3.93 136.05 0.48
DELTACORP 16612400 -3.86 175.40 0.00
Put-Call Ratio
SCRIP PCR (OI) PCR (VOL)
NIFTY 0.93 0.91
BANKNIFTY 0.71 0.96
RELIANCE 0.45 0.44
ICICIBANK 0.41 0.49
INFY 0.53 0.46
www.angelone.in
Technical & Derivatives Report
September
2
5
, 2023
Note: Above mentioned Bullish or Bearish Spreads in Nifty (Sep Series) are given as an information and not as a recommendation.
Nifty Spot =
19
674.25
FII Statistics for
September
2
2
, 2023
Detail Buy
Contracts
OI Value
(in Cr.)
Sell Net
CHANGE
INDEX
FUTURES
4193.33
5316.92
(1123.59) 182640
15808.42
4.50
INDEX
OPTIONS
1212989.20
1220011.04
(7021.84) 4166259
334367.50
26.93
STOCK
FUTURES
23206.48
22080.85
1125.63
2363274
186531.83
(0.29)
STOCK
OPTIONS
35792.90
35684.99
107.91
358123
28786.41
(0.76)
Total
1276181.91
1283093.80
(6911.89) 7070296
565494.16
14.26
Turnover on
September
2
2
, 2023
Instrument
No. of
Contracts
Turnover
(in Cr.)
Change
(%)
Index Futures
446554 36514.41
10.77
Index
Options
399220281
56710.68
0.93
Stock Futures
1099006 90172.38
5.37
Stock
Options
5572047 4623.53 -0.88
Total
55,72,047
4623.53 4.81
Bull-Call Spreads
Action Strike Price Risk Reward BEP
Buy
19700 96.20
44.70
55.30
19744.70
Sell
19800 51.50
Buy
19700 96.20
71.70
128.30
19771.70
Sell
19900 24.50
Buy
19800 51.50
27.00 73.00 19827.00
Sell
19900 24.50
Bear-Put Spreads
Action Strike Price Risk Reward BEP
Buy
19700 86.75
36.40
63.60
19663.60
Sell 19600 50.35
Buy 19700 86.75
59.05
140.95
19640.95
Sell
19500 27.70
Buy
19600 50.35
22.65 77.35 19577.35
Sell 19500 27.70
Nifty Put
-
Call Analysis
,0
2000,000
4000,000
6000,000
8000,000
10000,000
12000,000
19000 19100 19200 19300 19400 19500 19600 19700 19800 19900 20000 20100 20200 20300
Call Put

www.angelone.in
Technical & Derivatives Report
September
2
5
, 2023
`
Daily Pivot Levels for Nifty Constituents
Scrips S2 S1 PIVOT R1 R2
ADANIENT 2,436 2,451 2,474 2,489 2,512
ADANIPORTS 813 820 829 836 846
APOLLOHOSP 4,925 4,957 4,987 5,019 5,049
ASIANPAINT 3,197 3,236 3,260 3,299 3,322
AXISBANK 999 1,008 1,018 1,028 1,037
BAJAJ-AUTO 4,939 4,970 5,027 5,058 5,115
BAJFINANCE 7,377 7,424 7,501 7,548 7,624
BAJAJFINSV 1,514 1,529 1,540 1,555 1,566
BPCL 347 350 354 356 360
BHARTIARTL 894 903 913 921 931
BRITANNIA 4,487 4,526 4,549 4,588 4,611
CIPLA 1,147 1,167 1,188 1,207 1,228
COALINDIA 276 280 283 287 290
DIVISLAB 3,654 3,679 3,711 3,736 3,768
DRREDDY 5,379 5,448 5,571 5,640 5,763
EICHERMOT 3,371 3,390 3,411 3,430 3,451
GRASIM 1,870 1,891 1,910 1,931 1,950
HCLTECH 1,256 1,265 1,274 1,283 1,293
HDFCBANK 1,499 1,514 1,539 1,555 1,580
HDFCLIFE 635 642 649 656 663
HEROMOTOCO 2,968 2,995 3,018 3,045 3,067
HINDALCO 467 473 477 483 488
HINDUNILVR 2,445 2,464 2,477 2,496 2,509
ICICIBANK 939 945 953 958 966
INDUSINDBK 1,393 1,423 1,443 1,473 1,494
INFY 1,474 1,485 1,496 1,507 1,518
ITC 438 441 445 447 451
JSW STEEL 766 770 777 781 788
KOTAKBANK 1,742 1,749 1,760 1,767 1,777
LT 2,885 2,902 2,919 2,936 2,953
LTIMINDTREE 5,308 5,368 5,410 5,470 5,513
M&M 1,545 1,576 1,597 1,628 1,649
MARUTI 10,212 10,373 10,470 10,632 10,728
NESTLEIND 22,258 22,395 22,517 22,655 22,777
NTPC 234 236 238 240 241
ONGC 183 184 186 187 189
POWERGRID 193 196 199 203 206
RELIANCE 2,330 2,342 2,362 2,375 2,395
SBILIFE 1,303 1,311 1,324 1,332 1,346
SBIN 587 592 597 603 608
SUNPHARMA 1,117 1,124 1,136 1,144 1,156
TCS 3,532 3,568 3,601 3,637 3,670
TATACONSUM
859 869 879 888 899
TATAMOTORS 612 616 623 628 635
TATASTEEL 124 125 127 128 130
TECHM 1,267 1,286 1,303 1,322 1,339
TITAN 3,241 3,258 3,278 3,295 3,315
ULTRACEMCO 8,094 8,141 8,226 8,272 8,357
UPL 602 608 619 625 636
WIPRO 410 414 421 425 431

www.angelone.in
Technical & Derivatives Report
September
2
5
, 2023
Technical and Derivatives Team:
Sameet Chavan Head Research – Technical & Derivatives sameet.chavan@angelone.in
Sneha Seth Senior Analyst – Technical & Derivatives sneha.seth@angelone.in
Rajesh Bhosale Analyst - Technical rajesh.bhosle@angelone.in
Osho Krishan Senior Analyst – Technical & Derivatives osho.krishan@angelone.in
Hitesh Rathi Analyst – Technical & Derivatives hitesh.rathi@angelone.in
Research Team Tel: 022 – 39357600 Website: www.angelone.in
For Technical Queries E-mail: technicalresearch-cso@angelone.in
For Derivatives Queries E-mail: derivatives.desk@angelone.in
DISCLAIMER
We, Angel One Limited (hereinafter referred to as “Angel”) a company duly incorporated under the provisions of the Companies Act, 1956 with
its registered office at 601, 6th Floor, Ackruti Star, Central Road, MIDC, Andheri East, Mumbai – 400093, CIN: (L67120MH1996PLC101709) and
duly registered as a member of National Stock Exchange of India Limited, Bombay Stock Exchange Limited, Metropolitan Stock Exchange Limited,
Multi Commodity Exchange of India Ltd and National Commodity & Derivatives Exchange Ltd. Angel One limited is a company engaged in
diversified financial services business including securities broking, DP services, distribution of Mutual Fund products. It is also registered as a
Depository Participant with CDSL and Portfolio Manager and Investment Adviser with SEBI. It also has registration with AMFI as a Mutual Fund
Distributor. Angel One Limited is a registered entity with SEBI for Research Analyst in terms of SEBI (Research Analyst) Regulations, 2014 vide
registration number INH000000164 and also registered with PFRDA as PoP ,Registration No.19092018. Angel Group does not have any joint
ventures or associates. Angel One Limited is the ultimate parent company of the Group. . Angel or its associates has not been debarred/ suspended
by SEBI or any other regulatory authority for accessing /dealing in securities Market.
AOL was merged with Angel Global Capital Private Limited and subsequently name of Angel Global Capital Private Limited was changed to Angel
Broking Private Limited (AOL) pursuant to scheme of Amalgamation sanctioned by the Hon'ble High Court of Judicature at Bombay by Orders
passed in Company Petition No 710 of 2011 and the approval granted by the Registrar of Companies. Further, name of Angel Broking Private
Limited again got changed to Angel Broking Limited (AOL) pursuant to fresh certificate of incorporation issued by Registrar of Companies (ROC)
dated June 28, 2018. Further name of Angel Broking name changed to Angel One Ltd pursuant to fresh certificate of incorporation issued by
Registrar of Companies (ROC) dated 23-09-21.
In case of any grievances please write to: support@angelone.in, Compliance Officer Details: Name : Hiren Thakkar, Tel No. –08657864228, Email
id - compliance@angelone.in
Registration granted by SEBI and certification from NISM in no way guarantee performance of the intermediary or provide any assurance of returns
to investors.
This document is solely for the personal information of the recipient, and must not be singularly used as the basis of any investment decision.
Nothing in this document should be construed as investment or financial advice. Each recipient of this document should make such investigations
as they deem necessary to arrive at an independent evaluation of an investment in the securities of the companies referred to in this document
(including the merits and risks involved), and should consult their own advisors to determine the merits and risks of such an investment.
Angel or its associates or research analyst or his relative may have actual/beneficial ownership of 1% or more in the securities of the subject
company at the end of the month immediately preceding the date of publication of the research report. Neither Angel or its associates nor
Research Analysts or his relative has any material conflict of interest at the time of publication of research report.
Angel or its associates might have received any compensation from the companies mentioned in the report during the period preceding twelve
months from the date of this report for services in respect of managing or co-managing public offerings, corporate finance, investment banking or
merchant banking, brokerage services or other advisory service in a merger or specific transaction in the normal course of business. Angel or its
associates did not receive any compensation or other benefits from the companies mentioned in the report or third party in connection with the
research report. Neither research entity nor research analyst has been engaged in market making activity for the subject company.

www.angelone.in
Technical & Derivatives Report
September
2
5
, 2023
*
Reports based on technical and derivative analysis center on studying charts of a stock's price movement, outstanding positions and trading
volume, as opposed to focusing on a company's fundamentals and, as such, may not match with a report on a company's fundamentals. Investors
are advised to refer the Fundamental and Technical Research Reports available on our website to evaluate the contrary view, if any.
The information in this document has been printed on the basis of publicly available information, internal data and other reliable sources believed
to be true, but we do not represent that it is accurate or complete and it should not be relied on as such, as this document is for general guidance
only. Angel One Limited or any of its affiliates/ group companies shall not be in any way responsible for any loss or damage that may arise to any
person from any inadvertent error in the information contained in this report. Angel One Limited does not warrant the accuracy, adequacy or
completeness of the service, information and materials and expressly disclaims liability for errors or omissions in the service, information and
materials. While Angel One Limited endeavours to update on a reasonable basis the information discussed in this material, there may be
regulatory, compliance, or other reasons that prevent us from doing so.
This document is being supplied to you solely for your information, and its contents, information or data may not be reproduced, redistributed or
passed on, directly or indirectly.
Neither Angel One Limited, nor its directors, employees or affiliates shall be liable for any loss or damage that may arise from or in connection
with the use of this information. Angel or its associates or Research Analyst or his relative might have financial interest in the subject company.
Research analyst has not served as an officer, director or employee of the subject company.
Investment in securities market are subject to market risks. Read all the related documents carefully before investing.
Any communication sent to clients on phone numbers or e-mail ids registered with the Trading Member is meant for client consumption and such
material should not be redistributed. Brokerage will not exceed SEBI prescribed limit. Any Information provided by us through any medium based
on our research or that of our affiliates or third parties or other external sources is subject to domestic and international market conditions and
we do not guarantee the availability or otherwise of any securities or other instruments and such Information is merely an estimation of certain
investments, and we have not and shall not be deemed to have assumed any responsibility for any such Information. You should seek independent
professional advice and/or tax advice regarding the suitability of any investment decision whether based on any Information provided by us
through the Site from inhouse research or third party reports or otherwise.
The report and information contained herein is strictly confidential and meant solely for the selected recipient and may not be altered in any way,
transmitted to, copied or distributed, in part or in whole, to any other person or to the media or reproduced in any form, without prior written
consent.
