Aug 25, 2022
www.angelone.in
Technical & Derivatives Report
OOOOOOOO
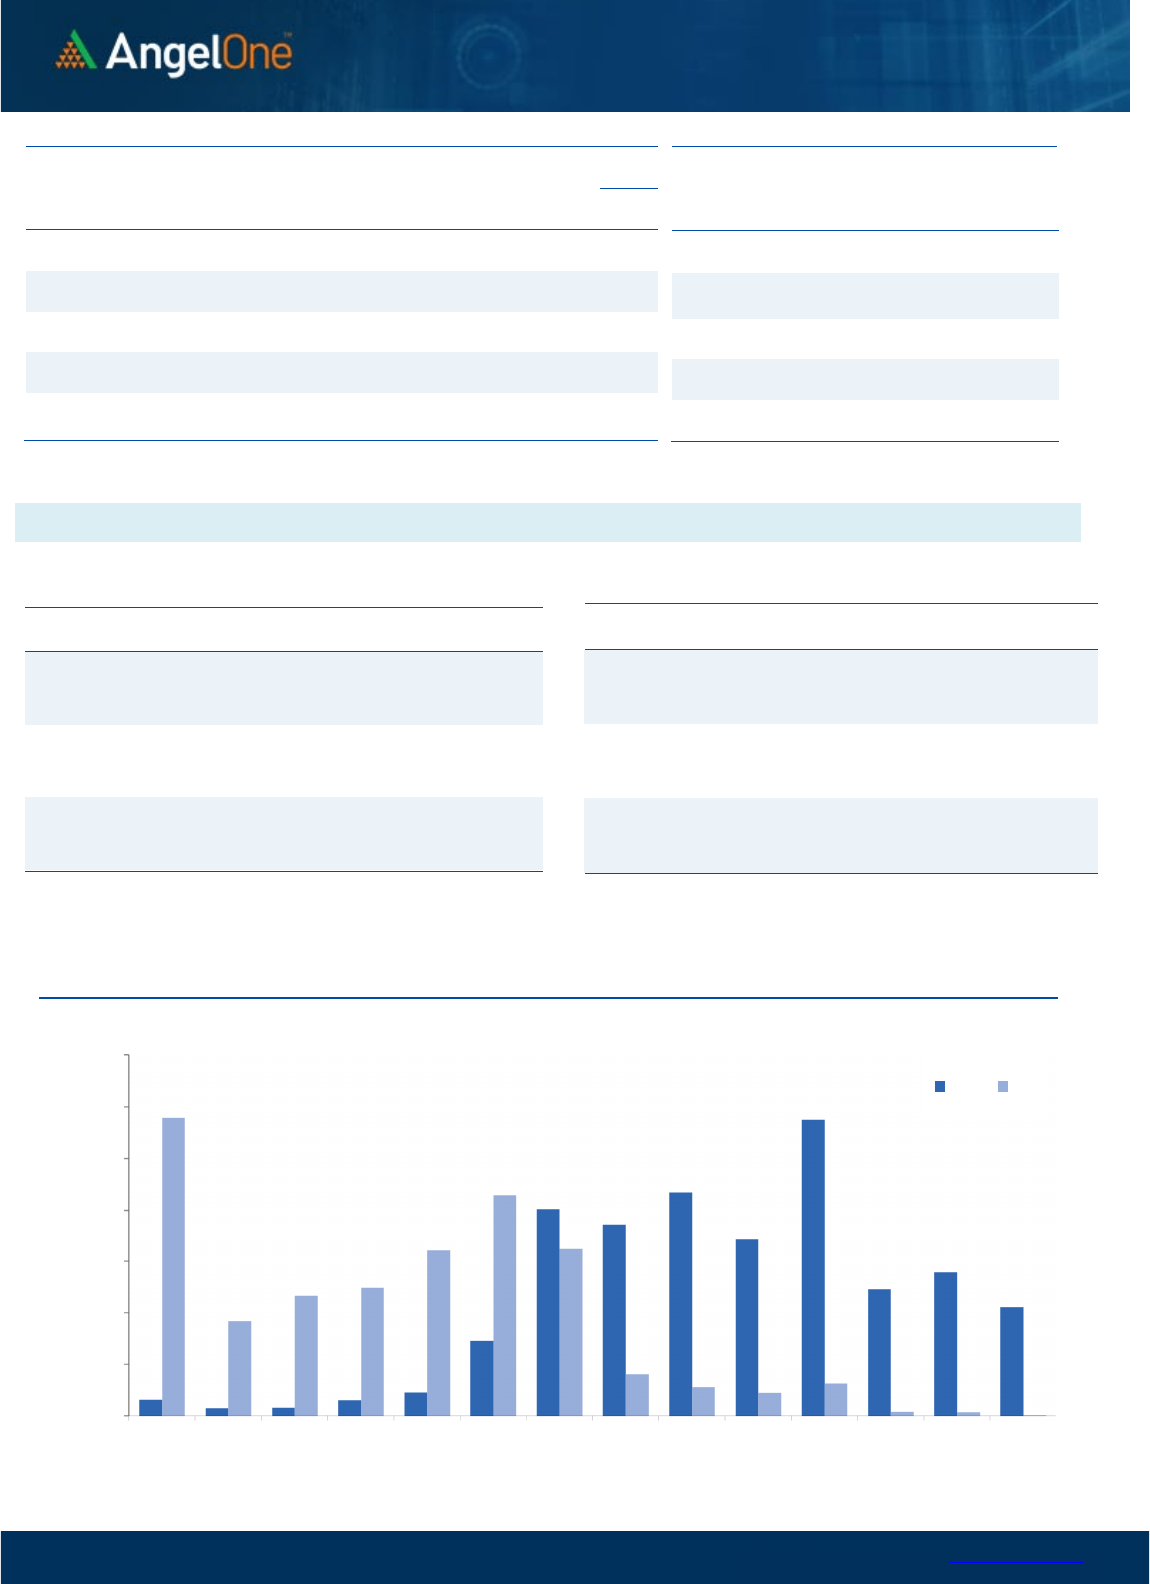
Nifty Bank Outlook (39038)
Post Tuesday recovery, the banking index opened slightly lower but
soon smart buying emerged right from the word go reclaim 38900. In
the midst, we did see some dip which got bought into to settle the day
with yet another day of strong close with the gains of 0.88% tad above
39000.
The BankNifty has clearly outshined the benchmark index in last two
trading sessions and has managed to fill the bearish gap formed
around 38800. In our previous commentary, we had mentioned the
weakness seen was just a price wise correction and the overall picture
still appears optimistic. With yesterday follow-up move the base has
now shifted higher to 38500-38600 zone. On the higher side, the
immediate resistance is seen around 39400-39500 zone. For the
coming session, we expect continuation of northward move and hence
would advocate utilizing intraday dips to add fresh longs.
Key Levels
Support 1 – 38600 Resistance 1 – 39400
Support 2 – 38500 Resistance 2 – 39500
Exhibit 1: Nifty
Daily
Chart
Exhibit 2: Nifty Bank
Daily
Chart
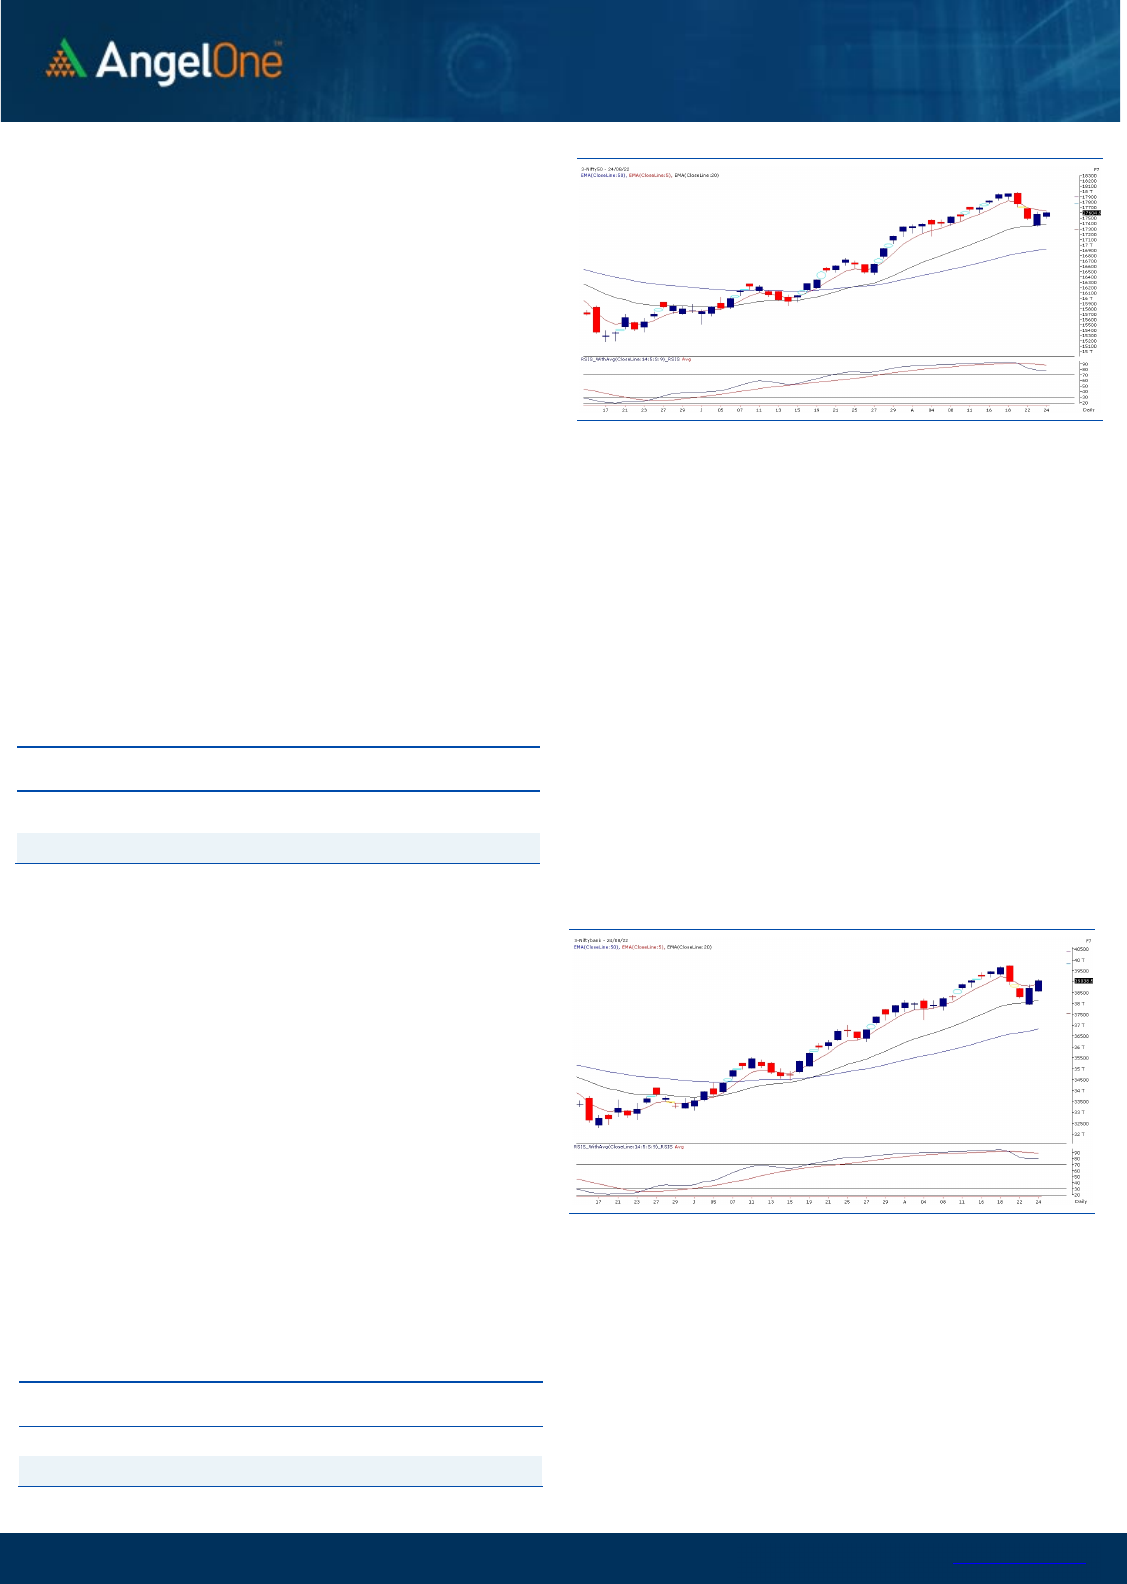
Sensex (59085) / Nifty (17605)
Our markets started the session on a soft note by shrugging off
unfavourable cues from the global bourses. During the remaining part
of the session, both counterparties made several attempts to show
their dominance; but eventually, the bulls turned out victorious as we
witnessed a good traction in the last hour to reclaim the 17600 mark
on a closing basis.
In the midst of mild tug of war yesterday, our markets managed to close
in the green by a small margin. If we observe meticulously, the Nifty
kept oscillating in merely 70-80 points throughout the session, which is
a sign of consolidation. The real action was seen outside the index as
lot of individual stocks gave excellent moves in the latter half. For the
coming session, we expect this consolidation to continue for key
indices. As far as levels are concerned, 17650 – 17710 is to be seen as
immediate resistance zone and momentum traders should ideally look
to lighten up longs around it from an expiry perspective. On the flipside,
17525 – 17450 remains to be an intraday supports.
Globally, things have once again become slightly turbulent and hence,
it’s advisable not to get complacent here. Rather, following one step at
a time is the appropriate strategy.
Key Levels
Support 1 – 17525 Resistance 1 – 17650
Support 2 – 17450 Resistance 2 – 17710

www.angelone.in
Technical & Derivatives Report
Aug 25, 2022
View
Ahead of the contract expiry, the market seemed
tentative as the Nifty index remained in a slender
range and finally settled on a muted note with a
mere gain of 0.16%, a tad above the 17600 level.
FIIs were net buyers in the cash market segment to
the tune of Rs. 23 crores. Simultaneously, in Index
futures, they sold worth Rs. 1329 crores with a
decrease in open interest, indicating long unwinding.
In the F&O space, we have seen short covering in both
indices. On the options front, the primary
concentration of OI is seen at the 17500 put strike,
which is likely to act as an immediate support zone.
While on the contrary, OI concentration could be seen
at 17700-17800 call strikes, which is likely to act as a
primary hurdle. Meanwhile, the stronger hands have
contracted their ‘Long Short Ratio’ to 45% from 49%.
Considering all the data points and the recent price
action, it is advisable to keep a close tab on the
mentioned levels on the expiry day. Also, it is advisable
to avoid aggressive index bets for the time being.
Comments
The Nifty futures open interest has decreased by
3.16%. and Bank Nifty futures open interest has
decreased by 6.49% as the market closed at 17604.95.
The Nifty Aug future closed with a premium of 12.30
point against a premium of 8.05 point in the last
trading session. The Sep series closed at a premium
of 94.30 point.
The INDIA VIX decreased from 19.05 to 18.43. At the
same time, the PCR-OI of Nifty has increased from
0.98 to 1.00.
Few of the liquid counters where we have seen high
cost of carry are RBLBANK, ABB, CANFINHOME,
SUNTV and BANDHANBNK.
Historical Volatility
SCRIP HV
IDEA 83.51
IBULHSGFIN 74.87
RBLBANK 74.58
ZEEL 65.16
HINDCOPPER 64.84
Nifty Vs OI
17100
17200
17300
17400
17500
17600
17700
17800
17900
18000
18100
6,000
8,000
10,000
12,000
14,000
16,000
18,000
8/5 8/10 8/12 8/17 8/19 8/23
Openinterest Nifty
OI Gainers
SCRIP OI
OI
CHG. (%)
PRICE
PRICE
CHG. (%)
NTPC 99459300 17.89 160.75 1.29
ABB 1142000 11.96 3060.50 6.31
BOSCHLTD 188550 11.93 17258.9 -0.36
HINDALCO 28764850 9.95 428.85 0.23
CANFINHOME 2652975 9.54 636.40 6.57
DIVISLAB 3585900 8.85 3496.65 -1.18
CROMPTON 4879500 8.80 389.30 0.03
RBLBANK 54960000 7.91 121.80 16.91
OI Losers
SCRIP OI
OI
CHG. (%)
PRICE
PRICE
CHG. (%)
CUB 6585000 -17.53 178.00 -0.62
JKCEMENT 334750 -15.73 2661.40 -0.09
IPCALAB 1388400 -14.01 922.10 0.00
NAM-INDIA 1292800 -13.21 313.10 0.46
IDFCFIRSTB 200580000 -12.83 48.60 5.22
AARTIIND 3002200 -11.88 786.40 -0.67
DIXON 744125 -11.87 4090.85 1.07
PERSISTENT 472950 -11.38 3608.65 -0.77
Put-Call Ratio
SCRIP PCR (OI) PCR (VOL)
NIFTY 1.00 0.90
BANKNIFTY 1.02 0.90
RELIANCE 0.52 0.51
ICICIBANK 0.87 0.51
INFY 0.41 0.42
www.angelone.in
Technical & Derivatives Report
Aug 25, 2022
Note: Above mentioned Bullish or Bearish Spreads in Nifty (Aug Series) are given as an information and not as a recommendation.
Nifty Spot =
17,
604
.
95
FII Statistics for
August
2
4
, 2022
Detail Buy
Contracts
Open
Interest
Value
(in Cr.)
Sell
Net
CHANGE
INDEX
FUTURES
5215.59 6544.65 (1329.06) 163773 14887.59
(6.94)
INDEX
OPTIONS
1077908.68 1075200.51 2708.17
1757919 159170.30
5.43
STOCK
FUTURES
35650.22 37888.79 (2238.57) 2140113 149838.51
(0.92)
STOCK
OPTIONS
7891.69 7585.44 306.25
146921 10454.10
(9.75)
Total 1126666.18
1127219.39
(553.21) 4208726
334350.50
1.02
Turnover on
August
2
4
, 2022
Instrument
No. of
Contracts
Turnover
( in Cr. )
Change
(%)
Index Futures
529511 48601.12 -14.33
Index Options
145348296
13542940.77 -0.23
Stock
Futures
2084888 146918.37 -11.48
Stock Options
3753494 284191.75 -25.08
Total
37,53,494
284191.75 -1.08
Bull-Call Spreads
Action Strike Price Risk Reward BEP
Buy
17600 67.60
40.50
59.50
17640.50
Sell
17700 27.10
Buy
17600 67.60
58.30
141.70
17658.30
Sell
17800 9.30
Buy
17700 27.10
17.80 82.20 17717.80
Sell 17800 9.30
Bear
-
Put Spreads
Action Strike Price Risk Reward BEP
Buy 17600 53.95
31.50
68.50
17568.50
Sell
17500 22.45
Buy 17600 53.95
43.75
156.25
17556.25
Sell 17400 10.20
Buy
17500 22.45
12.25 87.75 17487.75
Sell 17400 10.20
Nifty Put
-
Call Analysis
,0
2000,000
4000,000
6000,000
8000,000
10000,000
12000,000
14000,000
17000 17100 17200 17300 17400 17500 17600 17700 17800 17900 18000 18100 18200 18300
Call Put

www.angelone.in
Technical & Derivatives Report
Aug 25, 2022
`
Daily Pivot Levels for Nifty Constituents
Scrips
S2
S1
PIVOT
R1 R2
ADANIPORTS
809
823
831 844
852
APOLLOHOSP 4,028 4,119
4,170
4,261
4,312
ASIANPAINT
3,272
3,326
3,355 3,409
3,438
AXISBANK
738
744
748
754
758
BAJAJ-AUTO 4,033 4,049
4,067 4,083
4,100
BAJFINANCE 7,088 7,132
7,184
7,229
7,281
BAJAJFINSV
16,067
16,201
16,314
16,447
16,560
BPCL
324
327
331
333
337
BHARTIARTL
701
720
737
756
773
BRITANNIA
3,610
3,634
3,661
3,686
3,713
CIPLA
1,011
1,024
1,039
1,052
1,067
COALINDIA
220
222
224
226
228
DIVISLAB 3,394 3,445
3,498 3,549 3,602
DRREDDY 4,171 4,195
4,220 4,244 4,270
EICHERMOT 3,359 3,405
3,439 3,485 3,520
GRASIM
1,559
1,586
1,601 1,628
1,644
HCLTECH 939 944
949
954
959
HDFCBANK
1,453
1,463
1,469
1,479
1,485
HDFCLIFE
557
562
568
573
579
HDFC 2,384 2,411
2,427 2,454 2,470
HEROMOTOCO
2,759
2,783
2,803
2,827
2,847
HINDALCO
422
425
429
432
436
HINDUNILVR 2,538 2,563
2,587 2,612
2,635
ICICIBANK
850
862
869
880
887
INDUSINDBK
1,067
1,084
1,095
1,112
1,123
INFY
1,523
1,530
1,538
1,545
1,553
ITC
309
312
316
318
322
JSW STEEL
642
647
652
657
662
KOTAKBANK
1,828
1,848
1,861
1,881
1,894
LT
1,835
1,864
1,881
1,910
1,927
M&M
1,248
1,258
1,271 1,281
1,293
MARUTI
8,512
8,608
8,690 8,786
8,868
NESTLEIND
19,236
19,454
19,585
19,803
19,934
NTPC
156
158
161
163
166
ONGC
133
135
136
137
139
POWERGRID
225
227
229
231
232
RELIANCE
2,614
2,627
2,648 2,661 2,683
SBILIFE
1,266
1,277
1,283
1,294
1,301
SHREECEM 20,926 21,137
21,291
21,502
21,655
SBIN
508
513
518 524
529
SUNPHARMA
864
873
886
895
908
TCS
3,213
3,234
3,271
3,292
3,329
TATACONSUM
791
798
806
813
820
TATAMOTORS
455
459
462
466
469
TATASTEEL 104 105
107
108
109
TECHM
1,048
1,060
1,066
1,078
1,085
TITAN
2,412
2,436
2,466 2,490 2,520
ULTRACEMCO
6,416
6,462
6,498 6,544
6,580
UPL
748
754
759
765
770
WIPRO 412 414
417 419
422

www.angelone.in
Technical & Derivatives Report
Aug 25, 2022
*
Technical and Derivatives Team:
Sameet Chavan Chief Analyst – Technical & Derivatives sameet.chavan@angelone.in
Sneha Seth Senior Analyst – Technical & Derivatives sneha.seth@angelone.in
Rajesh Bhosale Technical Analyst rajesh.bhosle@angelone.in
Osho Krishan Senior Analyst – Technical & Derivatives osho.krishan@angelone.in
Research Team Tel: 022 – 39357600 (Extn. 6844) Website: www.angelone.in
For Technical Queries E-mail: technicalresearch-cso@angelone.in
For Derivatives Queries E-mail: derivatives.desk@angelone.in
DISCLAIMER
Angel One Limited (hereinafter referred to as “Angel”) is a registered Member of National Stock Exchange of India Limited, Bombay
Stock Exchange Limited and Metropolitan Stock Exchange Limited. It is also registered as a Depository Participant with CDSL and
Portfolio Manager and investment advisor with SEBI. It also has registration with AMFI as a Mutual Fund Distributor. Angel One
Limited is a registered entity with SEBI for Research Analyst in terms of SEBI (Research Analyst) Regulations, 2014 vide registration
number INH000000164. Angel or its associates has not been debarred/ suspended by SEBI or any other regulatory authority for
accessing /dealing in securities Market.
This document is solely for the personal information of the recipient, and must not be singularly used as the basis of any investment
decision. Nothing in this document should be construed as investment or financial advice. Each recipient of this document should
make such investigations as they deem necessary to arrive at an independent evaluation of an investment in the securities of the
companies referred to in this document (including the merits and risks involved), and should consult their own advisors to determine
the merits and risks of such an investment.
Angel or its associates or research analyst or his relative may have actual/beneficial ownership of 1% or more in the securities of
the subject company at the end of the month immediately preceding the date of publication of the research report. Neither Angel or
its associates nor Research Analysts or his relative has any material conflict of interest at the time of publication of research report.
Angel or its associates might have received any compensation from the companies mentioned in the report during the period
preceding twelve months from the date of this report for services in respect of managing or co-managing public offerings, corporate
finance, investment banking or merchant banking, brokerage services or other advisory service in a merger or specific transaction
in the normal course of business. Angel or its associates did not receive any compensation or other benefits from the companies
mentioned in the report or third party in connection with the research report. Neither Angel nor its research analyst entity has been
engaged in market making activity for the subject company.
Reports based on technical and derivative analysis center on studying charts of a stock's price movement, outstanding positions and
trading volume, as opposed to focusing on a company's fundamentals and, as such, may not match with a report on a company's
fundamentals. Investors are advised to refer the Fundamental and Technical Research Reports available on our website to evaluate
the contrary view, if any.
The information in this document has been printed on the basis of publicly available information, internal data and other reliable
sources believed to be true, but we do not represent that it is accurate or complete and it should not be relied on as such, as this
document is for general guidance only. Angel One Limited or any of its affiliates/ group companies shall not be in any way responsible
for any loss or damage that may arise to any person from any inadvertent error in the information contained in this report. Angel One
Limited has not independently verified all the information contained within this document. Accordingly, we cannot testify, nor make
any representation or warranty, express or implied, to the accuracy, contents or data contained within this document. While Angel
One Limited endeavors to update on a reasonable basis the information discussed in this material, there may be regulatory,
compliance, or other reasons that prevent us from doing so.
This document is being supplied to you solely for your information, and its contents, information or data may not be reproduced,
redistributed or passed on, directly or indirectly.
Neither Angel One Limited, nor its directors, employees or affiliates shall be liable for any loss or damage that may arise from or in
connection with the use of this information. Angel or its associates or Research Analyst or his relative might have financial interest
in the subject company. Research analyst has not served as an officer, director or employee of the subject company.
