May 24, 2022
www.angelone.in
Technical & Derivatives
Report
Nifty Bank Outlook
-
(34248)
Similar to benchmark, the banking index too opened higher and
remained at elevated levels for the most part of the session. In
this process, the BANKNIFTY moved closer to the key resistance
zone of 34800 – 35000. Some of the banking counters were
doing extremely good around the mid-session; but all of a
sudden, the selling reappeared across the broader market. In
fact, it intensified towards the end to pare down all gains and
conclude marginally in the red.
It seems traders are perfectly respecting all technical levels as
yesterday we took a U-turn precisely after entering a strong
hurdle of ’20-day EMA’ placed around 34800 – 35000. Within no
time, banking index fell nearly 600 points from day’s high, which
does not bode well for the bulls. For the coming session, the
resistance remains at mentioned levels of 34800 – 35000 and
till the time, we do not surpass it, one should avoid aggressive
longs in banking counters. On the flipside, the sacrosanct
support is placed in the zone of 34000 – 33800. Traders are
advised to trade the range and hence, the strategy has to be buy
near supports and exit as close as possible to resistances.
Key Levels
Support 1 – 34000 Resistance 1 – 34800
Support 2 – 33800 Resistance 2 – 35000
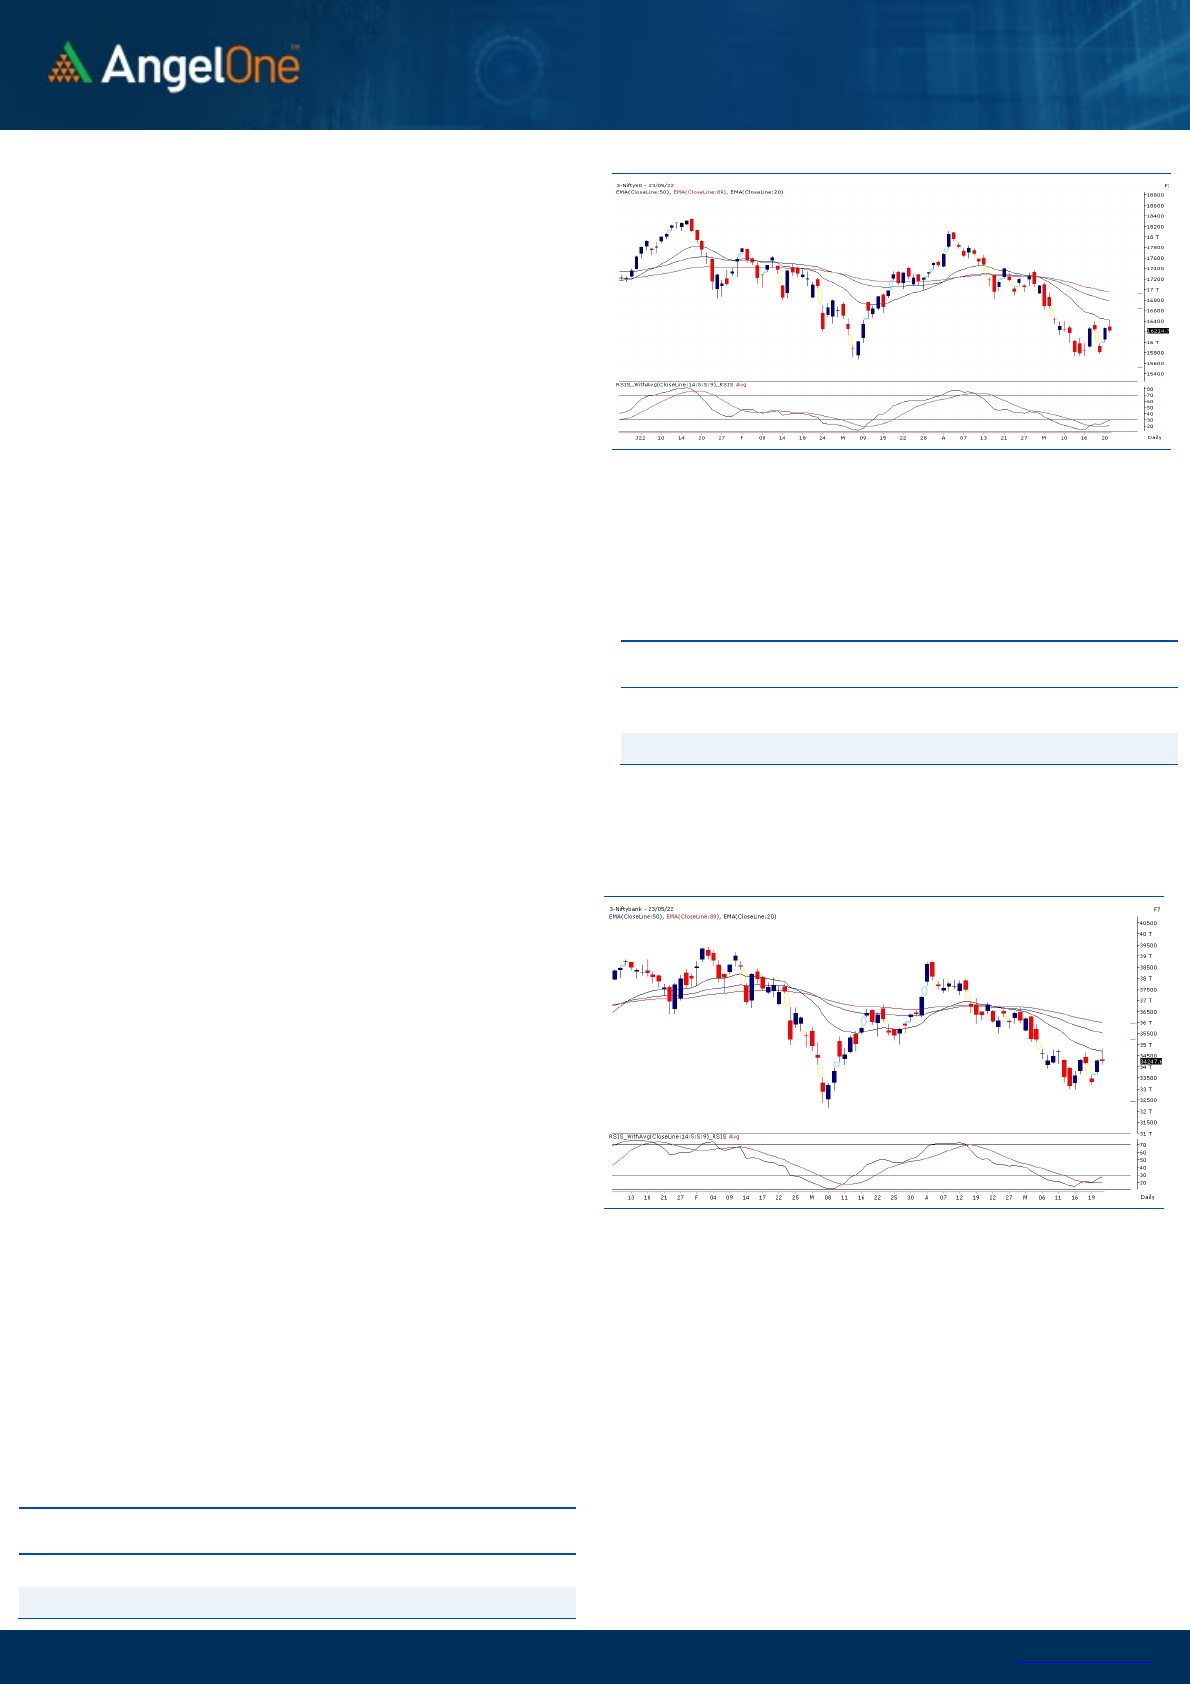
Exhibit 1: Nifty Daily Chart
Exhibit 2: Nifty Bank Daily Chart
Sensex (54289) /
Nifty (16215)
The Indian equity market started the day with high volatility at the
opening bell, led by mixed global cues and domestic macro
developments over the weekend. The benchmark index Nifty50
soon collected optimism and progressed upwards to test the
crucial resistance zone of 16400 odd levels. Though in the latter
half, the momentum depleted as broad-based profit booking was
seen in various counters, and the benchmark index pared down
all the initial gains to conclude the day a tad above 16200 levels
with a mere cut of 0.32 percent.
We allude to our previous commentary of not being complacent
with single-day momentum until the sturdy hurdle of the unfilled
gap at the 16480-16650 zone is not taken out by the bulls, that
certainly is seen in the market. The undertone is expected to
remain upbeat till the index holds over the 16000 psychological
mark. And looking at the technical setup, the market is likely to
trade in the mentioned slender range till a decisive breakout is
not seen on either side in the near period. Meanwhile, broad-
based traction has been observed across the bourses on the
sectoral front, wherein the significant benefactors that boosted
the positive sentiments were the Auto and IT space. At the same
time, the crackdown in the metal sector has dampened the
overall sentiments in the market.
Going forward, where the index is
likely to remain in the
slender range, many stock-specific adjustments are likely to
continue. Hence, traders are advised to have a stock-centric
approach and stay abreast with the global and domestic
developments on a regular basis.
Key Levels
Support 1 – 16100 Resistance 1 – 16400
Support 2 – 16000 Resistance 2 – 16500

www.angelone.in
Technical & Derivatives Report
May 24, 2022
View
Post Friday strong close, we began the week
slightly positive and then follow-up buying emerged
to once again test 16400 but unfortunately the index
couldn’t sustain at higher levels to conclude the day
tad above 16200.
FIIs were net sellers in the cash market segment
to the tune of Rs. 1951 crores. Simultaneously, in
Index futures, they sold marginally with a decent
fall in open interest, indicating blend of long
unwinding and short covering.
Despite decent volatility, we could hardly see any
relevant open interest change in both the indices.
Stronger hands continue to curb liquidity from
Indian equity market but added bullish bets in stock
futures. In index options front, some build-up was
seen in 16100 put strike which could act as a support
zone now. On the other side, 16400 and 16500 call
strikes added fresh positions. At current juncture,
16000-16100 is the immediate demand zone and we
believe until we manage to sustain above same
traders should use decline to add longs. On the
higher side, around 16400 is the strong hurdle and
sustain move beyond same shall boost the overall
sentiments.
Comments
The Nifty futures open interest has increased by 1.24%.
and BANK Nifty futures open interest has decreased by
0.27% as the market closed at 16214.70.
The Nifty May future closed with a discount of 31.35 point
against a discount of 12.90 point in the last trading
session. The June series closed at a discount of 34.95
point.
The INDIA VIX increased from 23.10 to 23.39. At the same
time, the PCR-OI of Nifty decreased from 1.07 to 1.01.
Few of the liquid counters where we have seen high
cost of carry are COLPAL, RBLBANK, METROPOLIS,
ABFRL and JINDALSTEL.
Historical Volatility
SCRIP HV
JINDALSTEL 63.99
JSWSTEEL 51.65
DIVISLAB 37.72
NMDC 51.63
TATASTEEL 53.94
Nifty Vs OI
15200
15400
15600
15800
16000
16200
16400
16600
16800
5,000
6,000
7,000
8,000
9,000
10,000
11,000
12,000
13,000
14,000
15,000
5-4 5-6 5-10 5-12 5-16 5-18 5-20
Openinterest Nifty
OI Gainers
SCRIP OI
OI
CHG. (%)
PRICE
PRICE
CHG. (%)
ABB 511500 33.20 2297.00 0.35
JINDALSTEL 34822500 22.43 395.55 -17.08
ASTRAL 922350 20.39 1700.90 0.82
UBL 1238050 19.13 1463.70 -1.14
M&M 14391300 15.87 941.90 3.82
HAL 2681375 15.44 1815.85 3.28
CUMMINSIND 1412400 12.69 1014.70 0.24
APLLTD 1483300 12.41 761.45 0.91
OI Losers
SCRIP OI
OI
CHG. (%)
PRICE
PRICE
CHG. (%)
BHEL 105357000 -20.11 51.10 -3.85
GNFC 3890900 -14.41 661.85 4.21
IRCTC 13750625 -12.60 653.25 -1.13
ABBOTINDIA 27270 -11.36 17738.10 -1.69
BAJAJ-AUTO 2981500 -11.09 3786.15 0.23
INDIAMART 327900 -9.71 4279.10 0.54
L&TFH 51830592 -9.29 76.75 0.46
IEX 43908750 -8.52 193.80 -0.33
Put-Call Ratio
SCRIP PCR (OI) PCR (VOL)
NIFTY 1.01 0.84
BANKNIFTY 0.91 0.91
RELIANCE 0.43 0.37
ICICIBANK 0.51 0.46
INFY 0.40 0.39

www.angelone.in
Technical & Derivatives Report
May 24, 2022
Note: Above mentioned Bullish or Bearish Spreads in Nifty (May Series) are given as an information and not as a recommendation.
Nifty Spot = 162
14.70
FII Statistics for
May
2
3
, 2022
Detail Buy
Contracts
Open
Interest
Value
(in Cr.)
Sell
Net
CHANGE
INDEX
FUTURES
4838.54 5759.31 (920.77) 183823 14723.13 11.05
INDEX
OPTIONS
1056857.01 1039952.96 16904.05
1528187 121736.38 (21.31)
STOCK
FUTURES
19544.89 19501.12 43.77
2417214 145668.64 3.37
STOCK
OPTIONS
9274.52 9296.75 (22.23) 160967 10064.66 1.80
Total
1090514.96
1074510.14
16004.82
4290191
292192.81
(6.82)
Turnover on
May
23
, 2022
Instrument
No. of
Contracts
Turnover
( in Cr. )
Change
(%)
Index
Futures
546397 45544.05 2.41
Index
Options
76340023 6426504.79
29.30
Stock
Futures
2287767 139986.01
72.24
Stock
Options
4744963 306511.14
6.12
Total
47,44,963 306511.14
28.48
Bull
-
Call Spreads
Action Strike Price Risk Reward BEP
Buy
16200 143.40
45.45
54.55
16245.45
Sell
16300 97.95
Buy
16200 143.40
80.90
119.10
16280.90
Sell
16400 62.50
Buy
16300 97.95
35.45 64.55 16335.45
Sell 16400 62.50
Bear
-
Put Spreads
Action Strike Price Risk Reward BEP
Buy
16200 153.15
42.25
57.75
16157.75
Sell
16100 117.90
Buy
16200 153.15
73.70
126.30
16126.30
Sell
16000 90.00
Buy
16100 117.90
31.45 68.55 16068.55
Sell
16000 90.00
Nifty
Put
-
Call Analysis
,0
1000,000
2000,000
3000,000
4000,000
5000,000
6000,000
7000,000
8000,000
15600 15700 15800 15900 16000 16100 16200 16300 16400 16500 16600 16700 16800 16900
Call Put

www.angelone.in
Technical & Derivatives Report
May 24, 2022
`
Daily Pivot Levels for Nifty Constituents
Scrips
S2
S1
PIVOT
R1
R2
ADANIPORTS 733 743
762 772 790
APOLLOHOSP 3,617 3,667
3,716 3,766 3,815
ASIANPAINT 3,106 3,140
3,164 3,198 3,222
AXISBANK 660 668
676 684 692
BAJAJ-AUTO 3,706 3,746
3,810 3,850 3,915
BAJFINANCE 5,689 5,741
5,824 5,876 5,959
BAJAJFINSV 12,328 12,451
12,622 12,745 12,916
BPCL 323 327
332 337 341
BHARTIARTL 672 679
686 693 701
BRITANNIA 3,405 3,446
3,492 3,533 3,579
CIPLA 953 962
975 983 996
COALINDIA 180 182
184 187 189
DIVISLAB 3,506 3,702
4,070 4,266 4,635
DRREDDY 4,189 4,232
4,279 4,323 4,370
EICHERMOT 2,689 2,715
2,741 2,768 2,794
GRASIM 1,415 1,436
1,473 1,495 1,532
HCLTECH 1,001 1,010
1,023 1,032 1,046
HDFCBANK 1,280 1,292
1,311 1,323 1,342
HDFCLIFE 536 544
550 557 564
HDFC 2,132 2,154
2,187 2,210 2,243
HEROMOTOCO 2,556 2,590
2,645 2,680 2,734
HINDALCO 390 401
411 423 432
HINDUNILVR 2,276 2,328
2,358 2,410 2,440
ICICIBANK 696 704
715 722 733
INDUSINDBK 885 894
908 917 931
INFY 1,431 1,450
1,469 1,488 1,507
ITC 269 272
276 279 283
JSW STEEL 503 525
560 582 616
KOTAKBANK 1,825 1,840
1,856 1,870 1,886
LT 1,582 1,613
1,637 1,668 1,691
M&M 899 920
932 953 965
MARUTI 7,697 7,797
7,876 7,976 8,055
NESTLEIND 16,633 16,814
17,092 17,272 17,551
NTPC 144 147
151 154 158
ONGC 148 152
158 161 168
POWERGRID 219 222
227 230 235
RELIANCE 2,557 2,582
2,618 2,643 2,678
SBILIFE 1,047 1,062
1,077 1,092 1,107
SHREECEM 21,531 21,736
21,956 22,161 22,380
SBIN 452 456
464 468 476
SUNPHARMA 909 915
923 930 938
TCS 3,237 3,280
3,309 3,351 3,381
TATACONSUM
715 722
736 743 756
TATAMOTORS 412 417
424 429 436
TATASTEEL 945 984
1,041 1,079 1,136
TECHM 1,103 1,123
1,135 1,155 1,168
TITAN 2,101 2,126
2,163 2,188 2,225
ULTRACEMCO 5,689 5,803
6,013 6,127 6,337
UPL 772 782
798 808 825
WIPRO 453 460
464 470 474

www.angelone.in
Technical & Derivatives Report
May 24, 2022
*
Technical and Derivatives Team:
Sameet Chavan
Chief Analyst
–
Technical & Derivatives
sameet.chavan@angelone.in
Sneha Seth Senior Analyst – Technical & Derivatives sneha.seth@angelone.in
Rajesh Bhosale Technical Analyst rajesh.bhosle@angelone.in
Osho Krishan Senior Analyst – Technical & Derivatives osho.krishan@angelone.in
Research Team Tel: 022 – 39357600 (Extn. 6844) Website: www.angelone.in
For Technical Queries E-mail: technicalresearch-cso@angelone.in
For Derivatives Queries E-mail: derivatives.desk@angelone.in
DISCLAIMER
Angel One Limited (hereinafter referred to as “Angel”) is a registered Member of National Stock Exchange of India Limited, Bombay
Stock Exchange Limited and Metropolitan Stock Exchange Limited. It is also registered as a Depository Participant with CDSL and
Portfolio Manager and investment advisor with SEBI. It also has registration with AMFI as a Mutual Fund Distributor. Angel One
Limited is a registered entity with SEBI for Research Analyst in terms of SEBI (Research Analyst) Regulations, 2014 vide registration
number INH000000164. Angel or its associates has not been debarred/ suspended by SEBI or any other regulatory authority for
accessing /dealing in securities Market.
This document is solely for the personal information of the recipient, and must not be singularly used as the basis of any investment
decision. Nothing in this document should be construed as investment or financial advice. Each recipient of this document should
make such investigations as they deem necessary to arrive at an independent evaluation of an investment in the securities of the
companies referred to in this document (including the merits and risks involved), and should consult their own advisors to determine
the merits and risks of such an investment.
Angel or its associates or research analyst or his relative may have actual/beneficial ownership of 1% or more in the securities of
the subject company at the end of the month immediately preceding the date of publication of the research report. Neither Angel or
its associates nor Research Analysts or his relative has any material conflict of interest at the time of publication of research report.
Angel or its associates might have received any compensation from the companies mentioned in the report during the period
preceding twelve months from the date of this report for services in respect of managing or co-managing public offerings, corporate
finance, investment banking or merchant banking, brokerage services or other advisory service in a merger or specific transaction
in the normal course of business. Angel or its associates did not receive any compensation or other benefits from the companies
mentioned in the report or third party in connection with the research report. Neither Angel nor its research analyst entity has been
engaged in market making activity for the subject company.
Reports based on technical and derivative analysis center on studying charts of a stock's price movement, outstanding positions and
trading volume, as opposed to focusing on a company's fundamentals and, as such, may not match with a report on a company's
fundamentals. Investors are advised to refer the Fundamental and Technical Research Reports available on our website to evaluate
the contrary view, if any.
The information in this document has been printed on the basis of publicly available information, internal data and other reliable
sources believed to be true, but we do not represent that it is accurate or complete and it should not be relied on as such, as this
document is for general guidance only. Angel One Limited or any of its affiliates/ group companies shall not be in any way responsible
for any loss or damage that may arise to any person from any inadvertent error in the information contained in this report. Angel One
Limited has not independently verified all the information contained within this document. Accordingly, we cannot testify, nor make
any representation or warranty, express or implied, to the accuracy, contents or data contained within this document. While Angel
One Limited endeavors to update on a reasonable basis the information discussed in this material, there may be regulatory,
compliance, or other reasons that prevent us from doing so.
This document is being supplied to you solely for your information, and its contents, information or data may not be reproduced,
redistributed or passed on, directly or indirectly.
Neither Angel One Limited, nor its directors, employees or affiliates shall be liable for any loss or damage that may arise from or in
connection with the use of this information. Angel or its associates or Research Analyst or his relative might have financial interest
in the subject company. Research analyst has not served as an officer, director or employee of the subject company.
