FEB 24, 2023
www.angelone.in
Technical & Derivatives Report
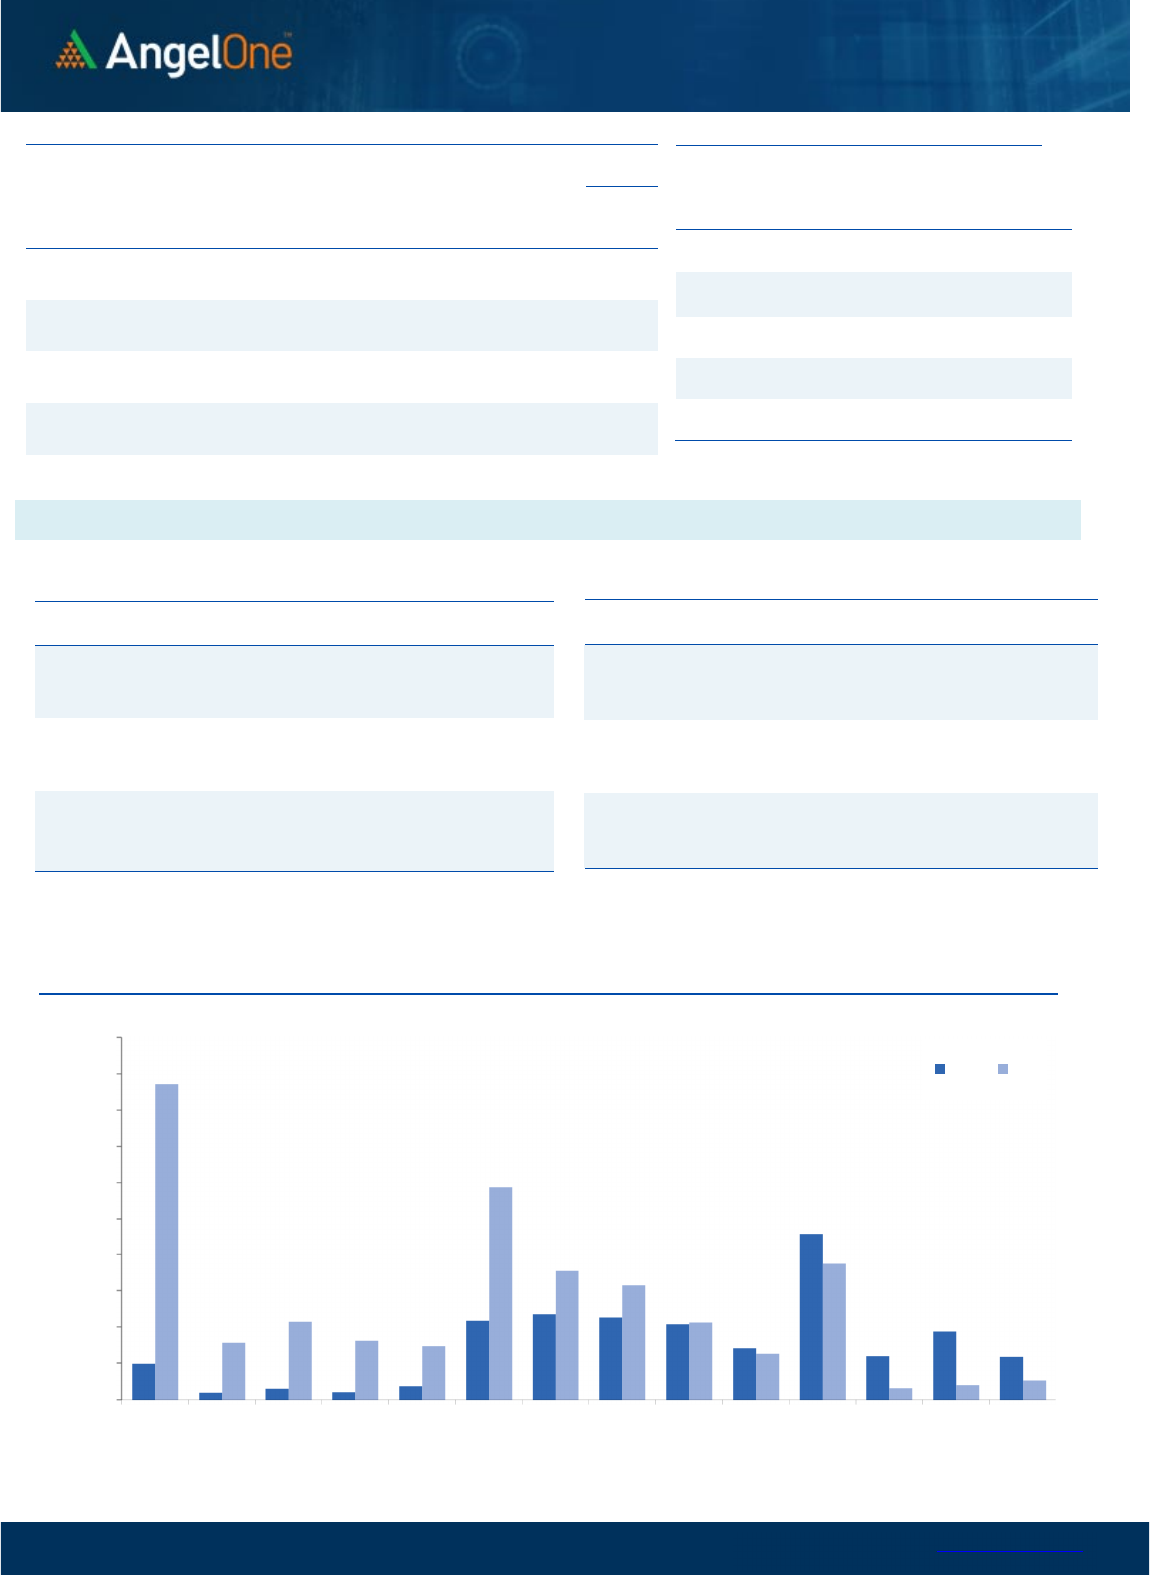
Nifty Bank
Outlook (
40002
)
Bank Nifty started on a flat note but the rub-off effect from the
previous session dragged the prices lower during the initial few
minutes. The oversold market conditions then triggered a bounce
back to regain the lost ground however there was a lack of follow-
up buying and prices remained within a range for the remaining
part of the F&O expiry session. Bank Nifty ended without any major
change tad above 40000.
In our yesterday's outlook, we mentioned a key trend line support
and prices have defended the support to form a 'Dragon Fly Doji'
pattern. As per the pattern if prices sustain above yesterday's high
(40200) then we can expect a strong bounce back in the highly
oversold conditions. In such a scenario, 40200 followed by 40800
would be closely watched. On the lower side, the recent swing low
coinciding with 200SMA around the 39200 - 39000 zone remains
sacrosanct support. We reiterate to avoid short positions at
current levels and traders should keep a tab on the above levels to
look for long opportunities.
Key Levels
Support 1 – 39800 Resistance 1 – 40200
Support 2 – 39600 Resistance 2 – 40800
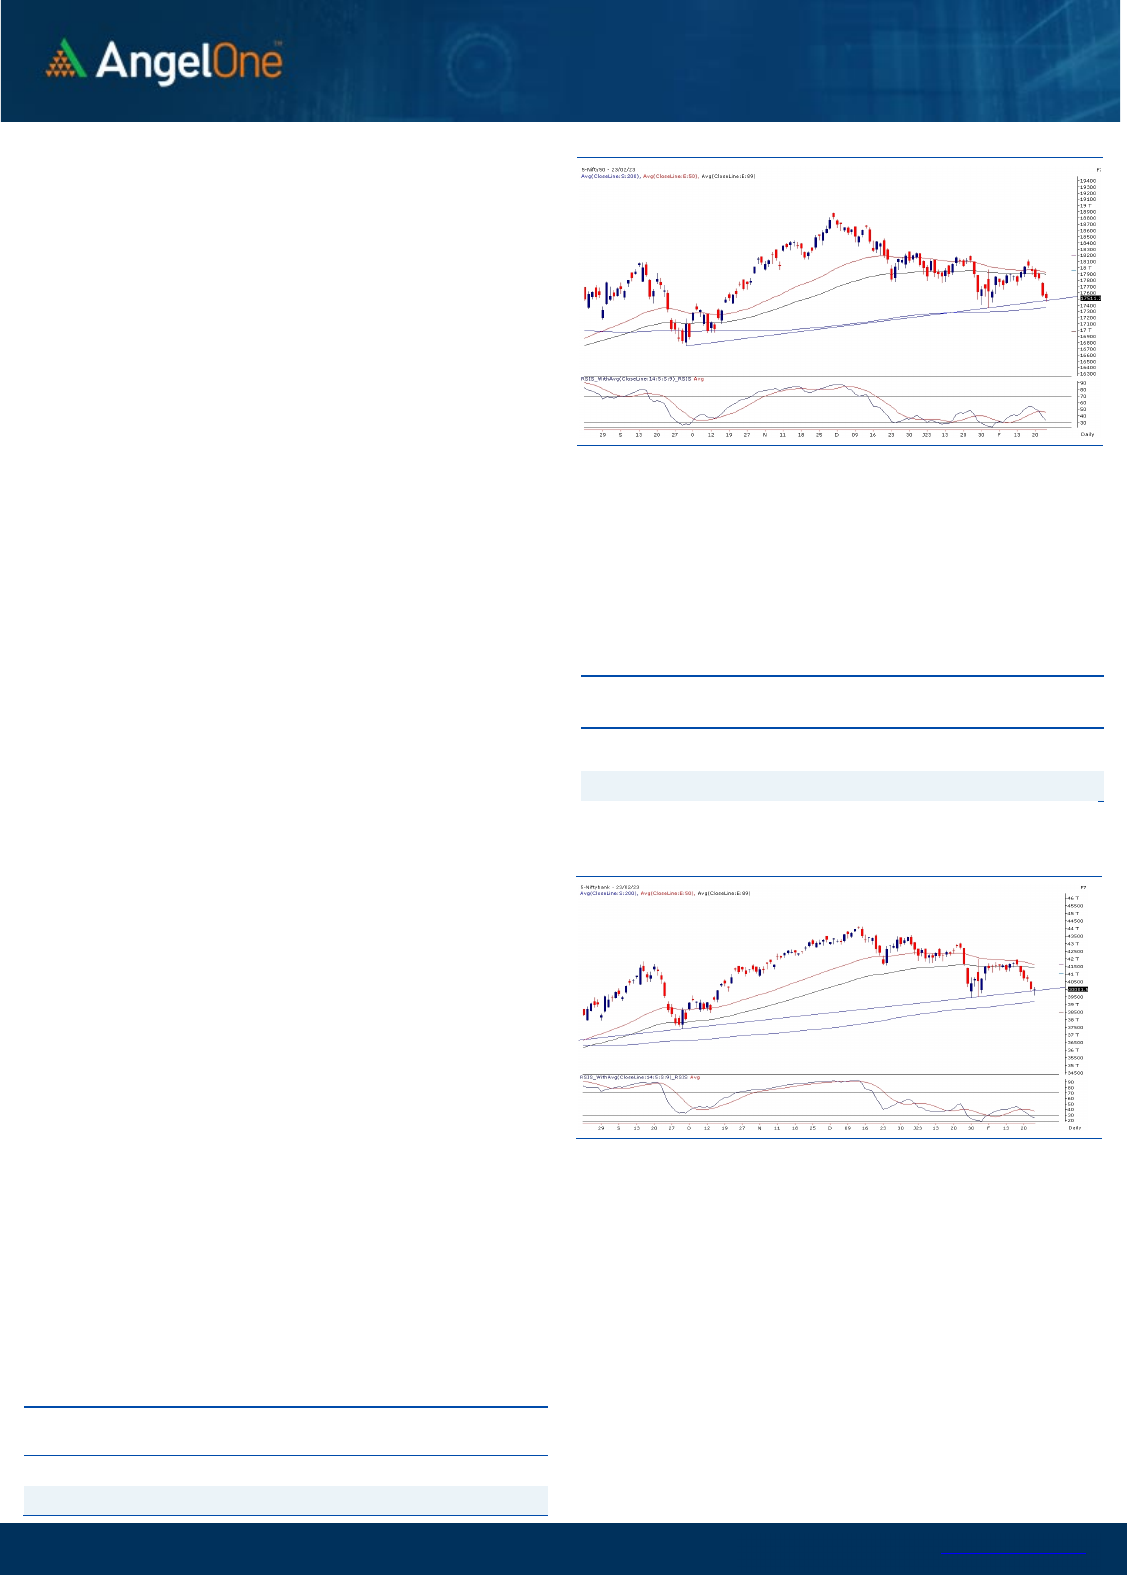
Exhibit 1: Nifty Daily Chart
Exhibit 2: Nifty Bank Daily Chart
Sensex (
59
606
) / Nifty (
1
7
5
11
)
Our market started the session with marginal gains but soon after
the sell off resumed to test the 17450 mark. The oversold markets
then rebounded sharply post the initial hour to hasten towards
17600 in a flash. However, due to lack of follow up buying, the
momentum fizzed out at higher levels. During the remaining part of
the session, the Nifty remained sideways and with some weakness
towards the end resulted in Nifty concluding the February series on
a weak note, tad above 17500.
It’s been a challenging series for our markets in general, especially
the latter part where we observed tremendous weakness across the
broader market. Taking a glance at the broader price action, all key
indices have reached their crucial support zones. We can see them
placed around the multi-month trend line levels. Since it was mostly
financial led down move recently, the other indices like, BANKNIFTY
and FINNIFTY have rebounded sharply and formed a ‘Dragonfly Doji’
pattern precisely at ‘Trendline’ and ‘200-SMA’, respectively. Hence,
if global market supports, we will not be surprised to see some
recovery in coming sessions.
Hopefully, the key support for Nifty around 17450 – 17350
remains intact and the moment we get a strong close above
17700 – 17800, we may see a good sustainable rally in the March
series. Let’s see how things pan out going ahead. Traders are
advised to avoid creating fresh shorts here and should ideally
keep a close eye on recent draggers who are trading around key
supports, can certainly provide better trading opportunities.
Key Levels
Support 1 – 17400 Resistance 1 – 17700
Support 2 – 17350 Resistance 2 – 17750

www.angelone.in
Technical & Derivatives Report
FEB 24, 2023
View
We saw a slightly positive start but soon follow-up
selling was seen to drag index towards 17450.
However, we saw index recovering to reclaim 17600
but failed to sustain and hence we saw some
sideways move to finally end the day tad above
17500.
FIIs were net sellers in the cash market segment to
the tune of Rs. 1417 crores. Simultaneously, in Index
futures, they sold worth Rs. 1246 crores with massive
decline in open interest, mainly due to expiry.
During February series, we saw addition of shorts in
both the key indices. Rollover in Nifty and BankNifty
stood at 73% and 84% respectively, which is below
the three month average figure. However, we saw
open interest addition series on series and especially
banking index which added more than 35%,
suggesting decent amount of positions have been
rolled over to March series. Stronger hands have
been adding shorts and they also preferred rolling
over same hence their index futures ‘Long Short
Ratio’ declined to 19% from 38% seen during start of
the February series. The above data hints, decent
portion of shorts are intact in system and considering
FIIs LSR, we believe market is extremely oversold for
now. Hence, traders should lighten up shorts if any.
Comments
The Nifty futures open interest has decreased by
15.11% and Bank Nifty futures open interest has
decreased by 12.59% as the market closed at 17511.25.
The Nifty March future closed with a premium of
111.75 point against a premium of 107.75 point in the
last trading session. The April series closed at a
premium of 213.15 point.
The INDIA VIX decreased from 15.58 to 15.07. At the
same time, the PCR-OI of Nifty has increased from 0.69
to 0.93.
Few of the liquid counters where we have seen high
cost of carry are COALINDIA, AARTIIND, CUB,
RAMCOCEM and CANBK.
Historical Volatility
SCRIP HV
ASIANPAINT 29.93
IDEA 72.10
INDUSTOWER 50.98
GAIL 35.04
ZEEL 52.95
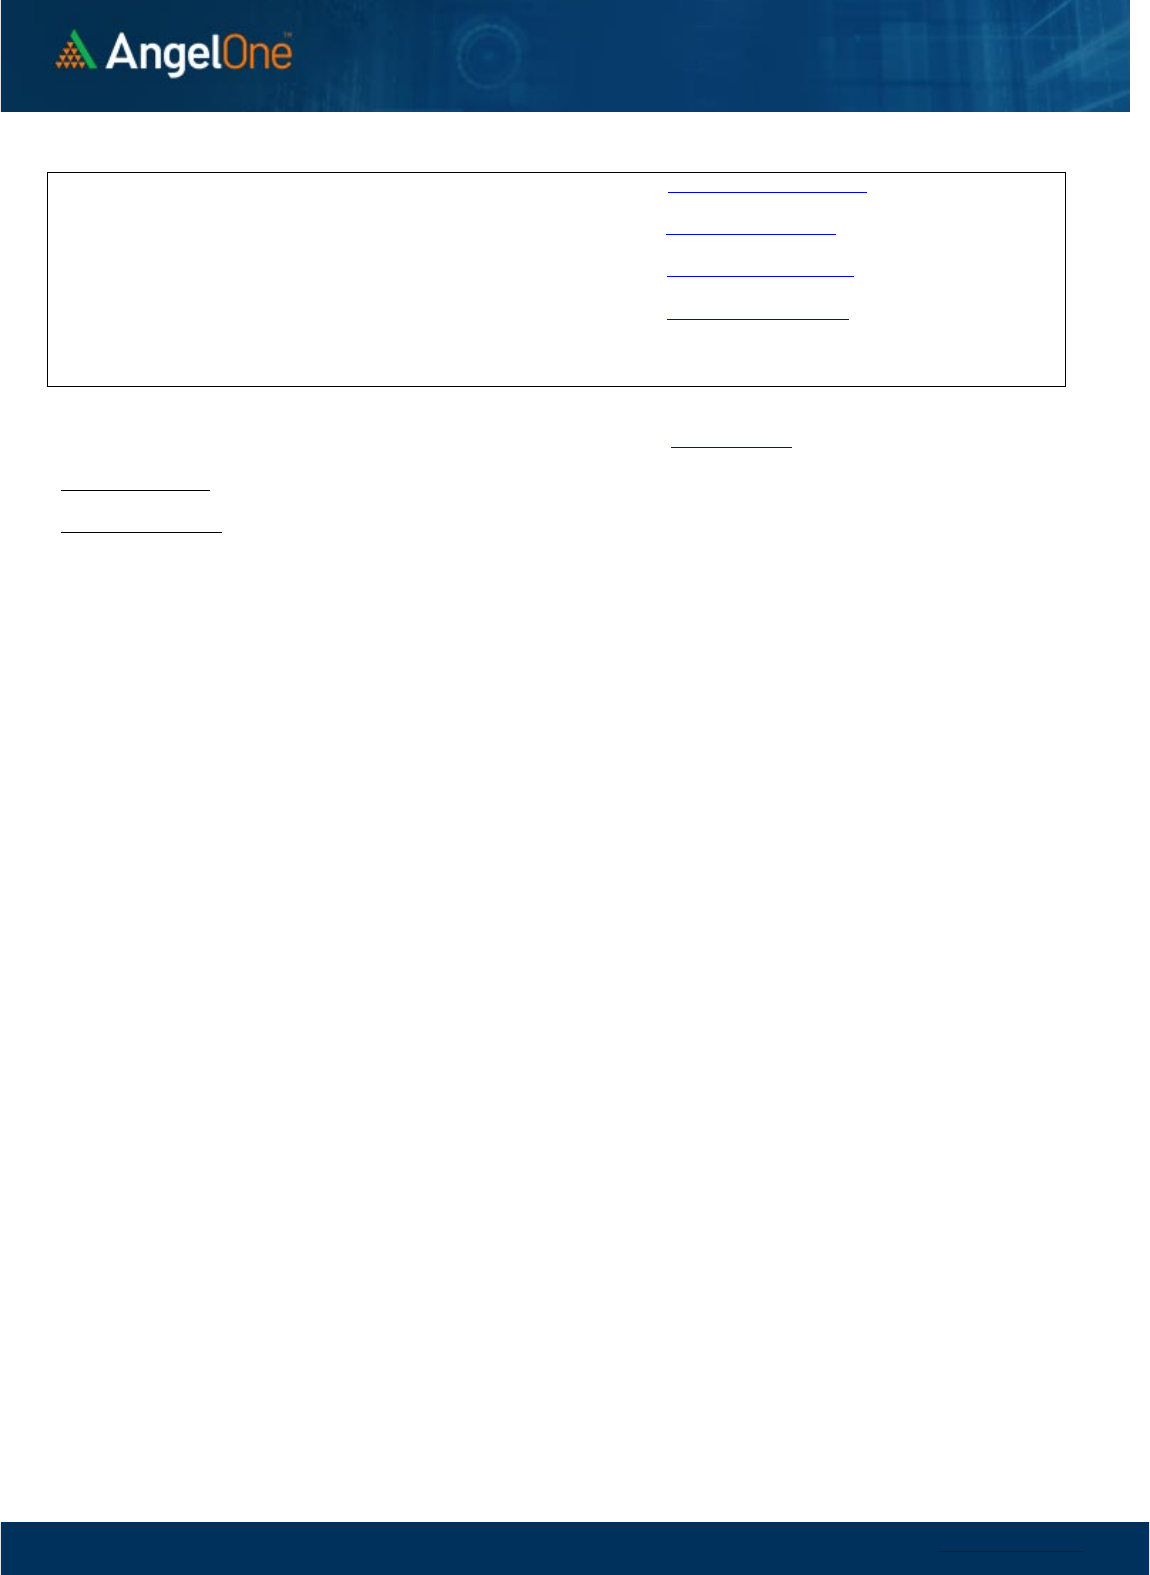
Nifty Vs OI
17400
17500
17600
17700
17800
17900
18000
18100
18200
4,000
6,000
8,000
10,000
12,000
14,000
16,000
2/2 2/7 2/9 2/13 2/15 2/17 2/22
Openinterest Nifty
OI Gainers
SCRIP OI
OI
CHG. (%)
PRICE
PRICE
CHG. (%)
NMDC 45927000 6.32 117.05 1.68
ABBOTINDIA 47600 2.94 20490.20 1.69
HDFCAMC 2273400 2.39 1779.60 -2.38
ASIANPAINT 7812200 1.72 2705.95 -3.11
HDFCBANK 64499600 1.41 1603.25 -0.65
DLF 45462450 1.07 342.90 -1.40
IDFC 175930000 0.24 74.35 1.08
ZEEL 81288000 0.06 198.65 -3.31
OI Losers
SCRIP OI
OI
CHG. (%)
PRICE
PRICE
CHG. (%)
IDEA 435820000 -38.30 6.70 -6.34
NAVINFLUOR 367050 -36.79 4178.00 -1.41
COFORGE 962250 -35.39 4420.90 1.61
UBL 1129200 -34.49 1447.15 1.43
ONGC 35088900 -24.78 154.65 0.71
INDIGO 3457800 -23.71 1865.00 1.66
SYNGENE 2467000 -23.48 584.70 0.68
ALKEM 501200 -22.13 3275.50 0.19
Put-Call Ratio
SCRIP PCR (OI) PCR (VOL)
NIFTY 0.93 0.76
BANKNIFTY 0.71 0.72
RELIANCE 0.73 0.51
ICICIBANK 0.88 0.71
INFY 0.66 0.62
www.angelone.in
Technical & Derivatives Report
FEB 24, 2023
Note: Above mentioned Bullish or Bearish Spreads in Nifty (March Series) are given as an information and not as a recommendation.
Nifty Spot =
1
7
5
11.25
0900
Lot Size = 75
FII Statistics for
February
2
3
, 202
3
Detail Buy
Contracts
Open
Interest
Value
(in Cr.)
Sell
Net
CHANGE
INDEX
FUTURES
8119.92 9365.70 (1245.78) 171025 15580.09 (13.63)
INDEX
OPTIONS
2971648.49 2943287.14 28361.35
1820805 164238.41 (38.69)
STOCK
FUTURES
24411.75 25027.43 (615.68) 2145170 140354.69 (4.70)
STOCK
OPTIONS
5746.01 5887.83 (141.82) 29445 1916.22 (83.69)
Total 3009926.17
2983568.10
26358.07
4166445
322089.41
(25.59)
Turnover
on
February
2
3
, 202
3
Instrumen
t
No. of
Contracts
Turnover
( in Cr. )
Change
(%)
Index Futures
649698
60806.73 23.19
Index Options
4041149
06
64901.37 23.02
Stock Futures
2144963
137030.79 1.74
Stock Options
2701839
2923.32 4.24
Total
2,701,83
9
2923.32 10.87
Bull-Call Spreads
Action Strike Price Risk Reward BEP
Buy
17500 340.10
56.60
43.40
17556.60
Sell
17600 283.50
Buy
17500 340.10
110.20
89.80
17610.20
Sell
17700 229.90
Buy
17600 283.50
53.60 46.40 17653.60
Sell
17700 229.90
Bear-Put Spreads
Action Strike Price Risk Reward BEP
Buy
17500 219.85
37.65
62.35
17462.35
Sell 17400 182.20
Buy 17500 219.85
67.00
133.00
17433.00
Sell
17300 152.85
Buy
17400 182.20
29.35 70.65 17370.65
Sell 17300 152.85
Nifty Put-Call Analysis
,0
500,000
1000,000
1500,000
2000,000
2500,000
3000,000
3500,000
4000,000
4500,000
5000,000
17000 17100 17200 17300 17400 17500 17600 17700 17800 17900 18000 18100 18200 18300
Call Put

www.angelone.in
Technical & Derivatives Report
FEB 24, 2023
`
Daily
Pivot Levels for Nifty
Constituents
Scrips
S2
S1
PIVOT
R1
R2
ADANIENT
1,302
1,342
1,390
1,430
1,478
ADANIPORTS 523 538
548
562
572
APOLLOHOSP
4,338
4,393
4,456
4,511
4,573
ASIANPAINT
2,632
2,669
2,737
2,774
2,843
AXISBANK 823 834
841
852
859
BAJAJ-AUTO
3,782
3,807
3,840
3,865
3,898
BAJFINANCE
6,056
6,129
6,196
6,269
6,336
BAJAJFINSV
1,326
1,337
1,351
1,362
1,376
BPCL 315 318
321
323
326
BHARTIARTL 752 757
767
773
783
BRITANNIA
4,386
4,419
4,457
4,490
4,529
CIPLA 950 955
961
967
973
COALINDIA 211 213
214
216
218
DIVISLAB
2,822
2,848
2,891
2,917
2,960
DRREDDY
4,395
4,422
4,469
4,496
4,543
EICHERMOT
3,192
3,217
3,246
3,271
3,300
GRASIM
1,559
1,570
1,579
1,590
1,599
HCLTECH
1,080
1,087
1,100
1,107
1,119
HDFCBANK
1,578
1,591
1,605
1,617
1,631
HDFCLIFE
481
484
489
492
498
HDFC
2,564
2,582
2,600
2,618
2,636
HEROMOTOCO
2,467
2,481
2,497
2,511
2,527
HINDALCO 427 432
435
440
443
HINDUNILVR
2,460
2,475
2,496
2,511
2,531
ICICIBANK 828 834
839
845
850
INDUSINDBK
1,049
1,062
1,080
1,093
1,111
INFY
1,535
1,543
1,556
1,564
1,578
ITC 377 382
388
393
399
JSW STEEL 691 696
705
710
719
KOTAKBANK
1,677
1,692
1,703
1,718
1,729
LT
2,119
2,139
2,174
2,194
2,228
M&M
1,294
1,304
1,315
1,325
1,336
MARUTI
8,555
8,626
8,687
8,757
8,818
NESTLEIND
18,401
18,525
18,674
18,798
18,948
NTPC 167 169
170
171
173
ONGC 152 153
155
156
158
POWERGRID 211 212
214
215
217
RELIANCE
2,341
2,354
2,375
2,388
2,408
SBILIFE
1,116
1,126
1,134
1,144
1,152
SBIN 506 514
519
526
531
SUNPHARMA 958 965
971
978
984
TCS
3,380
3,397
3,425
3,441
3,469
TATACONSUM
709 712
719
722
729
TATAMOTORS 423 428
432
437
442
TATASTEEL 110 111
112
113
115
TECHM
1,109
1,119
1,134
1,144
1,160
TITAN
2,350
2,372
2,402
2,425
2,455
ULTRACEMCO
7,071
7,124
7,195
7,248
7,319
UPL 731 738
747
755
764
WIPRO 390 392
395
397
401
www.angelone.in
Technical & Derivatives Report
FEB 24, 2023
*
Technical and Derivatives Team:
Sameet Chavan Chief Analyst – Technical & Derivatives sameet.chavan@angelone.in
Sneha Seth Senior Analyst – Technical & Derivatives sneha.seth@angelone.in
Rajesh Bhosale Technical Analyst rajesh.bhosle@angelone.in
Osho Krishan Senior Analyst – Technical & Derivatives osho.krishan@angelone.in
Research Team Tel: 022 – 39357600 Website: www.angelone.in
For Technical Queries E-mail: technicalresearch-cso@angelone.in
For Derivatives Queries E-mail: derivatives.desk@angelone.in
DISCLAIMER
Angel One Limited (hereinafter referred to as “Angel”) is a registered Member of National Stock Exchange of India Limited, Bombay Stock Exchange
Limited and Metropolitan Stock Exchange Limited. It is also registered as a Depository Participant with CDSL and Portfolio Manager and investment
advisor with SEBI. It also has registration with AMFI as a Mutual Fund Distributor. Angel One Limited is a registered entity with SEBI for Research
Analyst in terms of SEBI (Research Analyst) Regulations, 2014 vide registration number INH000000164. Angel or its associates has not been
debarred/ suspended by SEBI or any other regulatory authority for accessing /dealing in securities Market.
This document is solely for the personal information of the recipient, and must not be singularly used as the basis of any investment decision.
Nothing in this document should be construed as investment or financial advice. Each recipient of this document should make such investigations
as they deem necessary to arrive at an independent evaluation of an investment in the securities of the companies referred to in this document
(including the merits and risks involved), and should consult their own advisors to determine the merits and risks of such an investment.
Angel or its associates or research analyst or his relative may have actual/beneficial ownership of 1% or more in the securities of the subject
company at the end of the month immediately preceding the date of publication of the research report. Neither Angel or its associates nor
Research Analysts or his relative has any material conflict of interest at the time of publication of research report.
Angel or its associates might have received any compensation from the companies mentioned in the report during the period preceding twelve
months from the date of this report for services in respect of managing or co-managing public offerings, corporate finance, investment banking or
merchant banking, brokerage services or other advisory service in a merger or specific transaction in the normal course of business. Angel or its
associates did not receive any compensation or other benefits from the companies mentioned in the report or third party in connection with the
research report. Neither Angel nor its research analyst entity has been engaged in market making activity for the subject company.
Reports based on technical and derivative analysis center on studying charts of a stock's price movement, outstanding positions and trading
volume, as opposed to focusing on a company's fundamentals and, as such, may not match with a report on a company's fundamentals. Investors
are advised to refer the Fundamental and Technical Research Reports available on our website to evaluate the contrary view, if any.
The information in this document has been printed on the basis of publicly available information, internal data and other reliable sources believed
to be true, but we do not represent that it is accurate or complete and it should not be relied on as such, as this document is for general guidance
only. Angel One Limited or any of its affiliates/ group companies shall not be in any way responsible for any loss or damage that may arise to any
person from any inadvertent error in the information contained in this report. Angel One Limited has not independently verified all the information
contained within this document. Accordingly, we cannot testify, nor make any representation or warranty, express or implied, to the accuracy,
contents or data contained within this document. While Angel One Limited endeavors to update on a reasonable basis the information discussed
in this material, there may be regulatory, compliance, or other reasons that prevent us from doing so.
This document is being supplied to you solely for your information, and its contents, information or data may not be reproduced, redistributed or
passed on, directly or indirectly.
Neither Angel One Limited, nor its directors, employees or affiliates shall be liable for any loss or damage that may arise from or in connection
with the use of this information. Angel or its associates or Research Analyst or his relative might have financial interest in the subject company.
Research analyst has not served as an officer, director or employee of the subject company.
