NOV 23, 2022
www.angelone.in
Technical & Derivatives Report
xOOOOOOOO
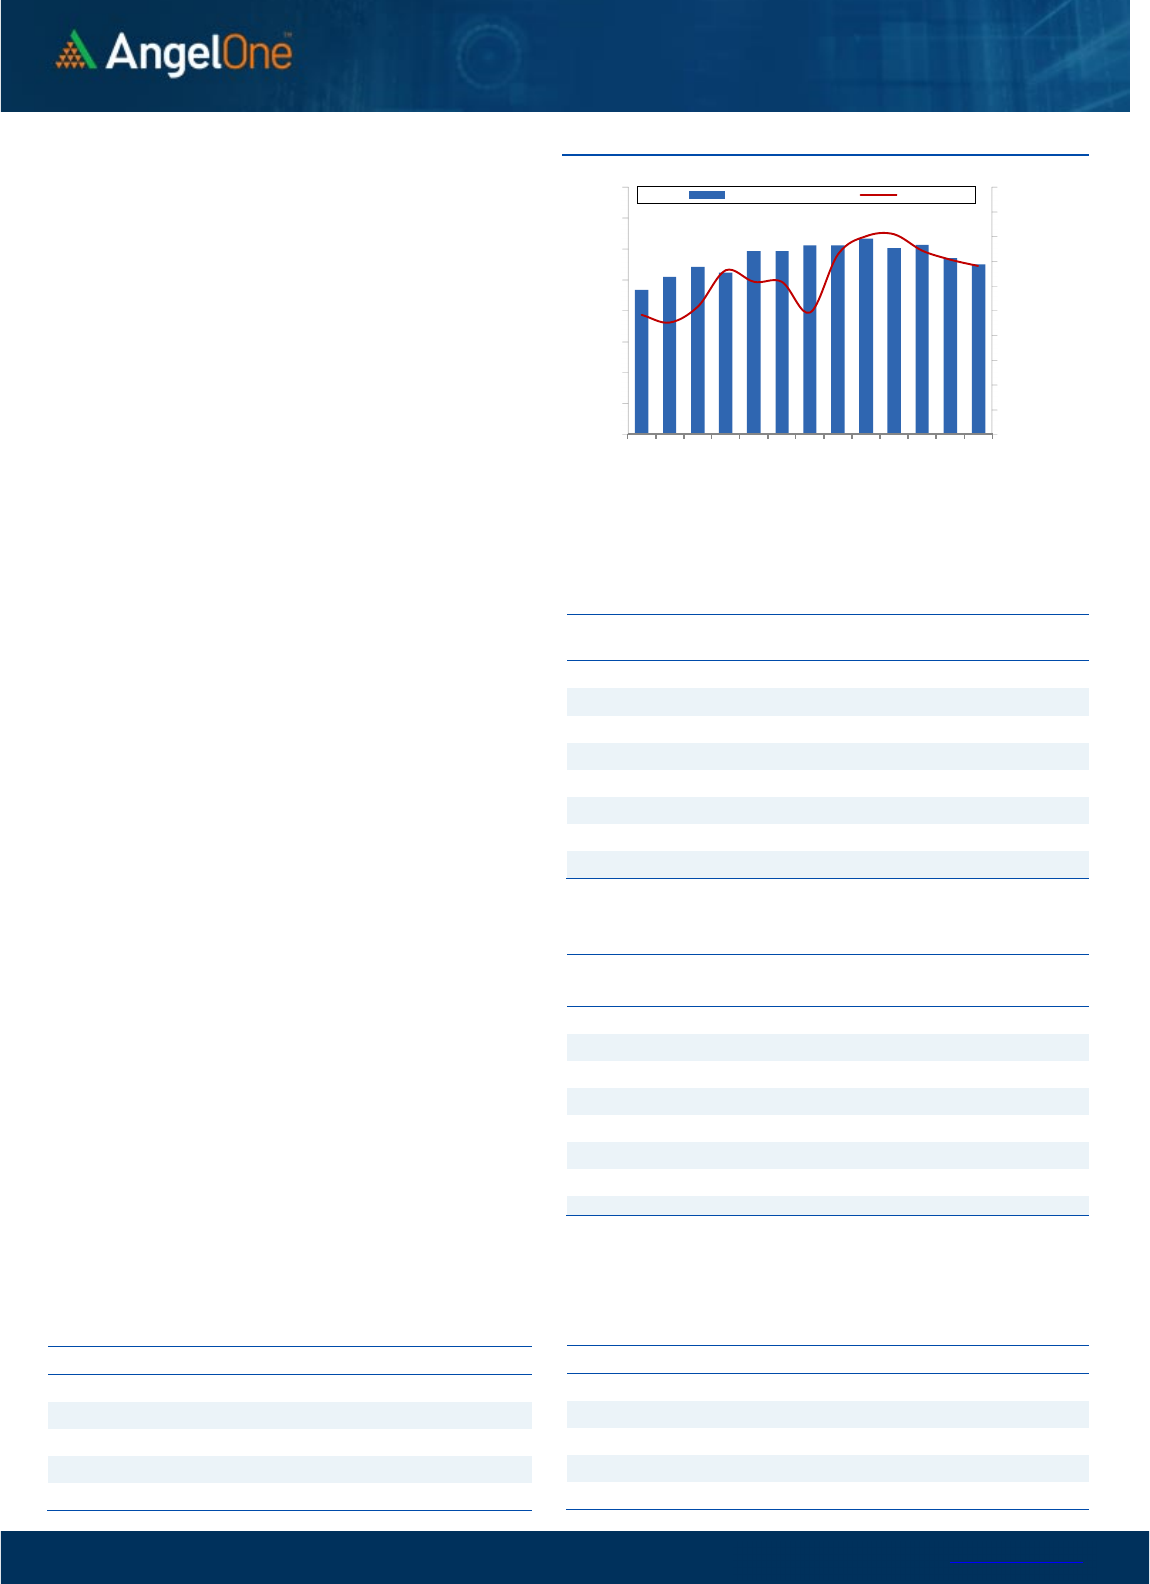
Nifty Bank Outlook (42457)
Bank Nifty started with a gap-up opening however there was a lack
of follow-up buying and the prices quickly gave away their gains.
The remaining part of the session continued with prices
consolidating within a range with eventually a spurt of buying was
seen again during the fag end. The bank index ended with gains of
0.26% at 42457.
The boredom continues as the prices continue to trade within a
very small range and we are witnessing very small candles on the
daily chart. As of now, there are no signs of momentum picking up
and 42200 - 42650 remains a key level to watch out for. It seems,
the market is waiting for some trigger and let's see if the monthly
expiry and rollover factor brings outs the momentum back. Till then
traders should continue to focus on the stock-centric approach that
continues to provide outperforming moves.
Ke
y
Levels
Support 1 – 42200 Resistance 1 – 42650
Support 2 – 42000 Resistance 2 – 43000
Exhibit 1: Nifty
Daily
Chart
Exhibit 2: Nifty Bank
Daily
Chart
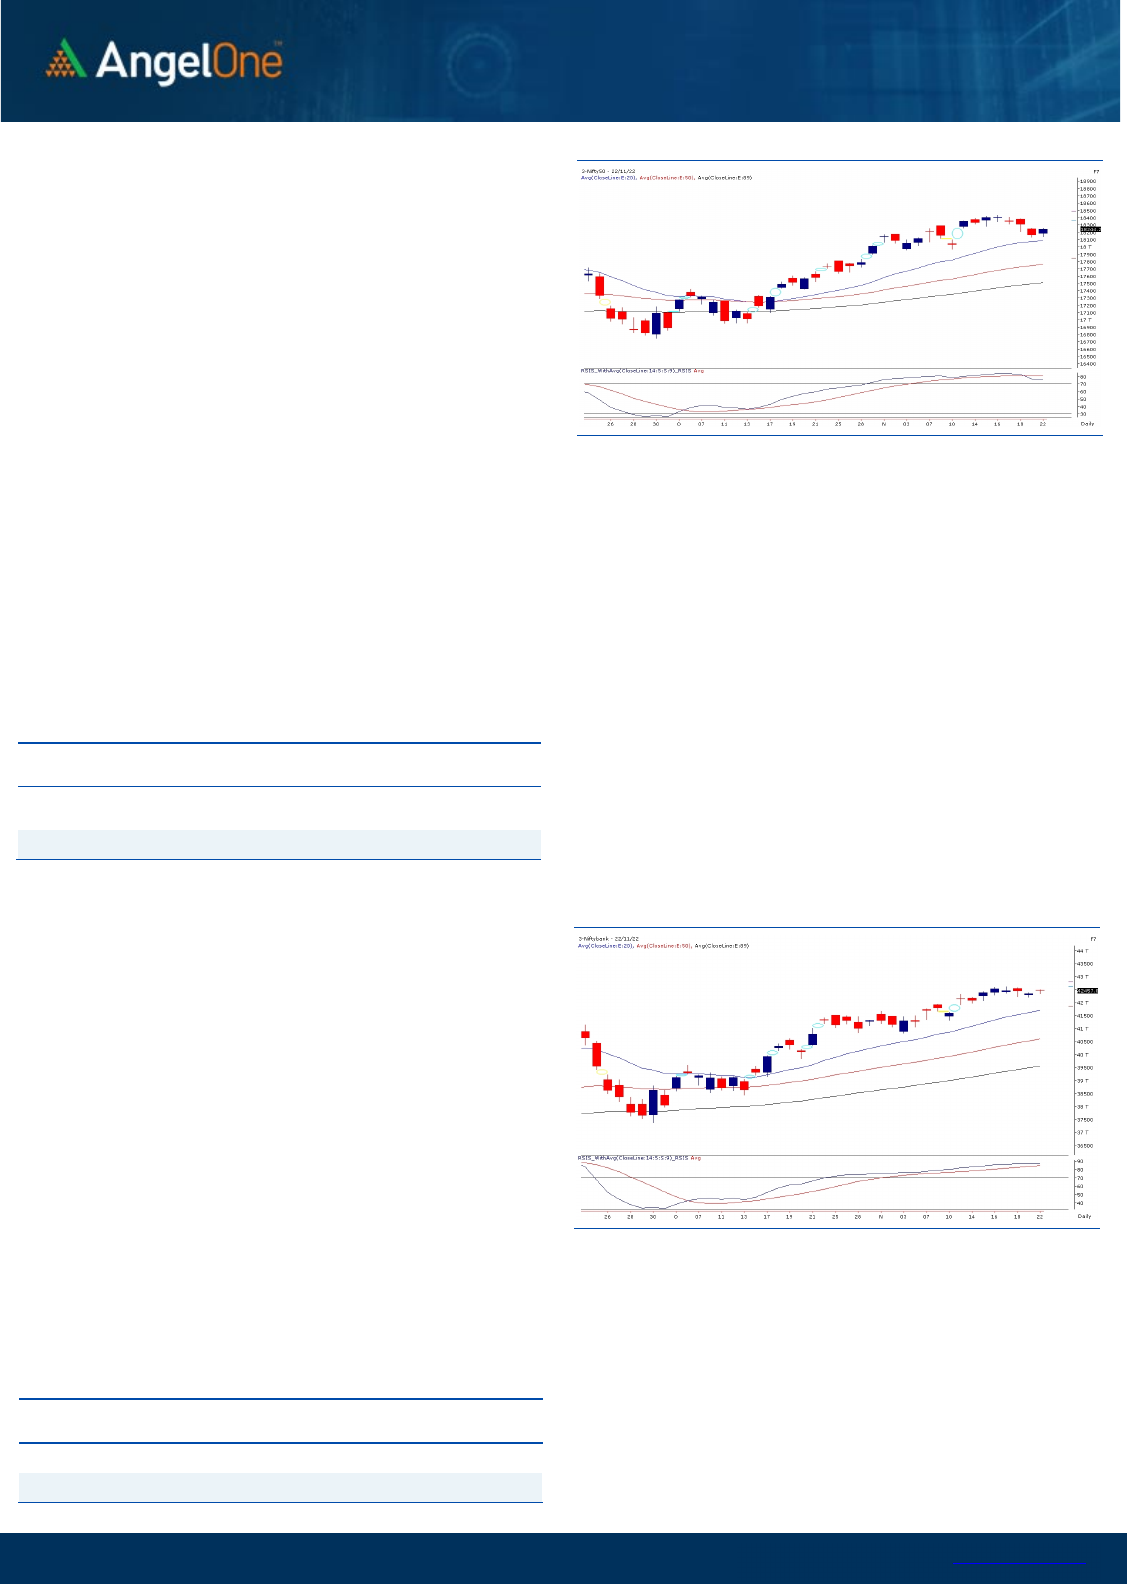
Sensex (61419) / Nifty (18244)
The mixed global market led to a mild start in Indian equities,
wherein the benchmark index started the session on a flat note.
Soon after, the bulls grabbed the opportunity and made a modest
recovery in the index, post which slender range-bound moves were
seen for the majority part of the day. Amidst the lackluster session,
the bulls showed their comeback in the last half hour and snapped
the losing momentum of the past three days. The Nifty concluded
near the day’s high, procuring nearly half a percent, and settled a
tad below the 18250 level.
Technically, there has been no substantial change in the market
outlook as the bulls firmly withheld their support zone and showed
their presence by the fag end. The undertone is expected to remain
upbeat till Nifty sustains above its sacrosanct demand zone of
18100-18000. Looking at the technical setup, until the index
surpasses its swing high of 18450 in a decisive manner, a range-
bound movement could be continued in the comparable period.
Simultaneously, some tentativeness could be sensed ahead of the
November month expiry, and participants are keeping a cautious
approach in the market.
Key Levels
Support 1 – 18100 Resistance 1 – 18350
Support 2 – 18000 Resistance 2 – 18450
Going forward, many stock-specific adjustments are likely to
continue and provide substantial trading opportunities.
And even though the indices may not be doing much, the
individual stocks are not at all short of action. Hence one should
continue to identify such potential movers and trade accordingly
and stay abreast with global and domestic developments on a
regular basis.
www.angelone.in
Technical & Derivatives Report
NOV 23, 2022
View
We had a slightly positive start for the day. Post some
initial hiccups index settled and consolidated for a
major part of the day. However, final hour surge led
closing tad above 18200.
FIIs were net sellers in the cash market segment to
the tune of Rs. 698 crores. Simultaneously, in Index
futures, they bought worth Rs. 1521 crores with a
decrease in open interest, indicating short covering.
Yesterday, we hardly saw any relevant open interest
change in Nifty, whereas BankNifty added decent
longs. In options front, we saw call writers of 18200-
18400 strikes running for shelter. On the flip side,
massive writing was observed in 18200, which would
act as a strong support zone now. Stronger hands
continue to curb liquidity but preferred covering
bearish bets in index and stock futures segment.
Considering the above development, we expect
continuation of yesterday’s up move going forward.
Hence, traders should continue trading with a positive
bias.
Comments
The Nifty futures open interest has decreased by
0.52%. and Bank Nifty futures open interest has
increased by 9.46% as the market closed at 18244.20.
The Nifty November future closed with a premium of
36.80 point against a premium of 32.35 point in the
last trading session. The December series closed at
a premium of 129.65 point.
The INDIA VIX decreased from 14.79 to 13.84. At the
same time, the PCR-OI of Nifty has increased from
0.79 to 0.99.
Few of the liquid counters where we have seen high
cost of carry are GNFC, IDEA, DELTACORP,
IBULHSGFIN and CUB.
Historical Volatility
SCRIP HV
MGL 40.27
SRTRANSFIN 48.43
HAL 42.75
BANKBARODA 49.97
GLENMARK 40.41
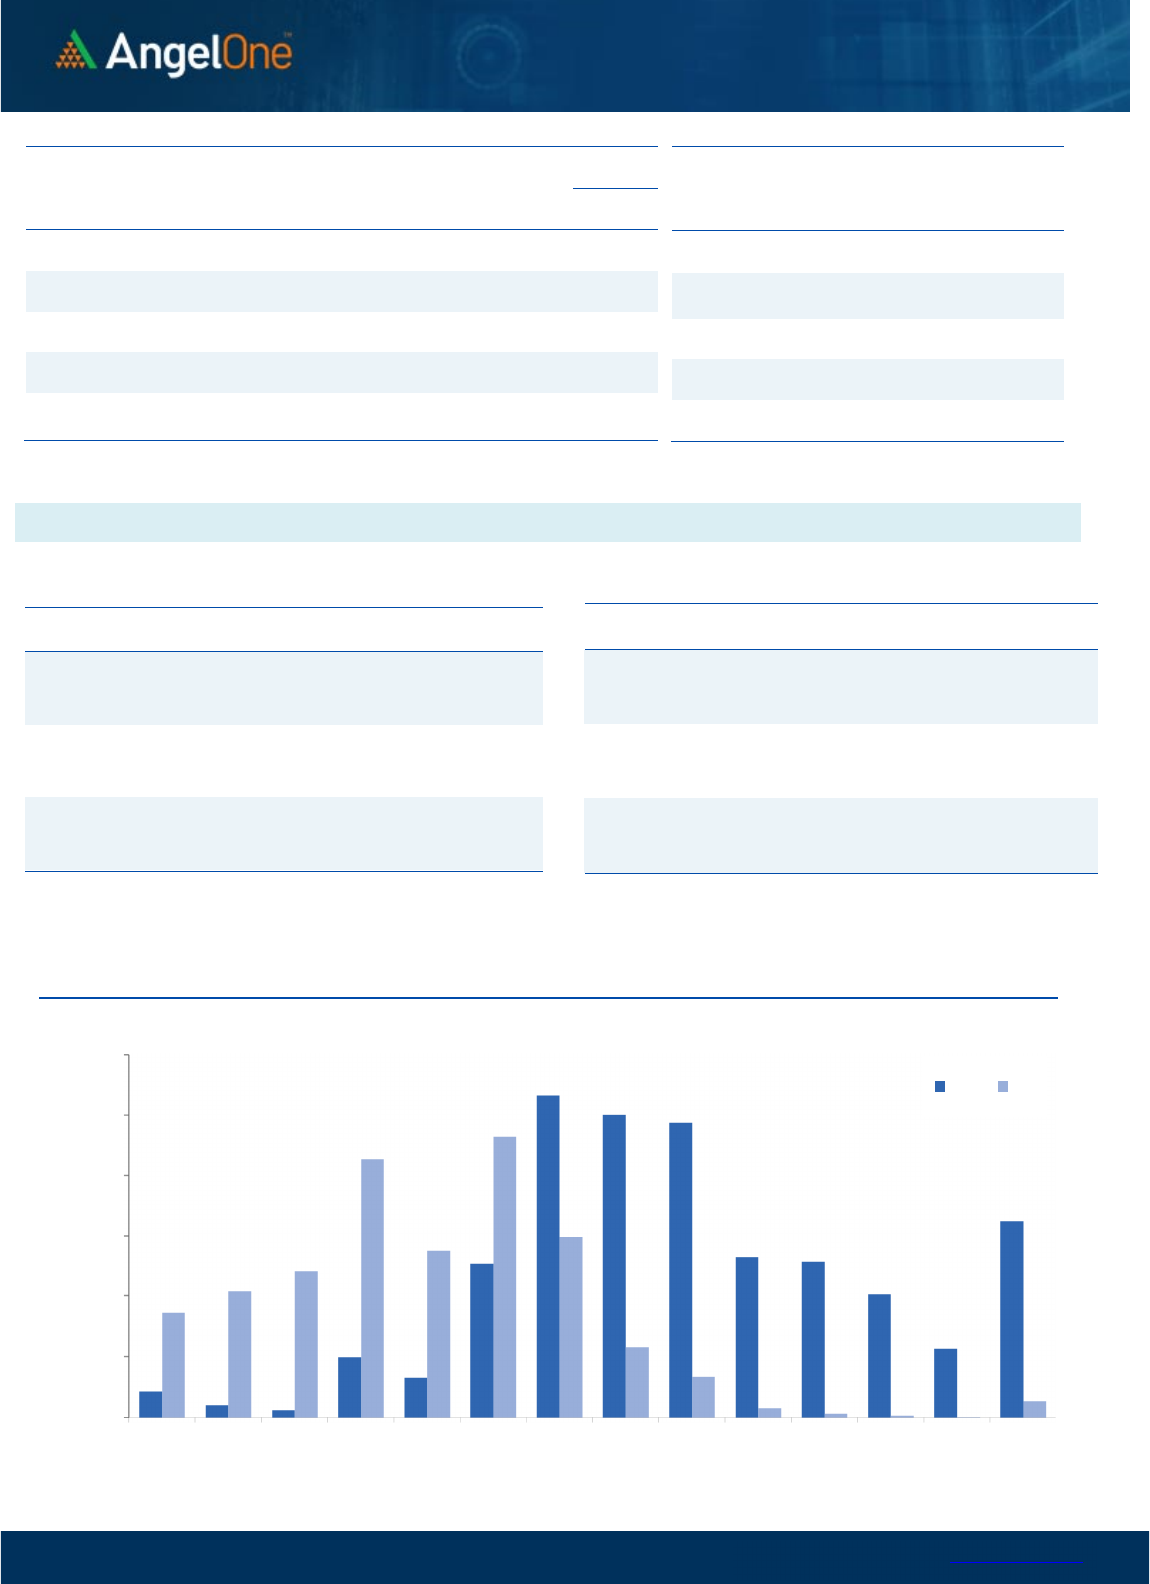
Nifty Vs OI
17600
17700
17800
17900
18000
18100
18200
18300
18400
18500
18600
8,000
9,000
10,000
11,000
12,000
13,000
14,000
15,000
16,000
11/2 11/4 11/8 11/10 11/15 11/17 11/22
Openinterest Nifty
OI Gainers
SCRIP OI
OI
CHG. (%)
PRICE
PRICE
CHG. (%)
MFSL 5521100 64.20 644.80 -1.27
LTI 1709550 17.96 4756.15 0.12
ALKEM 328800 13.15 3088.60 0.36
JKCEMENT 611250 12.41 2949.10 0.63
BANKBARODA 97858800 11.02 166.75 2.65
IRCTC 16919875 10.57 715.15 0.08
DELTACORP 18991900 8.46 224.25 0.90
HDFCAMC 1822800 8.31 2105.85 1.91
OI Losers
SCRIP OI
OI
CHG. (%)
PRICE
PRICE
CHG. (%)
GSPL 2370000 -43.27 238.15 1.15
ESCORTS 1536425 -20.41 2212.10 0.34
LALPATHLAB 1066500 -19.19 2433.75 0.59
MINDTREE 1549200 -16.97 3433.85 0.05
CUB 8375000 -12.21 184.45 0.35
GNFC 6340100 -11.23 591.95 2.50
UBL 942400 -10.69 1663.40 0.49
MRF 67880 -10.09 88952.55 -0.06
Put-Call Ratio
SCRIP PCR (OI) PCR (VOL)
NIFTY 0.99 0.95
BANKNIFTY 1.09 0.98
RELIANCE 0.55 0.55
ICICIBANK 0.55 0.46
INFY 0.66 0.54
www.angelone.in
Technical & Derivatives Report
NOV 23, 2022
Note: Above mentioned Bullish or Bearish Spreads in Nifty (Nov Series) are given as an information and not as a recommendation.
Nifty Spot =
1
8
159.95
FII Statistics for
November
2
2
, 2022
Detail Buy
Contracts
Open
Interest
Value
(in Cr.)
Sell
Net
CHANGE
INDEX
FUTURES
5571.41 4050.06 1521.35
164722 15750.39 (3.24)
INDEX
OPTIONS
575704.99 578291.22 (2586.23) 2072510 197479.40 1.71
STOCK
FUTURES
51694.08 50745.55 948.53
2118281 145156.17 (1.67)
STOCK
OPTIONS
9403.09 9584.06 (180.97) 145032 10326.04 (7.81)
Total 642373.57
642670.89
(297.32) 4500545
368712.00
(0.42)
Turnover on
November
2
2
, 2022
Instrument
No. of
Contracts
Turnover
( in Cr. )
Change
(%)
Index
Futures
274635 2657331.00
-0.77
Index
Options
112172952 2291901.00
-17.02
Stock
Futures
2120783 14652611.00
5.43
Stock
Options
3849946 247565.00 -1.07
Total
3,849,946 247565.00 1.33
Bull-Call Spreads
Action Strike Price Risk Reward BEP
Buy
18200 110.95
60.45
39.55
18260.45
Sell
18300 50.50
Buy
18200 110.95
93.90
106.10
18293.90
Sell
18400 17.05
Buy
18300 50.50
33.45 66.55 18333.45
Sell 18400 17.05
Bear
-
Put Spreads
Action Strike Price Risk Reward BEP
Buy 18200 34.50
18.95
81.05
18181.05
Sell
18100 15.55
Buy 18200 34.50
27.25
172.75
18172.75
Sell 18000 7.25
Buy
18100 15.55
8.30 91.70 18091.70
Sell 18000 7.25
Nifty Put
-
Call Analysis
,0
2000,000
4000,000
6000,000
8000,000
10000,000
12000,000
17700 17800 17900 18000 18100 18200 18300 18400 18500 18600 18700 18800 18900 19000
Call Put

www.angelone.in
Technical & Derivatives Report
NOV 23, 2022
`
Daily Pivot Levels for Nifty Constituents
Scrips
S2
S1
PIVOT
R1 R2
ADANIENT 3,958 3,996
4,026 4,064
4,094
ADANIPORTS
864
873
880
889
895
APOLLOHOSP 4,343 4,407
4,443
4,507
4,543
ASIANPAINT
3,051
3,078
3,099 3,125
3,146
AXISBANK
863
867
872
875
880
BAJAJ-AUTO 3,558 3,588
3,616
3,646 3,674
BAJFINANCE 6,624 6,654
6,691
6,722
6,758
BAJAJFINSV 1,617 1,630
1,645
1,658
1,673
BPCL
302
305
308
310 314
BHARTIARTL
836
842
851 857
867
BRITANNIA 4,087 4,122
4,143
4,179
4,200
CIPLA 1,091 1,098
1,104
1,110
1,116
COALINDIA 226 228
229
231
232
DIVISLAB 3,206 3,256
3,295
3,345
3,385
DRREDDY 4,287 4,325
4,364
4,401
4,440
EICHERMOT 3,325 3,350
3,379
3,404 3,433
GRASIM
1,665
1,682
1,700
1,717
1,734
HCLTECH 1,081 1,092
1,099
1,110
1,117
HDFCBANK
1,583
1,589
1,597
1,603
1,610
HDFCLIFE
529
535
538
543
546
HDFC
2,596
2,611
2,623
2,637
2,650
HEROMOTOCO
2,657
2,671
2,681
2,695
2,705
HINDALCO
425
428
432
435
439
HINDUNILVR 2,485 2,500
2,512
2,527
2,539
ICICIBANK
917
921
924
927
930
INDUSINDBK 1,126 1,148
1,160 1,182
1,195
INFY
1,552
1,569
1,578
1,595
1,604
ITC
334
337
339
342
344
JSW STEEL
684
696
703
715
722
KOTAKBANK 1,917 1,929
1,941
1,952
1,965
LT
2,014
2,022
2,028 2,035
2,041
M&M
1,207
1,218
1,227
1,237
1,246
MARUTI
8,813
8,844
8,889
8,919 8,965
NESTLEIND
19,372
19,493
19,671
19,792
19,970
NTPC 164 165
166
168
169
ONGC
132
133
135
136
138
POWERGRID
216
217
218
219
220
RELIANCE 2,525 2,545
2,557
2,577
2,589
SBILIFE 1,212 1,220
1,228
1,237
1,245
SBIN
594
597
599
601
603
SUNPHARMA
990
1,000
1,006
1,016
1,022
TCS
3,233
3,274
3,296
3,338 3,360
TATACONSUM
761
766
771
777
782
TATAMOTORS 418 421
424
427
430
TATASTEEL 103 104
105
106
107
TECHM
1,030
1,040
1,047
1,057
1,063
TITAN 2,544 2,575
2,592
2,623
2,640
ULTRACEMCO
6,657
6,750
6,834
6,927
7,010
UPL 752 761
765
773
778
WIPRO
383
386
388
391
392

www.angelone.in
Technical & Derivatives Report
NOV 23, 2022
*
Technical and Derivatives Team:
Sameet Chavan Chief Analyst – Technical & Derivatives sameet.chavan@angelone.in
Sneha Seth Senior Analyst – Technical & Derivatives sneha.seth@angelone.in
Rajesh Bhosale Technical Analyst rajesh.bhosle@angelone.in
Osho Krishan Senior Analyst – Technical & Derivatives osho.krishan@angelone.in
Research Team Tel: 022 – 39357600 Website: www.angelone.in
For Technical Queries E-mail: technicalresearch-cso@angelone.in
For Derivatives Queries E-mail: derivatives.desk@angelone.in
DISCLAIMER
Angel One Limited (hereinafter referred to as “Angel”) is a registered Member of National Stock Exchange of India Limited, Bombay
Stock Exchange Limited and Metropolitan Stock Exchange Limited. It is also registered as a Depository Participant with CDSL and
Portfolio Manager and investment advisor with SEBI. It also has registration with AMFI as a Mutual Fund Distributor. Angel One
Limited is a registered entity with SEBI for Research Analyst in terms of SEBI (Research Analyst) Regulations, 2014 vide registration
number INH000000164. Angel or its associates has not been debarred/ suspended by SEBI or any other regulatory authority for
accessing /dealing in securities Market.
This document is solely for the personal information of the recipient, and must not be singularly used as the basis of any investment
decision. Nothing in this document should be construed as investment or financial advice. Each recipient of this document should
make such investigations as they deem necessary to arrive at an independent evaluation of an investment in the securities of the
companies referred to in this document (including the merits and risks involved), and should consult their own advisors to determine
the merits and risks of such an investment.
Angel or its associates or research analyst or his relative may have actual/beneficial ownership of 1% or more in the securities of
the subject company at the end of the month immediately preceding the date of publication of the research report. Neither Angel or
its associates nor Research Analysts or his relative has any material conflict of interest at the time of publication of research report.
Angel or its associates might have received any compensation from the companies mentioned in the report during the period
preceding twelve months from the date of this report for services in respect of managing or co-managing public offerings, corporate
finance, investment banking or merchant banking, brokerage services or other advisory service in a merger or specific transaction
in the normal course of business. Angel or its associates did not receive any compensation or other benefits from the companies
mentioned in the report or third party in connection with the research report. Neither Angel nor its research analyst entity has been
engaged in market making activity for the subject company.
Reports based on technical and derivative analysis center on studying charts of a stock's price movement, outstanding positions and
trading volume, as opposed to focusing on a company's fundamentals and, as such, may not match with a report on a company's
fundamentals. Investors are advised to refer the Fundamental and Technical Research Reports available on our website to evaluate
the contrary view, if any.
The information in this document has been printed on the basis of publicly available information, internal data and other reliable
sources believed to be true, but we do not represent that it is accurate or complete and it should not be relied on as such, as this
document is for general guidance only. Angel One Limited or any of its affiliates/ group companies shall not be in any way responsible
for any loss or damage that may arise to any person from any inadvertent error in the information contained in this report. Angel One
Limited has not independently verified all the information contained within this document. Accordingly, we cannot testify, nor make
any representation or warranty, express or implied, to the accuracy, contents or data contained within this document. While Angel
One Limited endeavors to update on a reasonable basis the information discussed in this material, there may be regulatory,
compliance, or other reasons that prevent us from doing so.
This document is being supplied to you solely for your information, and its contents, information or data may not be reproduced,
redistributed or passed on, directly or indirectly.
Neither Angel One Limited, nor its directors, employees or affiliates shall be liable for any loss or damage that may arise from or in
connection with the use of this information. Angel or its associates or Research Analyst or his relative might have financial interest
in the subject company. Research analyst has not served as an officer, director or employee of the subject company.
