October
2
3
, 2023
www.angelone.in
Technical & Derivatives Report
8
Nifty Bank Outlook (
4
3
7
23
)
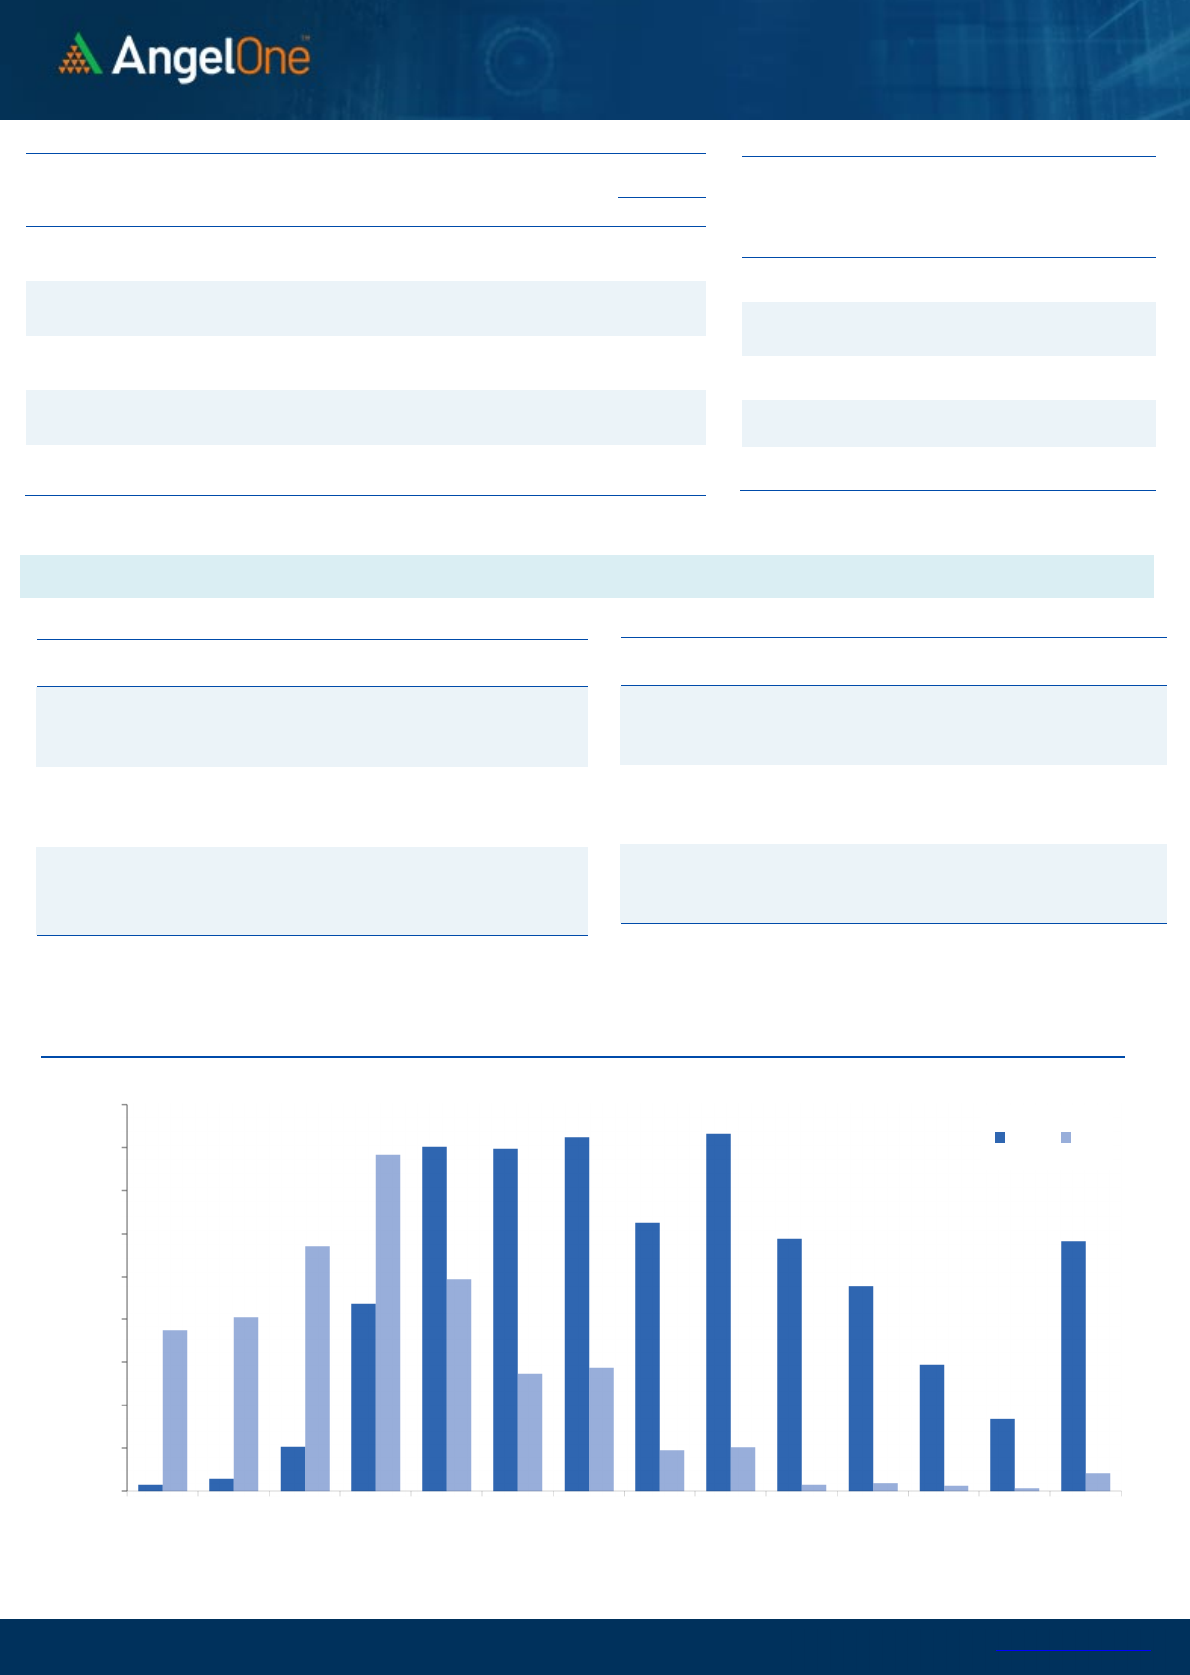
The high beta index continued to underperform, marking its fifth
consecutive week of losses. The Bank Nifty concluded the week with a
1.28% cut compared to the previous week's closing, ending a tad
above the 43700 mark.
The Bank Nifty has been a major contributor to the broader market's
weakness and has now reached a significant support level of around
43600, which has been a key point for the last several months. By
closely examining the weekly chart since the end of June, it becomes
apparent that prices have been trading within a broad range, with
43600 as the lower boundary and 46300 as the upper boundary,
forming what can be described as a Rectangular Channel pattern. The
charts have already shown signs of distortion, and a breach below the
lower limit could lead to a more substantial downward price
correction in the near future. In such a scenario, it is possible that the
long-term 200SMA in the range of 43200 to 43000 may come into play
as a support level.
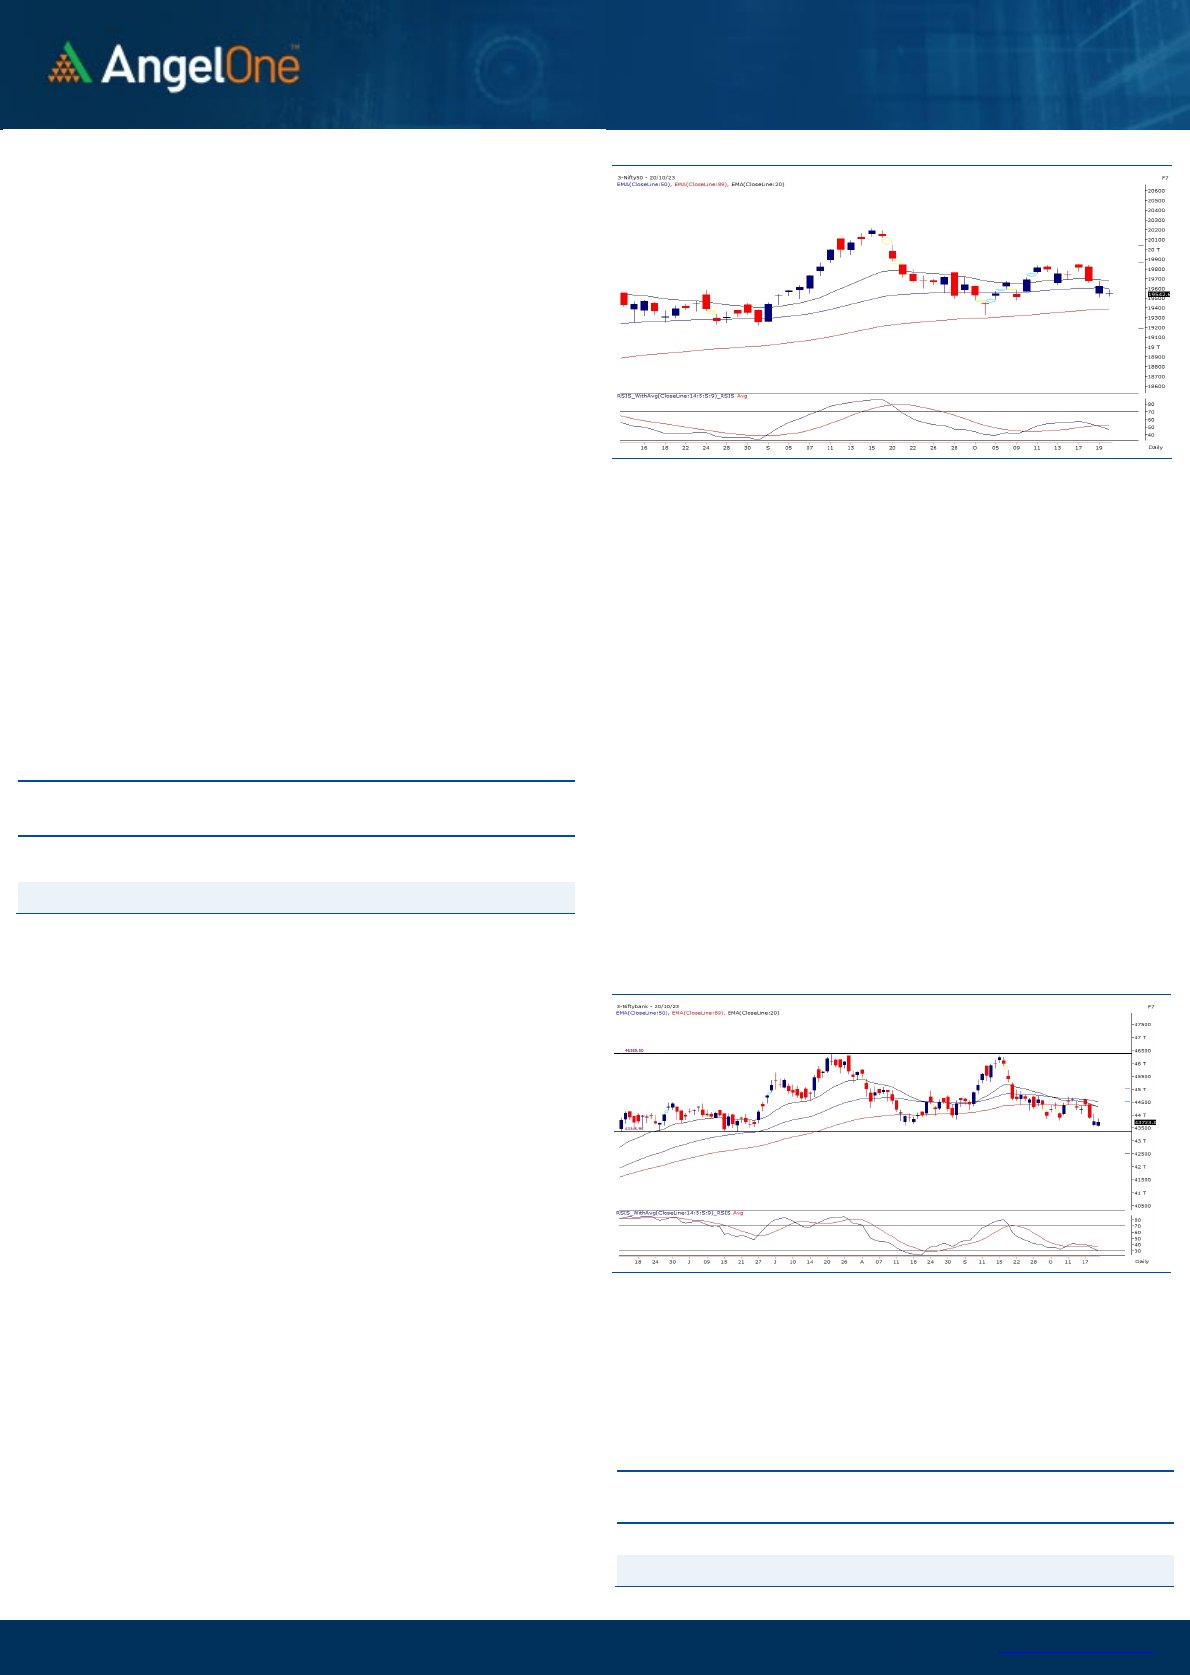
Exhibit 1: Nifty Daily Chart
Exhibit 2: Nifty Bank Daily Chart
Sensex (
6
5
398
) / Nifty (
19
543
)
During the last week, the Indian equity market started on a cautious
note, wherein the benchmark index initially showed some resilience to
the global uncertainties and tried making a move on the higher front.
But by the latter half of the week, it succumbed to the global pressure
and slipped towards the pivotal support zone. Eventually, Nifty took a
breather after two consecutive weeks of recovery and managed to
withhold the crucial zone 19500, with a cut of over a percent in the
week.
Technically, the Nifty50 index was restrained from the bearish gap on
the daily chart and reverted towards the pivotal level amidst the
unfavourable global scenario. Fortunately, there has not been a
significant plunge in our indices, rather just a retraction into the
consolidation zone. As far as levels are concerned, the bullish gap of
19490-19450 withholds immediate support, followed by 19400, while
any breakdown could disrupt the ongoing view, and the recent swing
low of 19333 would become very much in the vicinity. On the higher
end, 19700-19750 is expected to act as an immediate hurdle, followed
by the formidable resistance of 19850-19880 (Bearish Gap) and an
authoritative breakthrough could only re-strengthen the lost
momentum to the bulls of D-Street.
Key Levels
Support 1 – 19450 Resistance 1 – 19700
Support 2 – 19400 Resistance 2 – 19750
Going ahead, we would likely remain cautious amidst the ongoing
geopolitical scenario, which may be deceptive and could trap the
traders on either side. Hence, one needs to follow the
aforementioned levels thoroughly and in the meantime, stay abreast
with the geopolitical developments. Also, it is advisable to avoid
aggressive overnight bets as an intense bout of profit
booking/correction is evident in the Midcap space as indicated by
the negative crossover of the 'RSI-Smoothened in weekly time frame
chart. This condition is very rare as the negative development in this
oscillator is visible in the extreme overbought territory, coupled with
a breakdown in prices during Friday's session.
Conversely, if there is a rebound, prices are likely to encounter
resistance at higher levels. In this case, 44000 followed by 44350 is
expected to act as immediate resistance points. Given the prevailing
global uncertainties and the likelihood of increased volatility during
the truncated expiry week, traders are advised to exercise caution
and closely monitor the above-mentioned levels.
Key Levels
Support 1 – 43500 Resistance 1 – 44000
Support 2 – 43200 Resistance 2 – 44350

www.angelone.in
Technical & Derivatives Report
October
2
3
,
2023
View
The market witnessed a volatile week, initially index
rebounded towards 19850 mark. However, we
witnessed smart selling on Wednesday and follow-
up selling was extended till the last day to test 19550.
Eventually, with no sign of recovery, the index
concluded the week tad above 19500.
FIIs were net buyers in the cash market segment to
the tune of Rs. 456.21 cr. Simultaneously, they sold
worth Rs. 636 cr in Index futures with a decline in
open interest, indicating long unwinding on Friday.
On the derivatives front, we observed decent
unwinding in key indices on a WoW basis. FIIs
remained net sellers in equities on net basis and
added bearish bets in index futures segments. Hence
their LSR decreased slightly to 26% from 27% seen
during the start of the week. For the coming monthly
series, call writers reminded activity in 19600-19700
strikes, while no relevant activity was observed on
the put side. Highest open interest concentration is
now visible in 19600 call and 19500 put strikes. For
now, we would advocate avoiding any aggressive
directional bets in index and trade in individual space
but being selective.
Comments
The Nifty futures open interest has increased by 2.65%
and Bank Nifty futures open interest has decreased by
7.13% as the market closed at 19542.65.
The Nifty October future closed with a discount of
14.80 points against a discount of 5.95 points in the last
trading session. The November series closed at a
premium of 111.50 points.
The INDIA VIX has decreased from 10.90 to 10.82. At
the same time, the PCR-OI of Nifty has decreased from
0.93 to 0.90.
A few of the liquid counters where we have seen high
cost of carry are DELTACORP, IDEA, INDIACEM,
ABCAPITAL and PVRINOX.
Historical Volatility
SCRIP HV
IGL 38.23
MGL 37.32
HAVELLS 30.50
ITC 23.75
MPHASIS 37.78
Nifty Vs OI
18800
19000
19200
19400
19600
19800
20000
20200
20400
20600
9,000
9,500
10,000
10,500
11,000
11,500
12,000
12,500
13,000
13,500
14,000
10-3 10-6 10-10 10-13 10-17 10-20
Openinterest Nifty
OI Gainers
SCRIP OI
OI
CHG. (%)
PRICE
PRICE
CHG. (%)
MGL 3469600 43.75 1030.05 -8.14
IGL 19009375 35.63 403.20 -11.94
SBILIFE 7047000 13.97 1362.65 0.97
METROPOLIS 2196400 13.61 1506.85 0.30
LALPATHLAB 1324200 11.41 2511.60 0.29
CROMPTON 13563000 10.31 285.60 -3.63
DIXON 1590800 10.26 5520.75 0.24
DABUR 21525000 10.23 524.80 -0.16
OI Losers
SCRIP OI
OI
CHG. (%)
PRICE
PRICE
CHG. (%)
LTIM 17600 -13.52 5416.20 -0.64
MCX 2171600 -12.90 2320.10 4.10
MUTHOOTFIN 6459750 -8.98 1271.65 2.08
GUJGASLTD 12508750 -8.54 413.20 -1.61
ATUL 558975 -8.39 6676.60 -1.58
KOTAKBANK 28796800 -7.86 1769.60 1.54
BERGEPAINT 12553200 -7.54 584.25 1.74
ULTRACEMCO 1609200 -6.27 8461.00 -0.95
Put-Call Ratio
SCRIP PCR (OI) PCR (VOL)
NIFTY 0.90 0.87
BANKNIFTY 0.73 0.90
RELIANCE 0.53 0.39
ICICIBANK 0.48 0.45
INFY 0.41 0.41
www.angelone.in
Technical & Derivatives Report
October
2
3
,
2023
Note: Above mentioned Bullish or Bearish Spreads in Nifty (Oct Series) are given as an information and not as a recommendation.
Nifty Spot =
19
542.65
FII Statistics for
October
20
, 2023
Detail Buy
Contracts
OI Value
(in Cr.)
Sell Net CHANGE
INDEX
FUTURES
3407.96 4044.34 (636.38) 185792 15019.47 (4.13)
INDEX
OPTIONS
723746.12 715559.70 8186.42
3728228 302488.75 24.67
STOCK
FUTURES
49879.82 50691.52 (811.70) 2429455 189557.29 (0.25)
STOCK
OPTIONS
30913.63 30880.41 33.22
244787 19836.85 0.41
Total
807947.53
801175.97
6771.56
6588262
526902.36
12.36
Turnover on
October
20
, 2023
Instrument
No. of
Contracts
Turnover
(in Cr.)
Change
(%)
Index Futures
319316 25710.04
61.31
Index Options
438774286
53412.86
42.12
Stock Futures
1218384 100029.83
61.77
Stock Options
5426749 4111.32 1.79
Total
54,26,749 4111.32 53.49
Bull-Call Spreads
Action Strike Price Risk Reward BEP
Buy
19600
63.35 30.50
69.50
19630.50
Sell
19700
32.85
Buy
19600 63.35 47.80
152.20
19647.80
Sell
19800 15.55
Buy
19700
32.85 17.30 82.70 19717.30
Sell
19800 15.55
Bear-Put Spreads
Action Strike Price Risk Reward BEP
Buy
19500 82.35
35.50
64.50
19464.50
Sell 19400 46.85
Buy 19500 82.35
56.35
143.65
19443.65
Sell
19300 26.00
Buy
19400 46.85
20.85 79.15 19379.15
Sell 19300 26.00
Nifty Put
-
Call Analysis
,0
1000,000
2000,000
3000,000
4000,000
5000,000
6000,000
7000,000
8000,000
9000,000
19200 19300 19400 19500 19600 19700 19800 19900 20000 20100 20200 20300 20400 20500
Call Put

www.angelone.in
Technical & Derivatives Report
October
2
3
,
2023
`
Daily Pivot Levels for Nifty Constituents
Scrips S2 S1 PIVOT R1 R2
ADANIENT 2,345 2,369 2,407 2,431 2,468
ADANIPORTS 781 787 795 802 809
APOLLOHOSP 4,913 4,945 4,973 5,005 5,032
ASIANPAINT 3,045 3,075 3,095 3,126 3,146
AXISBANK 969 974 984 990 999
BAJAJ-AUTO 5,406 5,447 5,479 5,521 5,552
BAJFINANCE 7,665 7,717 7,775 7,827 7,885
BAJAJFINSV 1,605 1,620 1,630 1,645 1,655
BPCL 340 343 348 351 356
BHARTIARTL 933 939 943 949 954
BRITANNIA 4,533 4,557 4,582 4,606 4,632
CIPLA 1,183 1,192 1,207 1,215 1,230
COALINDIA 306 309 313 316 320
DIVISLAB 3,474 3,514 3,574 3,614 3,675
DRREDDY 5,511 5,540 5,580 5,609 5,649
EICHERMOT 3,448 3,464 3,482 3,499 3,517
GRASIM 1,916 1,931 1,954 1,969 1,992
HCLTECH 1,239 1,249 1,255 1,265 1,271
HDFCBANK 1,496 1,510 1,518 1,532 1,540
HDFCLIFE 625 633 637 645 649
HEROMOTOCO 3,165 3,188 3,227 3,250 3,288
HINDALCO 464 468 474 478 484
HINDUNILVR 2,449 2,472 2,508 2,531 2,566
ICICIBANK 924 929 934 939 944
INDUSINDBK 1,433 1,451 1,461 1,480 1,490
INFY 1,417 1,422 1,430 1,435 1,444
ITC 430 434 442 446 453
JSW STEEL 753 761 770 779 788
KOTAKBANK 1,718 1,744 1,758 1,784 1,799
LT 2,936 2,974 3,015 3,053 3,094
LTIMINDTREE 5,317 5,367 5,440 5,489 5,563
M&M 1,530 1,544 1,559 1,574 1,589
MARUTI 10,637 10,681 10,740 10,785 10,843
NESTLEIND 23,599 23,939 24,342 24,683 25,085
NTPC 236 238 240 243 245
ONGC 184 185 186 187 188
POWERGRID 199 201 203 205 207
RELIANCE 2,285 2,292 2,303 2,310 2,322
SBILIFE 1,324 1,343 1,356 1,375 1,388
SBIN 557 560 565 568 573
SUNPHARMA 1,128 1,135 1,140 1,147 1,152
TCS 3,424 3,459 3,479 3,515 3,535
TATACONSUM
883 891 896 904 910
TATAMOTORS 651 657 667 673 683
TATASTEEL 121 122 124 125 127
TECHM 1,137 1,154 1,165 1,182 1,193
TITAN 3,220 3,243 3,267 3,290 3,315
ULTRACEMCO 8,269 8,365 8,507 8,603 8,744
UPL 595 599 606 610 617
WIPRO 388 390 393 395 398

www.angelone.in
Technical & Derivatives Report
October
2
3
,
2023
Technical and Derivatives Team:
Sameet Chavan Head Research – Technical & Derivatives sameet.chavan@angelone.in
Sneha Seth Senior Analyst – Technical & Derivatives sneha.seth@angelone.in
Rajesh Bhosale Analyst - Technical rajesh.bhosle@angelone.in
Osho Krishan Senior Analyst – Technical & Derivatives osho.krishan@angelone.in
Hitesh Rathi Analyst – Technical & Derivatives hitesh.rathi@angelone.in
Research Team Tel: 022 – 39357600 Website: www.angelone.in
For Technical Queries E-mail: technicalresearch-cso@angelone.in
For Derivatives Queries E-mail: derivatives.desk@angelone.in
DISCLAIMER
We, Angel One Limited (hereinafter referred to as “Angel”) a company duly incorporated under the provisions of the Companies Act, 1956 with
its registered office at 601, 6th Floor, Ackruti Star, Central Road, MIDC, Andheri East, Mumbai – 400093, CIN: (L67120MH1996PLC101709) and
duly registered as a member of National Stock Exchange of India Limited, Bombay Stock Exchange Limited, Metropolitan Stock Exchange Limited,
Multi Commodity Exchange of India Ltd and National Commodity & Derivatives Exchange Ltd. Angel One limited is a company engaged in
diversified financial services business including securities broking, DP services, distribution of Mutual Fund products. It is also registered as a
Depository Participant with CDSL and Portfolio Manager and Investment Adviser with SEBI. It also has registration with AMFI as a Mutual Fund
Distributor. Angel One Limited is a registered entity with SEBI for Research Analyst in terms of SEBI (Research Analyst) Regulations, 2014 vide
registration number INH000000164 and also registered with PFRDA as PoP ,Registration No.19092018. Angel Group does not have any joint
ventures or associates. Angel One Limited is the ultimate parent company of the Group. Angel or its associates has not been debarred/ suspended
by SEBI or any other regulatory authority for accessing /dealing in securities Market.
AOL was merged with Angel Global Capital Private Limited and subsequently name of Angel Global Capital Private Limited was changed to Angel
Broking Private Limited (AOL) pursuant to scheme of Amalgamation sanctioned by the Hon'ble High Court of Judicature at Bombay by Orders
passed in Company Petition No 710 of 2011 and the approval granted by the Registrar of Companies. Further, name of Angel Broking Private
Limited again got changed to Angel Broking Limited (AOL) pursuant to fresh certificate of incorporation issued by Registrar of Companies (ROC)
dated June 28, 2018. Further name of Angel Broking name changed to Angel One Ltd pursuant to fresh certificate of incorporation issued by
Registrar of Companies (ROC) dated 23-09-21.
In case of any grievances please write to: support@angelone.in, Compliance Officer Details: Name : Hiren Thakkar, Tel No. –08657864228, Email
id - compliance@angelone.in
Registration granted by SEBI and certification from NISM in no way guarantee performance of the intermediary or provide any assurance of returns
to investors.
This document is solely for the personal information of the recipient, and must not be singularly used as the basis of any investment decision.
Nothing in this document should be construed as investment or financial advice. Each recipient of this document should make such investigations
as they deem necessary to arrive at an independent evaluation of an investment in the securities of the companies referred to in this document
(including the merits and risks involved), and should consult their own advisors to determine the merits and risks of such an investment.
Angel or its associates or research analyst or his relative may have actual/beneficial ownership of 1% or more in the securities of the subject
company at the end of the month immediately preceding the date of publication of the research report. Neither Angel or its associates nor
Research Analysts or his relative has any material conflict of interest at the time of publication of research report.
Angel or its associates might have received any compensation from the companies mentioned in the report during the period preceding twelve
months from the date of this report for services in respect of managing or co-managing public offerings, corporate finance, investment banking or
merchant banking, brokerage services or other advisory service in a merger or specific transaction in the normal course of business. Angel or its
associates did not receive any compensation or other benefits from the companies mentioned in the report or third party in connection with the
research report. Neither research entity nor research analyst has been engaged in market making activity for the subject company.

www.angelone.in
Technical & Derivatives Report
October
2
3
,
2023
*
Reports based on technical and derivative analysis center on studying charts of a stock's price movement, outstanding positions and trading
volume, as opposed to focusing on a company's fundamentals and, as such, may not match with a report on a company's fundamentals. Investors
are advised to refer the Fundamental and Technical Research Reports available on our website to evaluate the contrary view, if any.
The information in this document has been printed on the basis of publicly available information, internal data and other reliable sources believed
to be true, but we do not represent that it is accurate or complete and it should not be relied on as such, as this document is for general guidance
only. Angel One Limited or any of its affiliates/ group companies shall not be in any way responsible for any loss or damage that may arise to any
person from any inadvertent error in the information contained in this report. Angel One Limited does not warrant the accuracy, adequacy or
completeness of the service, information and materials and expressly disclaims liability for errors or omissions in the service, information and
materials. While Angel One Limited endeavours to update on a reasonable basis the information discussed in this material, there may be
regulatory, compliance, or other reasons that prevent us from doing so.
This document is being supplied to you solely for your information, and its contents, information or data may not be reproduced, redistributed or
passed on, directly or indirectly.
Neither Angel One Limited, nor its directors, employees or affiliates shall be liable for any loss or damage that may arise from or in connection
with the use of this information. Angel or its associates or Research Analyst or his relative might have financial interest in the subject company.
Research analyst has not served as an officer, director or employee of the subject company.
Investment in securities market are subject to market risks. Read all the related documents carefully before investing.
Any communication sent to clients on phone numbers or e-mail ids registered with the Trading Member is meant for client consumption and such
material should not be redistributed. Brokerage will not exceed SEBI prescribed limit. Any Information provided by us through any medium based
on our research or that of our affiliates or third parties or other external sources is subject to domestic and international market conditions and
we do not guarantee the availability or otherwise of any securities or other instruments and such Information is merely an estimation of certain
investments, and we have not and shall not be deemed to have assumed any responsibility for any such Information. You should seek independent
professional advice and/or tax advice regarding the suitability of any investment decision whether based on any Information provided by us
through the Site from inhouse research or third party reports or otherwise.
The report and information contained herein is strictly confidential and meant solely for the selected recipient and may not be altered in any way,
transmitted to, copied or distributed, in part or in whole, to any other person or to the media or reproduced in any form, without prior written
consent.
