FEB 23, 2023
www.angelone.in
Technical & Derivatives Report
Nifty Bank
Outlook (
39996
)
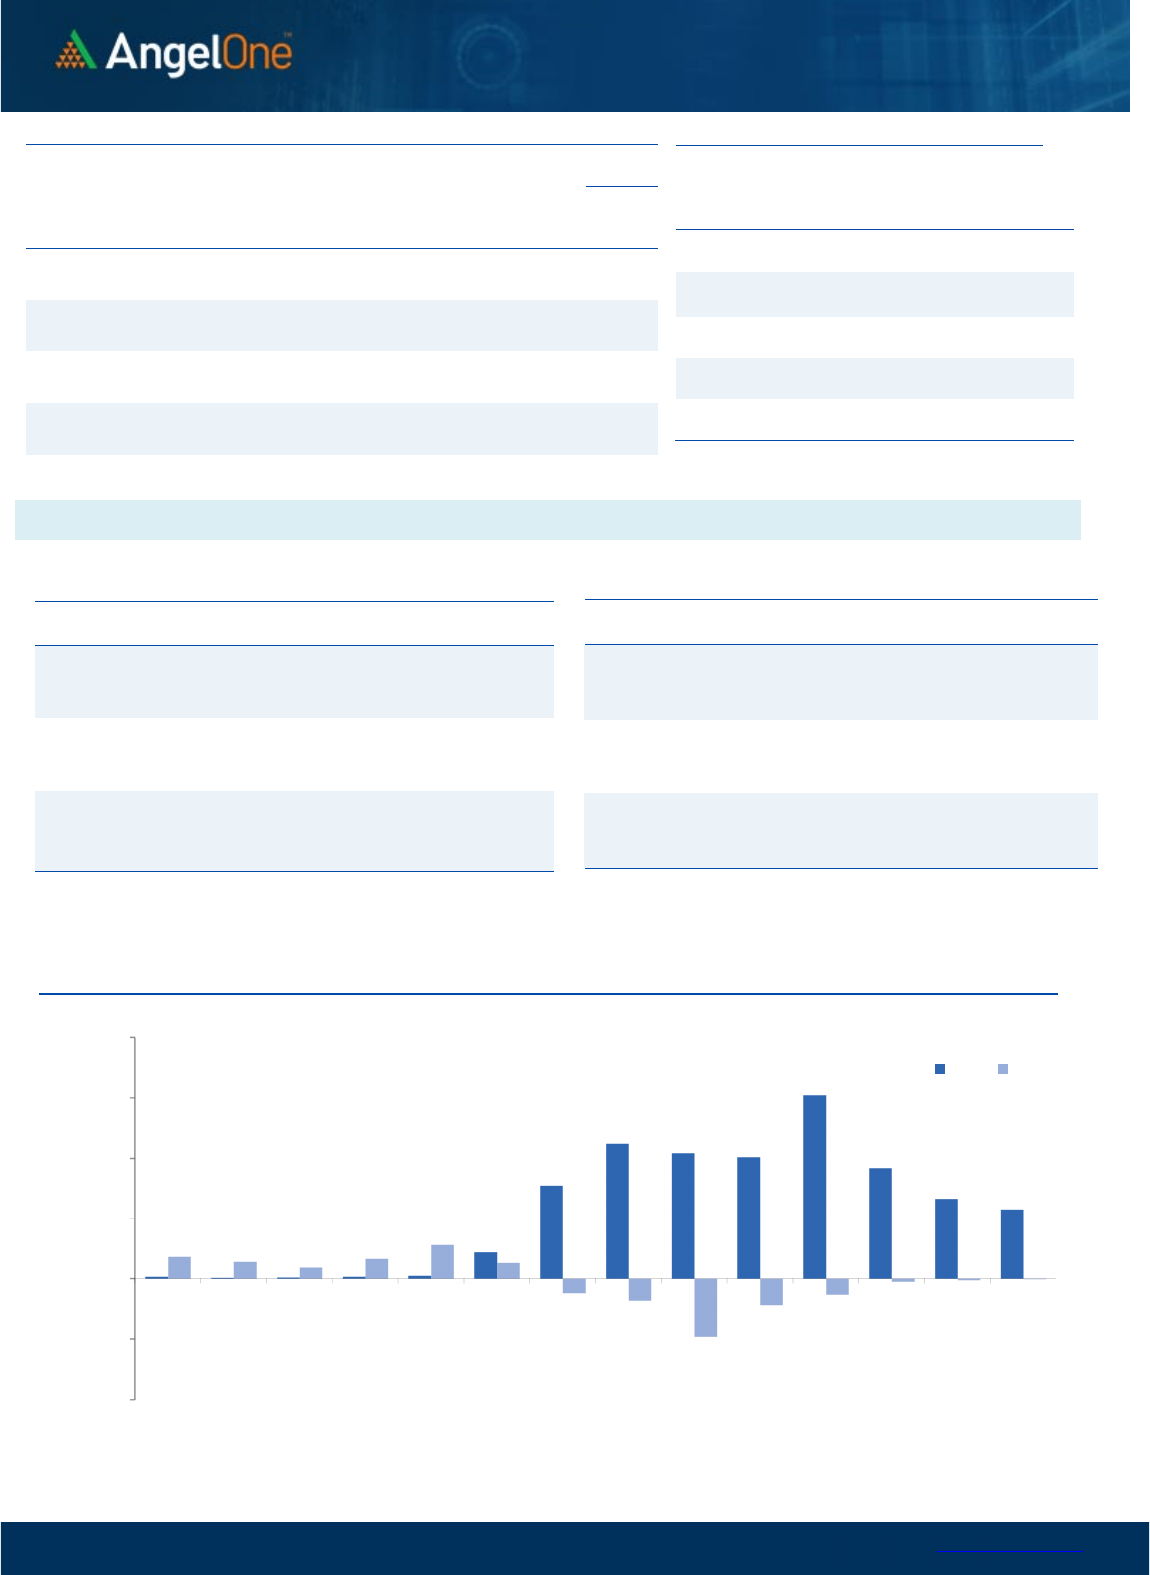
The pain finally aggravated yesterday as we witnessed a gap down
followed by continuous sell off across the broader market. With no
major recovery, the BANKNIFTY ended the session below the
40000 mark with a cut of 1.67%.
The banking has been the real culprit in last few sessions. The
weakness in the sector has brought entire market under the
hammer. Technically, prices have now reached the crucial trend
line support of 40000-39800. On the flipside, 40200-40500 are to
be seen immediate hurdles. In our sense, market is extremely
oversold and hence we may see one attempt to give a sharp
recovery.
Key Levels
Support 1 – 40000 Resistance 1 – 40200
Support 2 – 39800 Resistance 2 – 40500
Exhibit 1: Nifty Daily Chart
Exhibit 2: Nifty Bank Daily Chart
Sensex (
59745
) / Nifty (
1
7
554
)
The US bourses were under tremendous pressure overnight and
taking cues from there our markets started with a big gap down
opening. As the day progressed, we witnessed broad-based
weakness, and the sell-off extended without any meaningful
intraday bounce. Nifty eventually ended with a cut of 1.53% tad
above 17550.
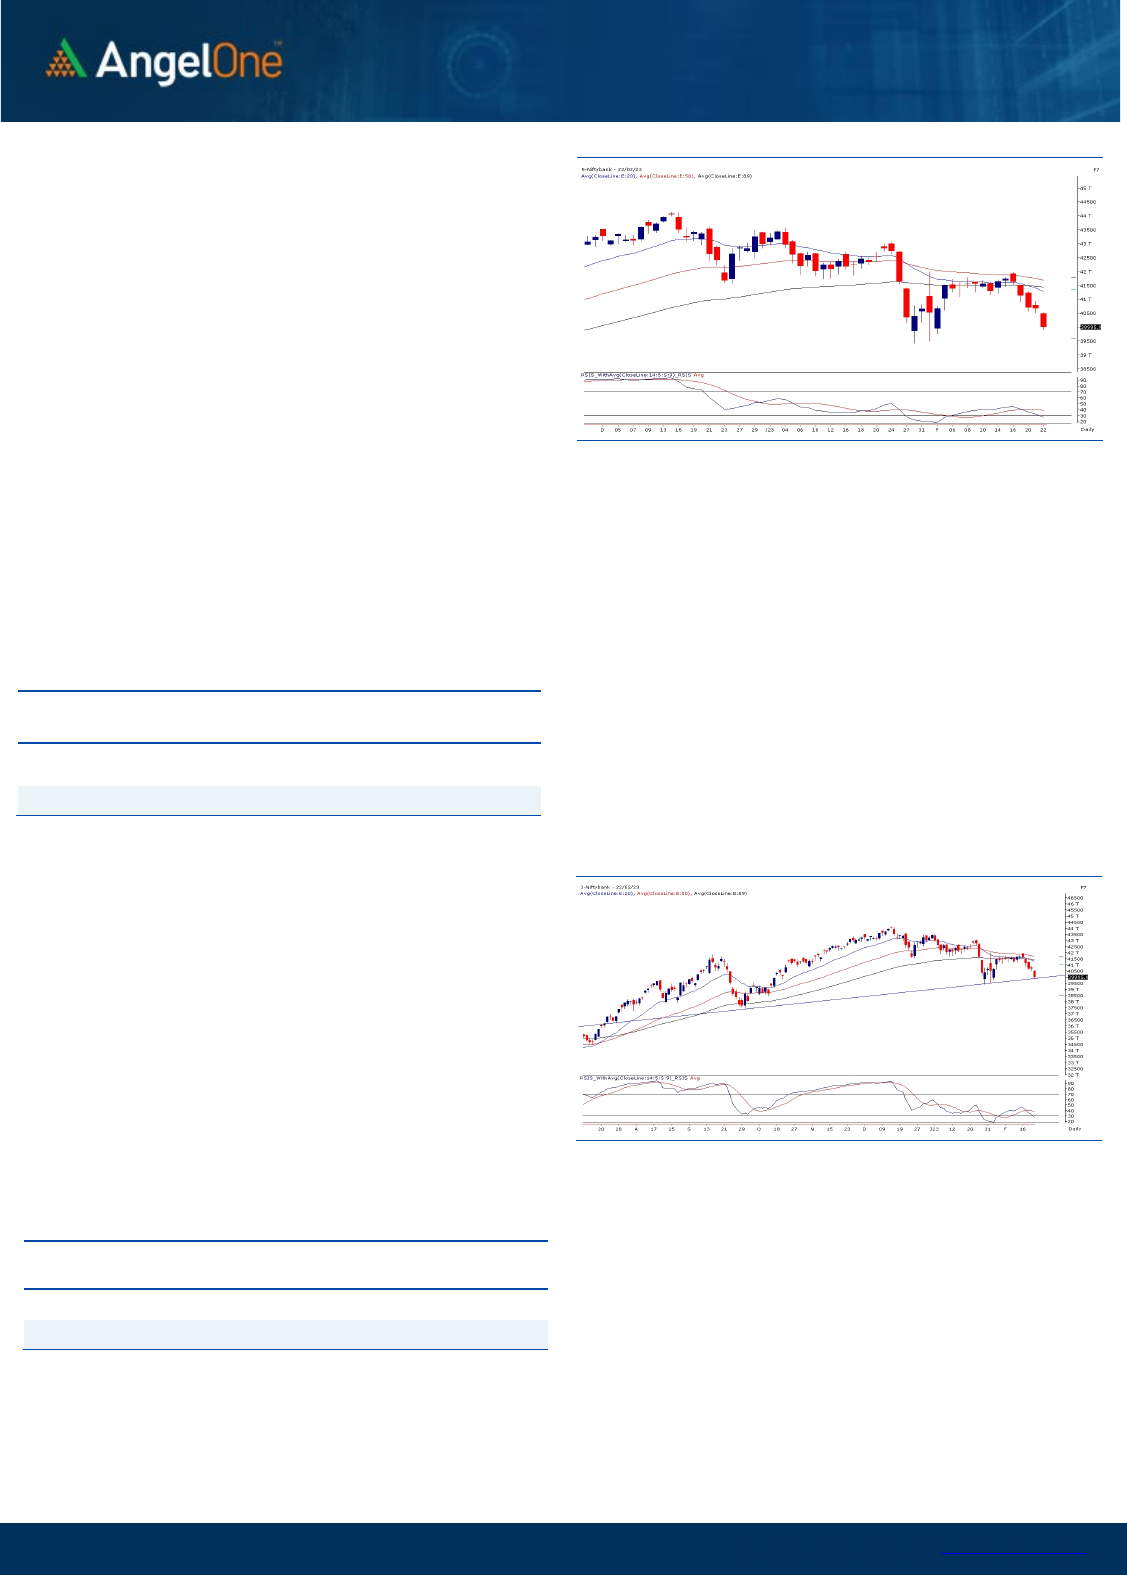
Amidst weak global cues, Nifty broke below the key support of
17700 and triggered a sell-off to register the weakest close in the
last four months below 17600. The charts have now been distorted
and the momentum is gripped by the bears. Now all eyes would be
on how markets react on the F&O expiry day, whether we see a
follow-up sell-off or there's some respite at lower levels. In our
sense, the hourly charts are a bit oversold, and creating short
positions from current levels may turn out to be risky. Also at the
lower end, we see a strong zone of support around 17350 - 17400
which coincides with the budget session low and 200SMA; as of
now, we sense prices to defend this zone.
Key Levels
Support 1 – 17400 Resistance 1 – 17700
Support 2 – 17350 Resistance 2 – 17750
Aggressive traders can opt for buying in this zone if there's
further weakness in the morning session. On the flip side,
previous support around 17700 - 17750 is likely to act as
immediate resistance. With global uncertainty, volatility is likely
to remain on the higher side and hence traders are advised to
keep a tab on the mentioned levels and trade accordingly on the
expiry day.

www.angelone.in
Technical & Derivatives Report
FEB 23, 2023
View
We had a gap down opening one day prior to the
monthly expiry, follow-up selling drag index towards
17500 with no respite to end the day with weakest
close in last four months.
FIIs were net sellers in the cash market segment to
the tune of Rs. 580 crores. Simultaneously, in Index
futures, they sold worth Rs. 2732 crores with massive
jump in open interest, indicating short formation.
In the F&O space, we saw mixed bets in banking
index, whereas good amount of shorts were added
in Nifty. On the options front, massive writing seen
in 17600-17800 call strikes, suggesting series of
hurdle for monthly expiry. On the flip side, 17500 put
strikes hold highest open interest concentration
now. The stronger hands turned net sellers not only
in equities but also in index futures segment. PCR-OI
plunged to 0.69 from 0.83, hinting market is a
oversold. The fear index surged 11% in single day,
which is a sign of caution. Considering the recent
developments, we believe markets are extremely
oversold and traders should strictly avoid fresh
shorts in system for now.
Comments
The Nifty futures open interest has increased by
10.84% and Bank Nifty futures open interest has
decreased by 0.44% as the market closed at 17554.30.
The Nifty FEB future closed with a premium of 12.60
point against a premium of 13.40 point in the last
trading session. The MARCH series closed at a premium
of 107.75 point.
The INDIA VIX increased from 14.00 to 15.58. At the
same time, the PCR-OI of Nifty has decreased from 0.83
to 0.69.
Few of the liquid counters where we have seen high
cost of carry are COALINDIA, AARTIIND, CUB,
RAMCOCEM and CANBK.
Historical Volatility
SCRIP HV
ADANIENT 89.02
ABFRL 41.48
GRASIM 31.53
ACC 41.19
ASTRAL 42.34
Nifty Vs OI
17400
17500
17600
17700
17800
17900
18000
18100
18200
4,000
6,000
8,000
10,000
12,000
14,000
16,000
1/31 2/6 2/8 2/10 2/14 2/16 2/20
Openinterest Nifty
OI Gainers
SCRIP OI
OI
CHG. (%)
PRICE
PRICE
CHG. (%)
SUNTV 10326000 13.79 438.25 -1.44
JUBLFOOD 14805000 13.13 453.30 -1.23
BEL 113566800 8.76 95.00 -0.58
CONCOR 11360000 7.08 586.90 -1.44
SYNGENE 3224000 6.65 579.30 0.73
NAVINFLUOR 580650 6.52 4233.85 -0.43
ONGC 46646600 5.86 153.60 -0.29
HDFCLIFE 23823800 5.63 494.50 -1.38
OI Losers
SCRIP OI
OI
CHG. (%)
PRICE
PRICE
CHG. (%)
TORNTPOWER 3529500 -16.02 495.90 0.02
JKCEMENT 513250 -14.64 2802.95 -2.74
VOLTAS 5526000 -14.02 914.20 1.86
ALKEM 643600 -12.91 3276.40 0.56
MCX 1273600 -12.77 1380.45 -0.14
RAMCOCEM 3014100 -12.68 723.50 -1.62
BAJAJ-AUTO 1415000 -10.54 3840.70 0.02
POLYCAB 870000 -9.63 3013.25 -0.95
Put-Call Ratio
SCRIP PCR (OI) PCR (VOL)
NIFTY 0.69 0.94
BANKNIFTY 0.50 1.01
RELIANCE 0.62 0.57
ICICIBANK 0.61 0.77
INFY 0.51 0.85
www.angelone.in
Technical & Derivatives Report
FEB 23, 2023
Note: Above mentioned Bullish or Bearish Spreads in Nifty (Feb Series) are given as an information and not as a recommendation.
Nifty Spot =
1
7
554.30
0900
Lot Size = 75
FII Statistics for
February
2
2
, 202
3
Detail Buy
Contracts
Open
Interest
Value
(in Cr.)
Sell
Net
CHANGE
INDEX
FUTURES
7466.33 10198.66 (2732.33) 198020 18022.76 34.85
INDEX
OPTIONS
1204947.82 1196116.70 8831.12
2969830 272740.82 19.89
STOCK
FUTURES
36545.17 37697.67 (1152.50) 2251018 147191.36 1.48
STOCK
OPTIONS
9496.86 9199.39 297.47
180545 11433.40 (15.54)
Total 1258456.18
1253212.42
5243.76
5599413
449388.34
10.75
Turnover
on
February
2
2
, 202
3
Instrumen
t
No. of
Contracts
Turnover
( in Cr. )
Change
(%)
Index Futures
525491
49360.70 18.07
Index Options
1933964
81
52758.68 -0.52
Stock Futures
2079730
134686.29 -8.02
Stock Options
3789336
2804.45 12.80
Total
3,789,33
6
2804.45 -1.70
Bull-Call Spreads
Action Strike Price Risk Reward BEP
Buy
17600 39.50
25.15
74.85
17625.15
Sell
17700 14.35
Buy
17600 39.50
33.35
166.65
17633.35
Sell
17800 6.15
Buy
17700 14.35
8.20 91.80 17708.20
Sell
17800 6.15
Bear-Put Spreads
Action Strike Price Risk Reward BEP
Buy
17600 73.60
43.80
56.20
17556.20
Sell 17500 29.80
Buy 17600 73.60
63.05
136.95
17536.95
Sell
17400 10.55
Buy
17500 29.80
19.25 80.75 17480.75
Sell 17400 10.55
Nifty Put-Call Analysis
-10000,000
-5000,000
,0
5000,000
10000,000
15000,000
20000,000
17000 17100 17200 17300 17400 17500 17600 17700 17800 17900 18000 18100 18200 18300
Call Put

www.angelone.in
Technical & Derivatives Report
FEB 23, 2023
`
Daily
Pivot Levels for Nifty Constituents
Scrips
S2
S1
PIVOT
R1
R2
ADANIENT
1,270
1,337
1,449
1,516
1,627
ADANIPORTS 513 530
557
574
600
APOLLOHOSP
4,379
4,414
4,475
4,510
4,571
ASIANPAINT
2,763
2,779
2,797
2,813
2,831
AXISBANK 822 828
835
841
849
BAJAJ-AUTO
3,773
3,807
3,849
3,882
3,924
BAJFINANCE
6,073
6,136
6,248
6,311
6,423
BAJAJFINSV
1,334
1,347
1,370
1,383
1,406
BPCL 313 317
320
324
327
BHARTIARTL 758 765
773
780
789
BRITANNIA
4,438
4,461
4,501
4,524
4,564
CIPLA 951 957
965
971
979
COALINDIA 209 210
213
215
217
DIVISLAB
2,888
2,904
2,921
2,937
2,953
DRREDDY
4,438
4,457
4,489
4,508
4,540
EICHERMOT
3,190
3,220
3,245
3,275
3,300
GRASIM
1,529
1,552
1,593
1,615
1,657
HCLTECH
1,081
1,087
1,096
1,102
1,112
HDFCBANK
1,589
1,602
1,622
1,634
1,655
HDFCLIFE
487
491
496
500
505
HDFC
2,574
2,596
2,630
2,652
2,686
HEROMOTOCO
2,470
2,485
2,510
2,524
2,549
HINDALCO 423 426
430
434
438
HINDUNILVR
2,459
2,477
2,500
2,517
2,541
ICICIBANK 823 831
843
851
862
INDUSINDBK
1,072
1,082
1,090
1,100
1,107
INFY
1,544
1,553
1,564
1,573
1,584
ITC 378 381
383
386
388
JSW STEEL 678 689
706
717
734
KOTAKBANK
1,680
1,690
1,708
1,718
1,736
LT
2,147
2,171
2,206
2,230
2,265
M&M
1,286
1,303
1,328
1,345
1,370
MARUTI
8,520
8,590
8,654
8,724
8,788
NESTLEIND
18,478
18,576
18,729
18,828
18,981
NTPC 166 168
171
173
175
ONGC 150 152
153
155
156
POWERGRID 211 213
215
217
219
RELIANCE
2,340
2,359
2,395
2,414
2,450
SBILIFE
1,111
1,121
1,135
1,145
1,159
SBIN 508 512
517
521
526
SUNPHARMA 959 964
971
976
983
TCS
3,363
3,382
3,415
3,434
3,467
TATACONSUM
711 716
725
730
739
TATAMOTORS 424 427
431
434
439
TATASTEEL 109 110
112
113
115
TECHM
1,110
1,118
1,126
1,134
1,142
TITAN
2,388
2,410
2,436
2,458
2,485
ULTRACEMCO
7,103
7,155
7,243
7,294
7,383
UPL 729 734
742
747
754
WIPRO 391 393
397
399
403

www.angelone.in
Technical & Derivatives Report
FEB 23, 2023
*
Technical and Derivatives Team:
Sameet Chavan Chief Analyst – Technical & Derivatives sameet.chavan@angelone.in
Sneha Seth Senior Analyst – Technical & Derivatives sneha.seth@angelone.in
Rajesh Bhosale Technical Analyst rajesh.bhosle@angelone.in
Osho Krishan Senior Analyst – Technical & Derivatives osho.krishan@angelone.in
Research Team Tel: 022 – 39357600 Website: www.angelone.in
For Technical Queries E-mail: technicalresearch-cso@angelone.in
For Derivatives Queries E-mail: derivatives.desk@angelone.in
DISCLAIMER
Angel One Limited (hereinafter referred to as “Angel”) is a registered Member of National Stock Exchange of India Limited, Bombay Stock Exchange
Limited and Metropolitan Stock Exchange Limited. It is also registered as a Depository Participant with CDSL and Portfolio Manager and investment
advisor with SEBI. It also has registration with AMFI as a Mutual Fund Distributor. Angel One Limited is a registered entity with SEBI for Research
Analyst in terms of SEBI (Research Analyst) Regulations, 2014 vide registration number INH000000164. Angel or its associates has not been
debarred/ suspended by SEBI or any other regulatory authority for accessing /dealing in securities Market.
This document is solely for the personal information of the recipient, and must not be singularly used as the basis of any investment decision.
Nothing in this document should be construed as investment or financial advice. Each recipient of this document should make such investigations
as they deem necessary to arrive at an independent evaluation of an investment in the securities of the companies referred to in this document
(including the merits and risks involved), and should consult their own advisors to determine the merits and risks of such an investment.
Angel or its associates or research analyst or his relative may have actual/beneficial ownership of 1% or more in the securities of the subject
company at the end of the month immediately preceding the date of publication of the research report. Neither Angel or its associates nor
Research Analysts or his relative has any material conflict of interest at the time of publication of research report.
Angel or its associates might have received any compensation from the companies mentioned in the report during the period preceding twelve
months from the date of this report for services in respect of managing or co-managing public offerings, corporate finance, investment banking or
merchant banking, brokerage services or other advisory service in a merger or specific transaction in the normal course of business. Angel or its
associates did not receive any compensation or other benefits from the companies mentioned in the report or third party in connection with the
research report. Neither Angel nor its research analyst entity has been engaged in market making activity for the subject company.
Reports based on technical and derivative analysis center on studying charts of a stock's price movement, outstanding positions and trading
volume, as opposed to focusing on a company's fundamentals and, as such, may not match with a report on a company's fundamentals. Investors
are advised to refer the Fundamental and Technical Research Reports available on our website to evaluate the contrary view, if any.
The information in this document has been printed on the basis of publicly available information, internal data and other reliable sources believed
to be true, but we do not represent that it is accurate or complete and it should not be relied on as such, as this document is for general guidance
only. Angel One Limited or any of its affiliates/ group companies shall not be in any way responsible for any loss or damage that may arise to any
person from any inadvertent error in the information contained in this report. Angel One Limited has not independently verified all the information
contained within this document. Accordingly, we cannot testify, nor make any representation or warranty, express or implied, to the accuracy,
contents or data contained within this document. While Angel One Limited endeavors to update on a reasonable basis the information discussed
in this material, there may be regulatory, compliance, or other reasons that prevent us from doing so.
This document is being supplied to you solely for your information, and its contents, information or data may not be reproduced, redistributed or
passed on, directly or indirectly.
Neither Angel One Limited, nor its directors, employees or affiliates shall be liable for any loss or damage that may arise from or in connection
with the use of this information. Angel or its associates or Research Analyst or his relative might have financial interest in the subject company.
Research analyst has not served as an officer, director or employee of the subject company.
