NOV 22, 2022
www.angelone.in
Technical & Derivatives Report
xOOOOOOOO
Nifty Bank Outlook (42347)
Bank Nifty as well started on a negative note however there was a
lack of traction after opening and after trading in a range for the
major part there was buying seen at lower levels that regained a
major part of the morning's lost ground. Eventually, the bank index
ended around the high point of the day with a minor loss of 0.21%
at 42347.
On the technical front, there's no major change in the price
structure and prices are in a consolidation phase within a primary
uptrend. We have to reiterate that since the index intraday
movement is lethargic, one should rather focus on individual stocks
that are giving outperforming opportunities. The PSU Bank Index
was up more than a percent and many individual stocks from this
basket were up more than 10%. Traders are hence advised to focus
outside the index and continue with stock centric approach. As far
as levels are concerned, immediate support is seen in the zone of
42100 - 42000 whereas resistance is seen at 42500 - 42660 levels.
Ke
y Levels
Support 1 – 42100 Resistance 1 – 42500
Support 2 – 42000 Resistance 2 – 42660
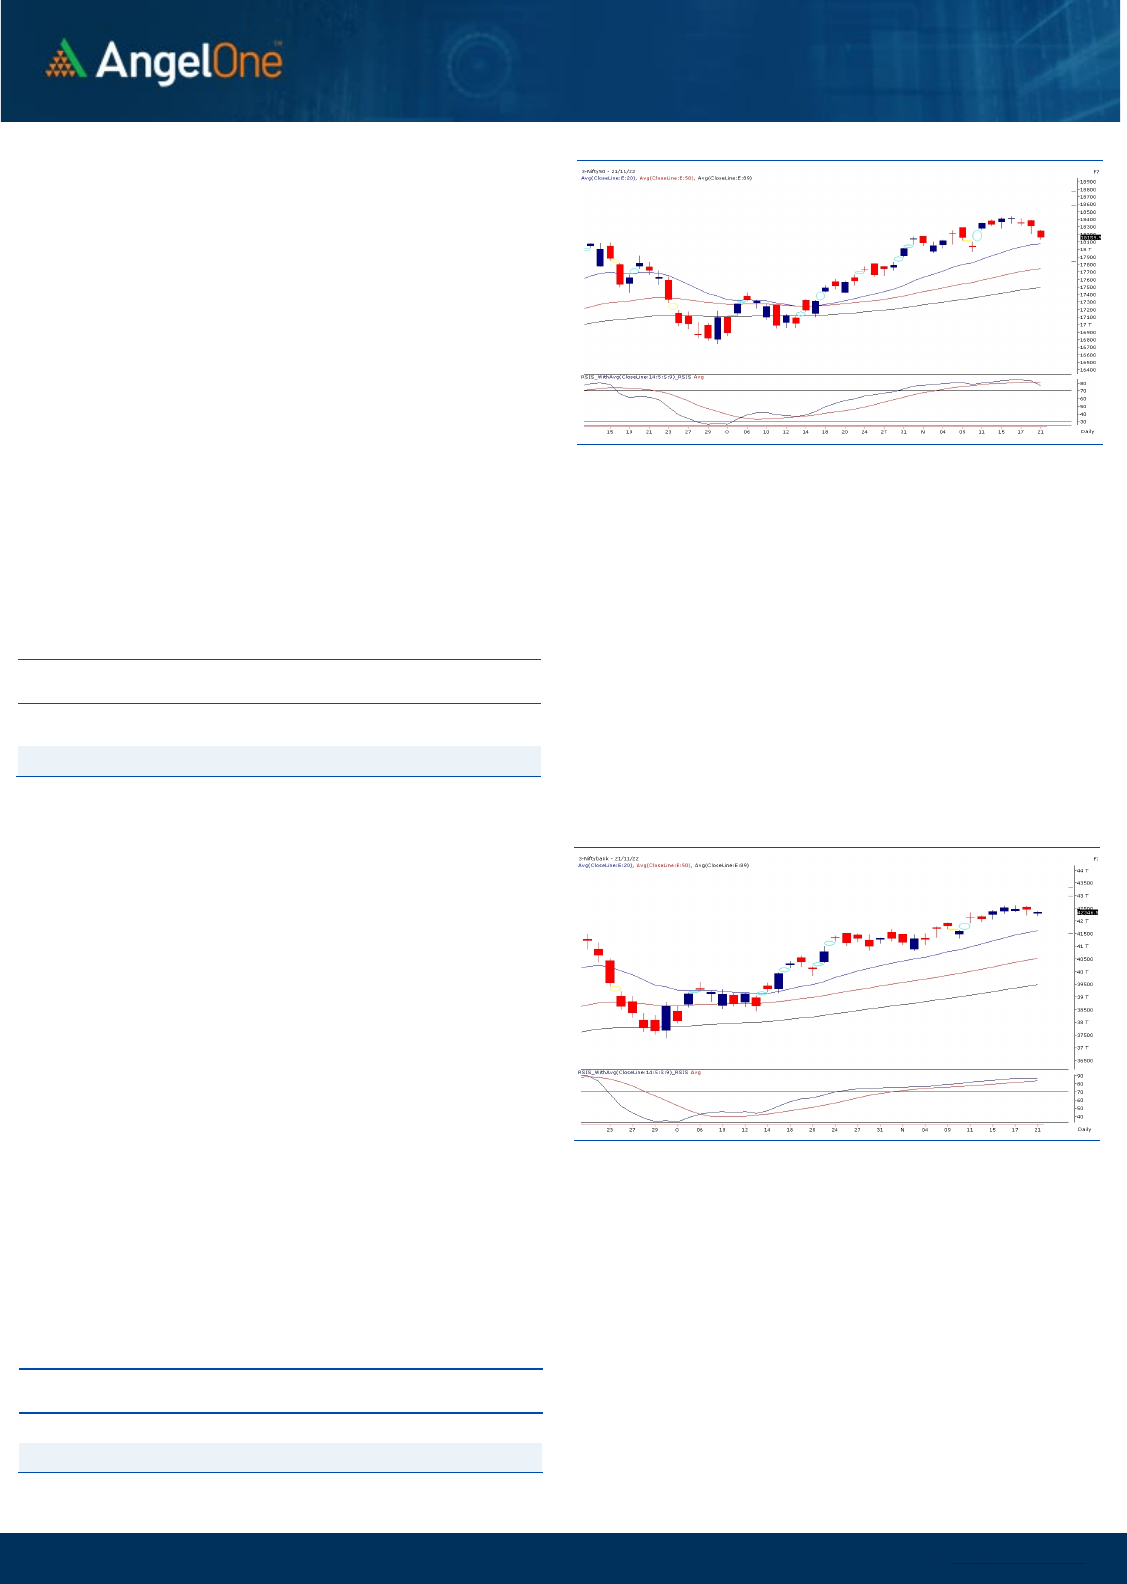
Exhibit 1: Nifty
Daily
Chart
Exhibit 2: Nifty Bank
Daily
Chart
Sensex (61145) / Nifty (18160)
The Indian equity markets had a timid start to the week, taking cues
from the bleak Asian bourses. The benchmark index Nifty50 slipped
into the bullish gap at the very beginning of the opening bell and
stayed in a slender range at the lower zone throughout. The bulls
hesitated to capitalize on the dip, and Nifty concluded the day with
a cut of 0.81 percent, a tad above the 18150 level.
Technically speaking, the current placement of the index is at a
crucial level now, which is also highly anticipated to be a strong
demand zone. The market sentiments are still upbeat, and till the
index manages to sustain above the 18100-18000 zone, dips could
be seen as a buying opportunity for the participants. As far as levels
are concerned, the psychological mark of 18000 is likely to act as
the sheet anchors’ role, before which 18100 could provide a pitstop
to the cool-off in the index. On the higher end, 18250-18300 is the
intermediate resistance, followed by the sturdy hurdle of 18450-
18500.
Key Levels
Support 1 – 18100 Resistance 1 – 18350
Support 2 – 18000 Resistance 2 – 18500
Going forward, the index is likely to trade within the mentioned
range in the comparable period, and any decisive breach on
either side could only dictate the near-term trend. From hereon,
selective stocks could outperform the market; hence, we
advocate the participants to be strictly selective and grasp the
stock-specific approach for better trading opportunities.
www.angelone.in
Technical & Derivatives Report
NOV 22, 2022
View
The Indian equity market witnessed gap down opening
for the week which was followed by some follow-up
selling towards 18150. However, with no much
abbreviation thereafter index consolidated to conclude
the day tad above 18150 with the cut of eight tenth of a
percent.
FIIs were net sellers in the cash market segment to
the tune of Rs. 1594 crores. Simultaneously, in Index
futures, they sold worth Rs. 761 crores with a decrease
in open interest, indicating long unwinding.
Yesterday, we hardly saw any relevant open interest
change in both Nifty as well as BankNifty. Due to good
amount of writing in 18200 and 18300 call options, the
PCR-OI tanked further to 0.79 from 0.89 which clearly
suggests market is a bit oversold now. Stronger hands
continue to curb liquidity and preferred unwinding
longs in index futures segment. At current juncture,
the index has been placed around the crucial support
zone of 18100-18000 and as long we manage to respect
same on the closing basis there is no sign of
worrisome, if looking at the PCR-OI we would advocate
capitalizing such dips to add fresh longs in system.
Comments
The Nifty futures open interest has decreased by
1.01%. and Bank Nifty futures open interest has
increased by 1.77% as the market closed at 18159.95.
The Nifty November future closed with a premium of
32.35 point against a premium of 48.25 point in the
last trading session. The December series closed at
a premium of 124.10 point.
The INDIA VIX increased from 14.39 to 14.79. At the
same time, the PCR-OI of Nifty has decreased from
0.89 to 0.79.
Few of the liquid counters where we have seen high
cost of carry are GNFC, IDEA, DELTACORP,
IBULHSGFIN and CUB.
Historical Volatility
SCRIP HV
ESCORTS 43.45
IEX 46.12
TVSMOTOR 38.55
SRTRANSFIN 48.32
PNB 50.76
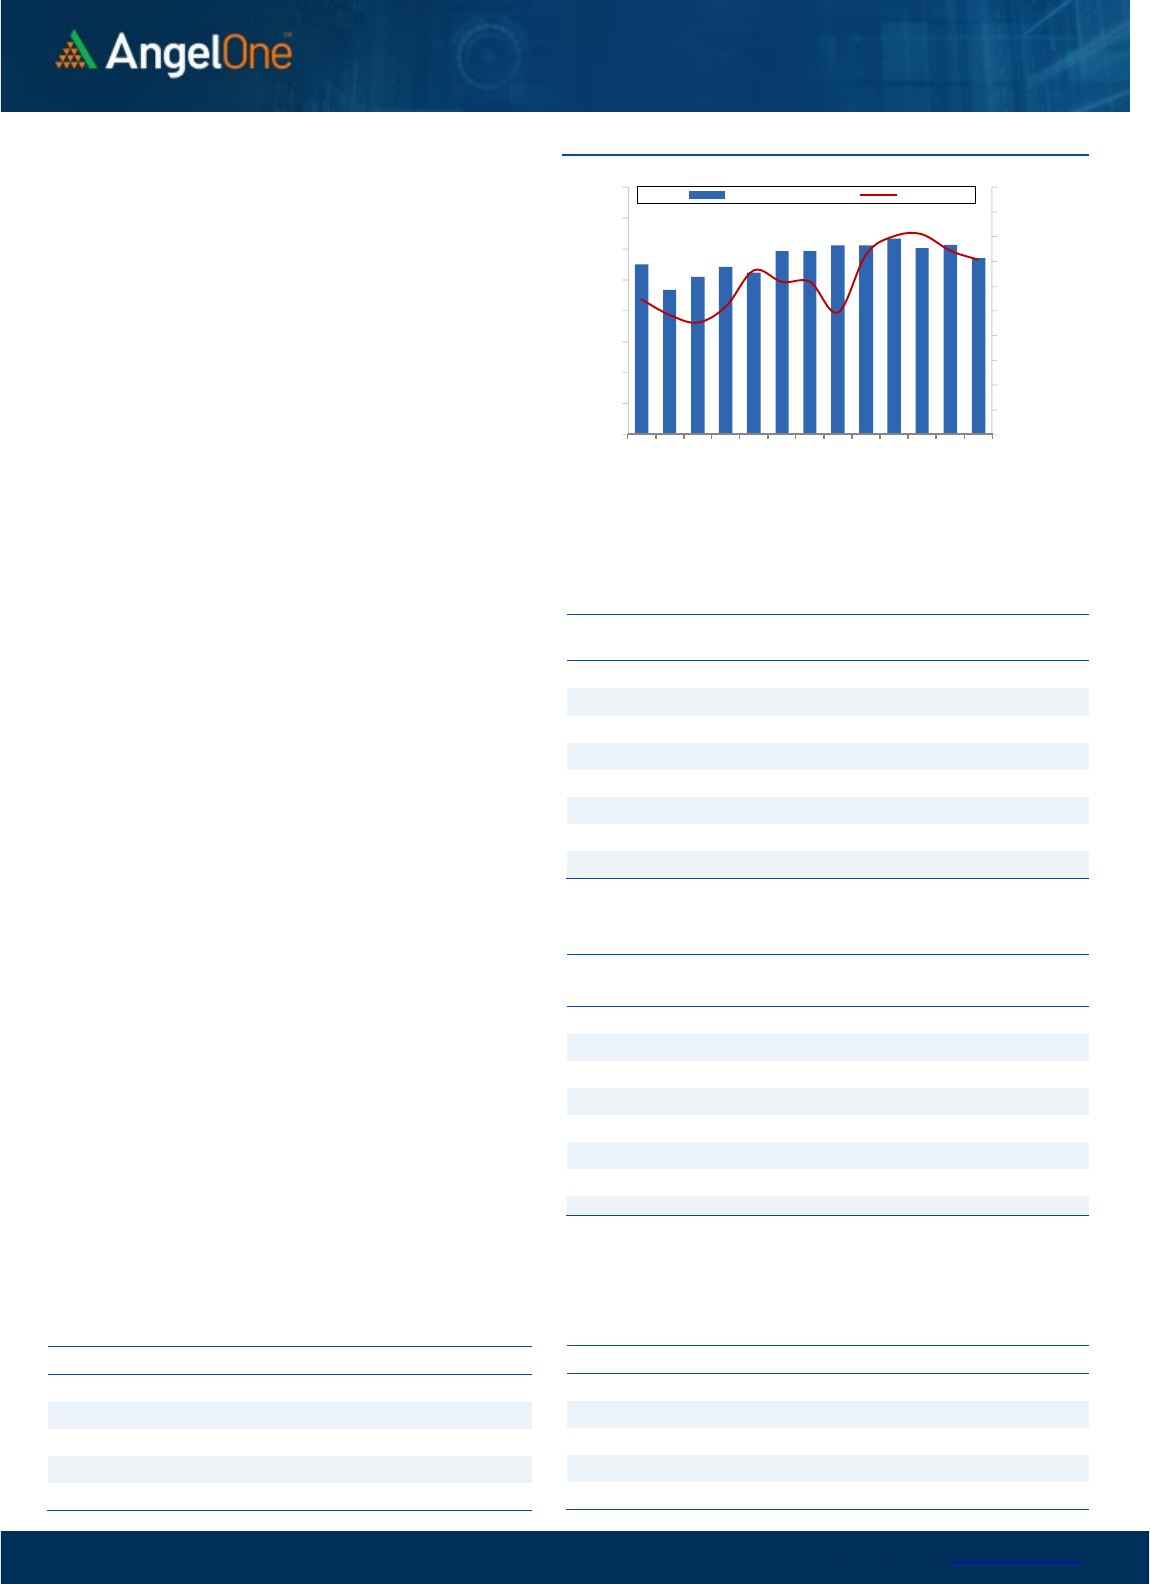
Nifty Vs OI
17600
17700
17800
17900
18000
18100
18200
18300
18400
18500
18600
8,000
9,000
10,000
11,000
12,000
13,000
14,000
15,000
16,000
11/1 11/3 11/7 11/9 11/14 11/16 11/18
Openinterest Nifty
OI Gainers
SCRIP OI
OI
CHG. (%)
PRICE
PRICE
CHG. (%)
ESCORTS 1930500 61.71 2196.05 7.81
POLYCAB 1576800 23.00 2524.95 -0.48
LTI 1449300 15.26 4766.90 -2.35
NMDC 34000200 14.49 115.25 3.68
SIEMENS 1957450 13.02 2811.20 -0.87
IDEA 698670000 12.23 8.40 1.20
UBL 1055200 10.70 1653.50 -0.65
FEDERALBNK 86145000 8.20 132.40 -0.34
OI Losers
SCRIP OI
OI
CHG. (%)
PRICE
PRICE
CHG. (%)
RAMCOCEM 4712400 -23.15 662.50 1.85
GSPL 4177500 -19.20 235.20 -1.05
AARTIIND 3415300 -18.40 669.35 2.87
MINDTREE 1865800 -18.27 3429.05 -2.28
PNB 235680000 -16.12 47.60 3.82
HDFCAMC 1683000 -15.31 2071.45 0.45
METROPOLIS 1145000 -14.91 1444.50 -0.36
LTTS 1070400 -13.57 3808.70 0.33
Put-Call Ratio
SCRIP PCR (OI) PCR (VOL)
NIFTY 0.79 0.86
BANKNIFTY 1.00 0.96
RELIANCE 0.52 0.65
ICICIBANK 0.53 0.48
INFY 0.62 0.61
www.angelone.in
Technical & Derivatives Report
NOV 22, 2022
Note: Above mentioned Bullish or Bearish Spreads in Nifty (Nov Series) are given as an information and not as a recommendation.
Nifty Spot =
1
8
159.95
FII Statistics for
November
21
, 2022
Detail Buy
Contracts
Open
Interest
Value
(in Cr.)
Sell
Net
CHANGE
INDEX
FUTURES
2663.46 3424.51 (761.05) 170230 16106.97 (4.85)
INDEX
OPTIONS
633874.05 634942.13 (1068.08) 2037709 192105.79 6.70
STOCK
FUTURES
55498.11 55304.27 193.84
2154165 146573.46 (0.76)
STOCK
OPTIONS
12795.30 12390.39 404.91
157325 11035.92 (2.44)
Total 704830.92
706061.30
(1230.38) 4519429
365822.14
2.23
Turnover on
November
21
, 2022
Instrument
No. of
Contracts
Turnover
( in Cr. )
Change
(%)
Index
Futures
277507 26778.94 -17.80
Index
Options
85230392 27621.24 -15.73
Stock
Futures
2048972 138982.04 77.25
Stock
Options
4224723 2502.39 -18.28
Total
4,224,723 2502.39 33.41
Bull-Call Spreads
Action Strike Price Risk Reward BEP
Buy
18200 78.85
39.50
60.50
18239.50
Sell
18300 39.35
Buy
18200 78.85
60.40
139.60
18260.40
Sell
18400 18.45
Buy
18300 39.35
20.90 79.10 18320.90
Sell 18400 18.45
Bear
-
Put Spreads
Action Strike Price Risk Reward BEP
Buy 18200 88.30
40.95
59.05
18159.05
Sell
18100 47.35
Buy 18200 88.30
65.00
135.00
18135.00
Sell 18000 23.30
Buy
18100 47.35
24.05 75.95 18075.95
Sell 18000 23.30
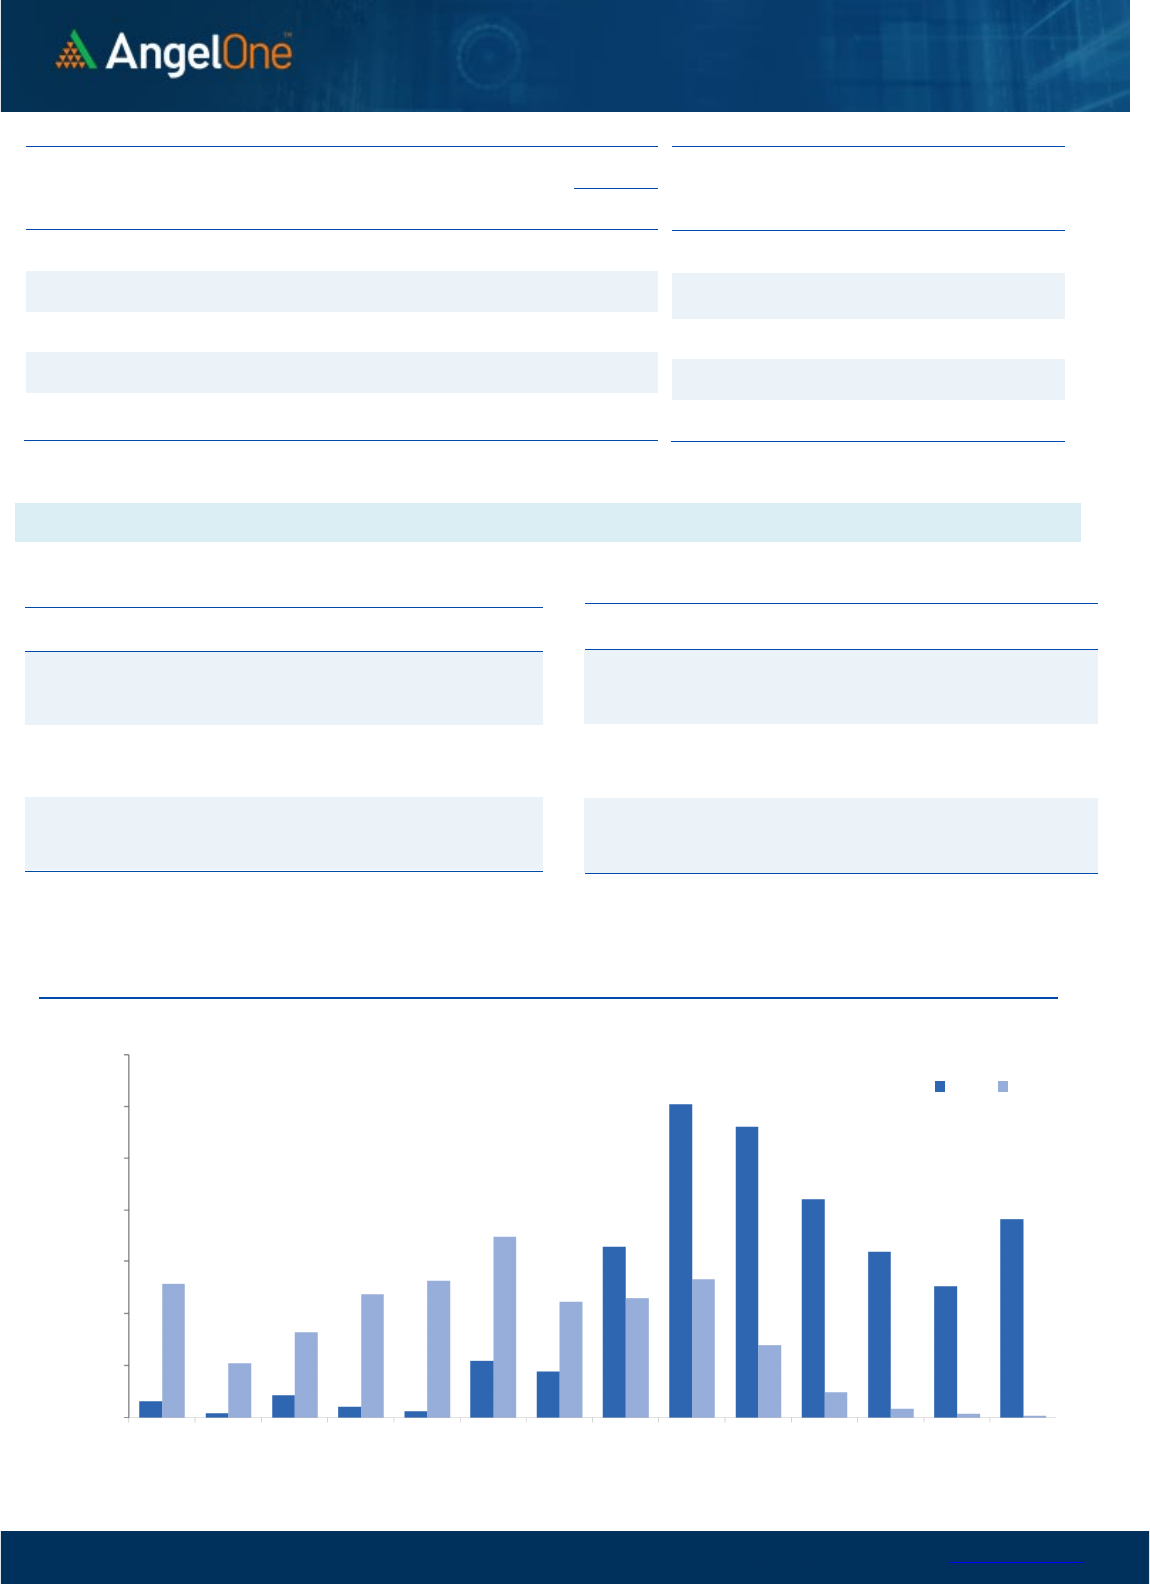
Nifty Put
-
Call Analysis
,0
2000,000
4000,000
6000,000
8000,000
10000,000
12000,000
14000,000
17500 17600 17700 17800 17900 18000 18100 18200 18300 18400 18500 18600 18700 18800
Call Put

www.angelone.in
Technical & Derivatives Report
NOV 22, 2022
`
Daily Pivot Levels for Nifty Constituents
Scrips
S2
S1
PIVOT
R1 R2
ADANIENT 3,883 3,943
3,981
4,041
4,079
ADANIPORTS
857
864
876
883
895
APOLLOHOSP
4,301
4,360
4,400
4,459
4,499
ASIANPAINT 3,046 3,071
3,091
3,115
3,135
AXISBANK
855
862
867
874
879
BAJAJ-AUTO 3,585 3,602
3,624 3,641
3,663
BAJFINANCE 6,542 6,611
6,679
6,747
6,815
BAJAJFINSV
1,607
1,621
1,640
1,654
1,672
BPCL
302
306
309
313
315
BHARTIARTL
829
840
846
858
864
BRITANNIA 4,067 4,094
4,121
4,148
4,175
CIPLA
1,088
1,096
1,102 1,111
1,117
COALINDIA
225
227
229
231
233
DIVISLAB 3,228 3,247
3,275
3,294
3,322
DRREDDY 4,278 4,314
4,353 4,389
4,429
EICHERMOT
3,339
3,359
3,385 3,405
3,431
GRASIM
1,657
1,670
1,689
1,702
1,721
HCLTECH
1,084
1,090
1,098
1,104
1,112
HDFCBANK
1,578
1,588
1,600
1,610
1,622
HDFCLIFE
526
529
532
535
538
HDFC 2,588 2,604
2,629
2,645
2,670
HEROMOTOCO
2,631
2,654
2,688 2,712
2,746
HINDALCO 418 424
434
441 451
HINDUNILVR 2,453 2,477
2,494 2,519
2,536
ICICIBANK
909
915
920
926
931
INDUSINDBK 1,108 1,123
1,133 1,148
1,158
INFY
1,550
1,559
1,573
1,583
1,597
ITC
332
334
337
340
343
JSW STEEL
674
685
704
715
734
KOTAKBANK
1,922
1,933
1,944
1,955
1,966
LT 1,991 2,001
2,017
2,027
2,043
M&M 1,185 1,202
1,218
1,235
1,251
MARUTI
8,717
8,791
8,860
8,934 9,003
NESTLEIND
19,568
19,665
19,762
19,859
19,956
NTPC
163
164
165
166
167
ONGC
133
134
135
136
137
POWERGRID
215
217
218 220
221
RELIANCE
2,516
2,533
2,561
2,578
2,606
SBILIFE 1,184 1,205
1,227
1,249
1,270
SBIN
592
595
599
602
605
SUNPHARMA
984
994
1,003
1,013
1,022
TCS
3,236
3,260
3,297
3,320 3,357
TATACONSUM
756 764
770
777
783
TATAMOTORS 415 418
423
426 431
TATASTEEL
101
103
105
107
109
TECHM
1,026
1,034
1,046
1,054
1,066
TITAN 2,525 2,549
2,564 2,588 2,603
ULTRACEMCO 6,655 6,705
6,790
6,840
6,926
UPL
750
755
760
765
770
WIPRO
383
386
390
393
397

www.angelone.in
Technical & Derivatives Report
NOV 22, 2022
*
Technical and Derivatives Team:
Sameet Chavan Chief Analyst – Technical & Derivatives sameet.chavan@angelone.in
Sneha Seth Senior Analyst – Technical & Derivatives sneha.seth@angelone.in
Rajesh Bhosale Technical Analyst rajesh.bhosle@angelone.in
Osho Krishan Senior Analyst – Technical & Derivatives osho.krishan@angelone.in
Research Team Tel: 022 – 39357600 Website: www.angelone.in
For Technical Queries E-mail: technicalresearch-cso@angelone.in
For Derivatives Queries E-mail: derivatives.desk@angelone.in
DISCLAIMER
Angel One Limited (hereinafter referred to as “Angel”) is a registered Member of National Stock Exchange of India Limited, Bombay
Stock Exchange Limited and Metropolitan Stock Exchange Limited. It is also registered as a Depository Participant with CDSL and
Portfolio Manager and investment advisor with SEBI. It also has registration with AMFI as a Mutual Fund Distributor. Angel One
Limited is a registered entity with SEBI for Research Analyst in terms of SEBI (Research Analyst) Regulations, 2014 vide registration
number INH000000164. Angel or its associates has not been debarred/ suspended by SEBI or any other regulatory authority for
accessing /dealing in securities Market.
This document is solely for the personal information of the recipient, and must not be singularly used as the basis of any investment
decision. Nothing in this document should be construed as investment or financial advice. Each recipient of this document should
make such investigations as they deem necessary to arrive at an independent evaluation of an investment in the securities of the
companies referred to in this document (including the merits and risks involved), and should consult their own advisors to determine
the merits and risks of such an investment.
Angel or its associates or research analyst or his relative may have actual/beneficial ownership of 1% or more in the securities of
the subject company at the end of the month immediately preceding the date of publication of the research report. Neither Angel or
its associates nor Research Analysts or his relative has any material conflict of interest at the time of publication of research report.
Angel or its associates might have received any compensation from the companies mentioned in the report during the period
preceding twelve months from the date of this report for services in respect of managing or co-managing public offerings, corporate
finance, investment banking or merchant banking, brokerage services or other advisory service in a merger or specific transaction
in the normal course of business. Angel or its associates did not receive any compensation or other benefits from the companies
mentioned in the report or third party in connection with the research report. Neither Angel nor its research analyst entity has been
engaged in market making activity for the subject company.
Reports based on technical and derivative analysis center on studying charts of a stock's price movement, outstanding positions and
trading volume, as opposed to focusing on a company's fundamentals and, as such, may not match with a report on a company's
fundamentals. Investors are advised to refer the Fundamental and Technical Research Reports available on our website to evaluate
the contrary view, if any.
The information in this document has been printed on the basis of publicly available information, internal data and other reliable
sources believed to be true, but we do not represent that it is accurate or complete and it should not be relied on as such, as this
document is for general guidance only. Angel One Limited or any of its affiliates/ group companies shall not be in any way responsible
for any loss or damage that may arise to any person from any inadvertent error in the information contained in this report. Angel One
Limited has not independently verified all the information contained within this document. Accordingly, we cannot testify, nor make
any representation or warranty, express or implied, to the accuracy, contents or data contained within this document. While Angel
One Limited endeavors to update on a reasonable basis the information discussed in this material, there may be regulatory,
compliance, or other reasons that prevent us from doing so.
This document is being supplied to you solely for your information, and its contents, information or data may not be reproduced,
redistributed or passed on, directly or indirectly.
Neither Angel One Limited, nor its directors, employees or affiliates shall be liable for any loss or damage that may arise from or in
connection with the use of this information. Angel or its associates or Research Analyst or his relative might have financial interest
in the subject company. Research analyst has not served as an officer, director or employee of the subject company.
