September
2
2
, 2023
www.angelone.in
Technical & Derivatives Report
8
Nifty Bank Outlook (
4
4624
)
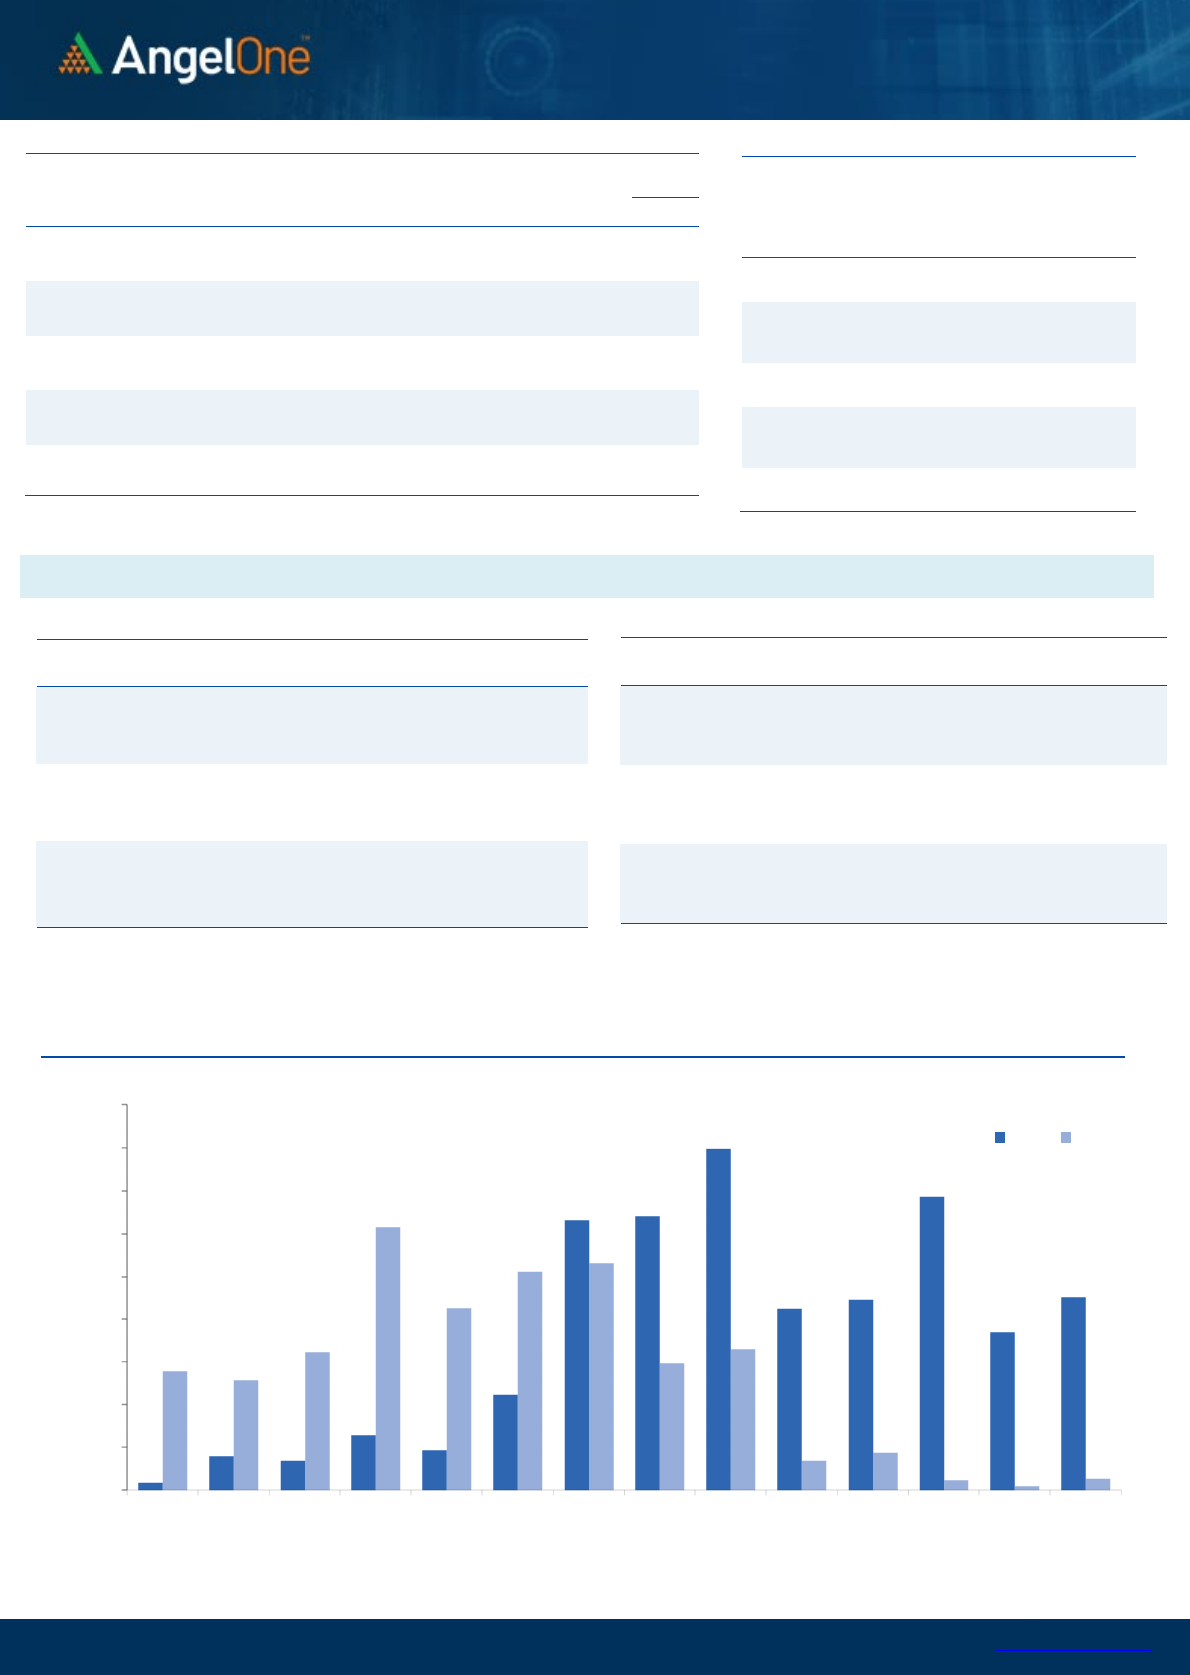
Bank Nifty experienced its third consecutive session with a downward
gap at the opening. As the day progressed, there was no significant
rebound, and prices continued to decline throughout the session.
Eventually, the bank index concluded the day with a cut of 1.69%,
ending a tad above the 44600 level.
Bears have been dominant, erasing over 1500 points in just three
sessions and undoing most of the gains made by the Bulls in the early
part of September. The charts have clearly been distorted, with crucial
support levels easily breached. On the daily chart, prices have fallen
below important moving averages and have also slipped below the
61.8% retracement level of the recent rally. This suggests that the
upward momentum has fizzled out, and there may be more downside
in the near future. However, it's worth noting that creating fresh short
positions at current levels may not be advisable, as hourly indicators
are in an oversold zone, and in between strong bounce-back cannot
be ruled out. Going ahead, the focus would be on the 89EMA, which
served as a support level during August month and is now placed
around 44400. Additionally, the starting point of the recent rally at
43800 is a critical level to monitor in case the bulls intend to stage a
comeback.
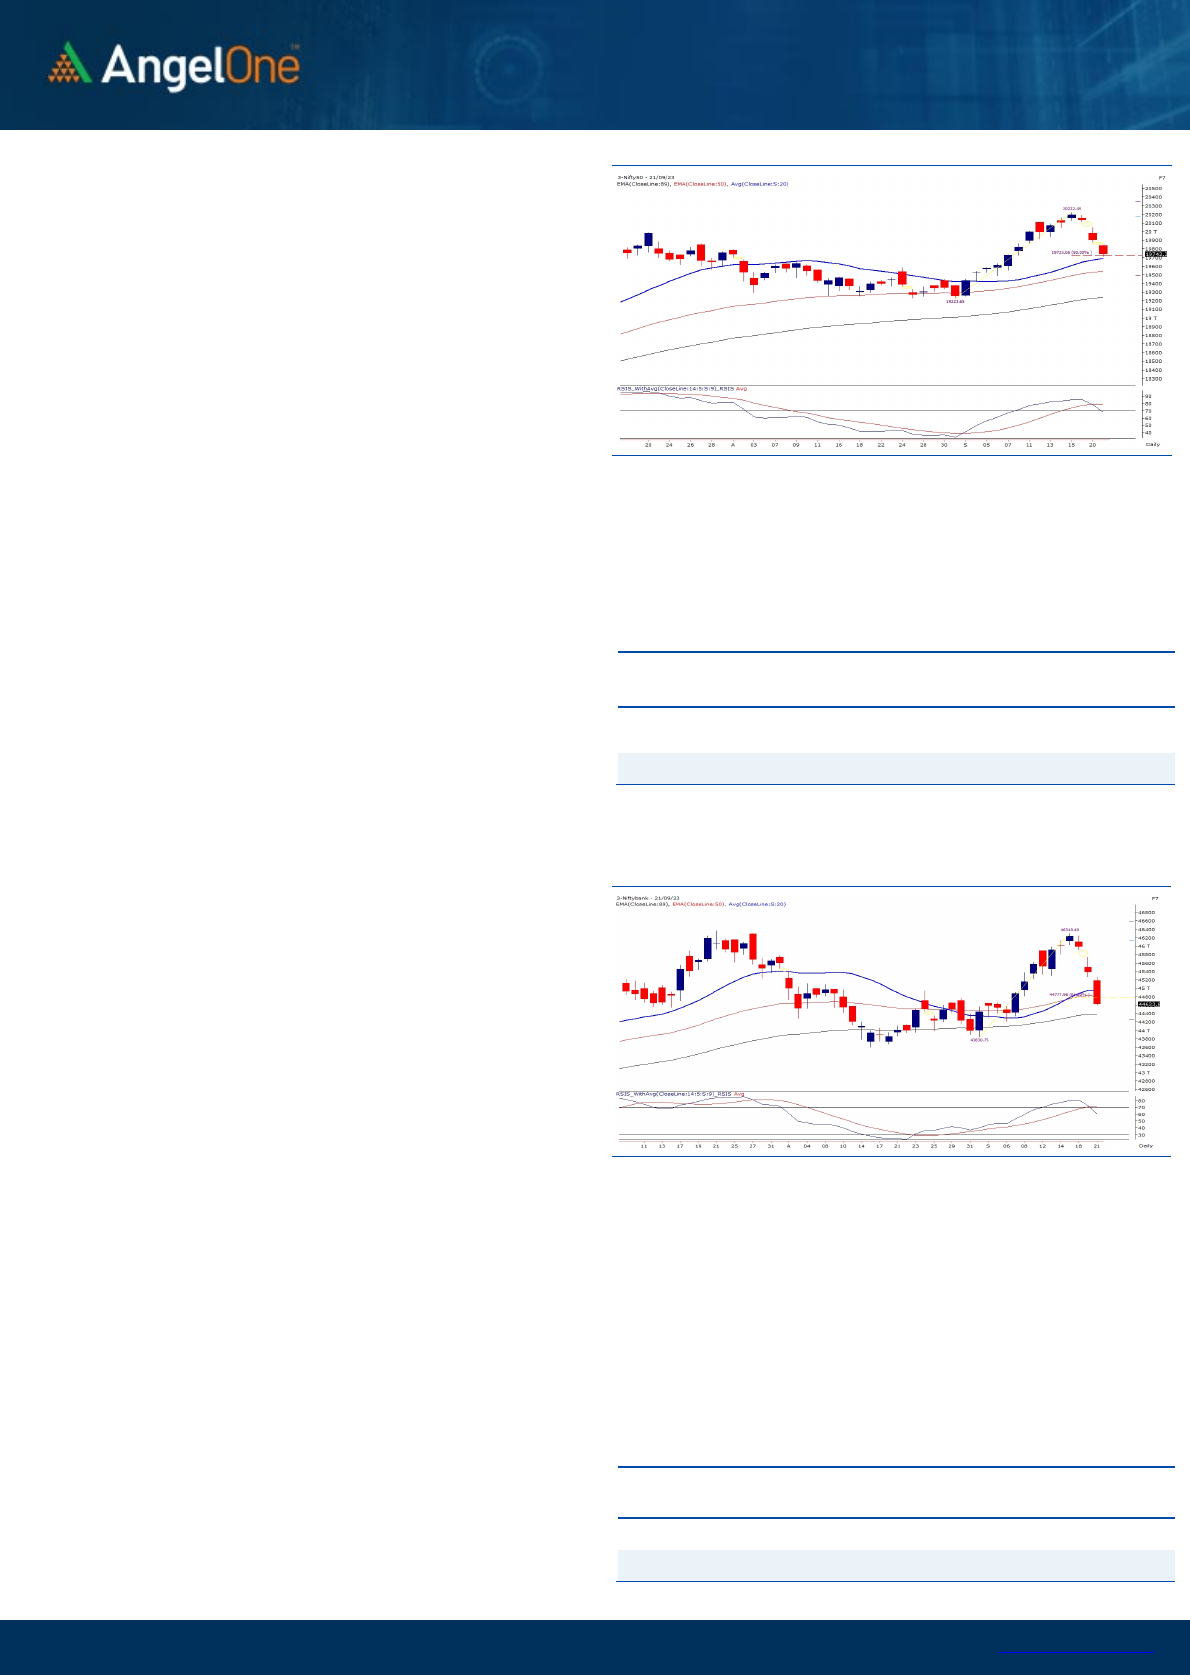
Exhibit 1: Nifty Daily Chart
Exhibit 2: Nifty Bank Daily Chart
Sensex (
6
6
230
) / Nifty (
19
742
)
The weakness in Indian equities intensified during the weekly expiry
session, wherein the benchmark index plummeted to the 50 percent
retracement of the last three weeks’ rally. The consecutive gap-down
opening signifies the intensity of the bears while dragging the market
downwards. The Nifty50 index continued its selling streak for the third
session in a row and eventually settled a tad below 19750 odd zone,
eroding over 2.20 percent in the week to date.
Technically, Nifty has corrected nearly 50 percent of the recent rally
and is currently placed near a strong pivotal support of 20 DEMA and
the consolidation breakout zone, which is expected to act as the
intermediate pitstop for the bears. On the levels front, 19700-19680 is
likely to cushion the fall, while the subsequent support of 61.80%
Fibonacci is placed around 19600 zone. On the flip side, the immediate
resistance will be seen around 19800, followed by the bearish gap zone
of 19850-19880 in the near period.
The bullish undertone has been significantly impacted by the blips
seen this week and the global concerns are likely to play a vital role
in projecting the near-term trend for our markets. Meanwhile, we
encourage traders to refrain from aggressive bets and patiently wait
for sustainability to look for quality buying opportunities.
Key Levels
Support 1 – 19680 Resistance 1 – 19850
Support 2 – 19600 Resistance 2 – 19880
On the flip side, the rapid decline has made it challenging to pinpoint
a key resistance level. Still, 45000 to 45200 can be identified as
immediate resistance levels in case there’s an immediate bounce
back. In the last two sessions, HDFCBANK played a significant role in
dragging down this heavyweight index, and yesterday, other
heavyweight banks also contributed to the decline. Consequently, it
is advisable for traders to exercise caution and avoid unnecessary
risks at this time. It would be prudent to wait for nervousness to
settle before taking up any aggressive trading bets.
Key Levels
Support 1 – 44400 Resistance 1 – 45000
Support 2 – 43800 Resistance 2 – 45200

www.angelone.in
Technical & Derivatives Report
September
2
2
, 2023
View
The Indian equity market extended the pain for the
third consecutive session, ending with yet another
cut of a percent.
FIIs were net sellers in the cash market segment to
the tune of Rs. 3007 cr. Simultaneously, they sold
worth Rs. 880 cr in Index futures with a massive rise
in open interest, suggesting the formation of shorts.
On the derivatives front, the open interest activity
remained muted in Nifty; but the banking index
witnessed meaningful short formation. For the
coming monthly expiry, 19500 put and 20000 call is
attracting traders’ attention. Yesterday, we
witnessed a good amount of writing in 19800-19900
call strikes. Meanwhile, the build-up on the put side
remained scattered. Considering the quantum of
shorts formed in the banking index and writing in
ATM call strikes, we would advise avoiding any
aggressive bets for the time being and waiting for the
market to stabilise.
Comments
The Nifty futures open interest has increased by 0.21%
and Bank Nifty futures open interest has increased by
20.56% as the market closed at 19,742.35.
The Nifty September future closed with a premium of
36.35 points against 70.65 points in the last trading
session. The October series closed at a premium of
154.75 points.
The INDIA VIX has decreased from 11.13 to 10.82. At
the same time, the PCR-OI of Nifty has increased from
0.80 to 0.82.
A few of the liquid counters where we have seen high
cost of carry are BHEL, IDEA, DALBHARAT, GAIL and
DLF.
Historical Volatility
SCRIP HV
ICICIBANK 24.28
ICICIPRULI 36.05
BALRAMCHIN 43.66
M&M 31.16
CIPLA 27.09
Nifty Vs OI
19000
19200
19400
19600
19800
20000
20200
20400
20600
,0
2,000
4,000
6,000
8,000
10,000
12,000
14,000
9-6 9-8 9-12 9-14 9-18 9-21
Openinterest Nifty
OI Gainers
SCRIP OI
OI
CHG. (%)
PRICE
PRICE
CHG. (%)
PFC 72470250 15.06 229.70 -0.31
MCX 3415200 10.48 1749.45 1.55
RBLBANK 59450000 10.22 226.35 -2.41
GLENMARK 9715000 9.80 827.70 -3.60
M&MFIN 47132000 6.95 301.00 -3.07
GUJGASLTD 10846250 6.32 441.05 -1.37
HCLTECH 12045600 5.23 1278.00 -1.71
SYNGENE 4403000 5.21 777.65 -2.67
OI Losers
SCRIP OI
OI
CHG. (%)
PRICE
PRICE
CHG. (%)
PNB 17600 -7.65 75.00 -1.64
BAJAJ-AUTO 2342750 -6.24 5085.20 -1.87
ASIANPAINT 5111000 -5.90 3244.10 1.05
BRITANNIA 2049400 -5.76 4558.50 0.35
CONCOR 6342000 -5.43 740.35 -0.32
OFSS 389400 -5.30 4254.35 0.71
SBILIFE 8104500 -4.99 1334.20 -1.05
PERSISTENT 1021125 -4.95 5755.05 -0.79
Put-Call Ratio
SCRIP PCR (OI) PCR (VOL)
NIFTY 0.82 0.94
BANKNIFTY 0.72 1.10
RELIANCE 0.44 0.41
ICICIBANK 0.46 0.64
INFY 0.51 0.44
www.angelone.in
Technical & Derivatives Report
September
2
2
, 2023
Note: Above mentioned Bullish or Bearish Spreads in Nifty (Sep Series) are given as an information and not as a recommendation.
Nifty Spot =
19
742.35
FII Statistics for
September
2
1
, 2023
Detail Buy
Contracts
OI Value
(in Cr.)
Sell Net
CHANGE
INDEX
FUTURES
5164.02 6043.69 (879.67) 174769 15178.98
11.10
INDEX
OPTIONS
1928999.38 1961049.12 (32049.74) 3282368 261923.98 8.82
STOCK
FUTURES
19362.35 20218.70 (856.35) 2370044 187324.51 0.46
STOCK
OPTIONS
35887.87 35934.47 (46.60) 360877 28881.61 0.63
Total
1989413.62
2023245.98
(33832.36) 6188058
493309.08
5.03
Turnover on
September
2
1
, 2023
Instrument
No. of
Contracts
Turnover
(in Cr.)
Change
(%)
Index Futures
407849 32962.70
86.19
Index
Options
649093578
56188.99
30.72
Stock Futures
1042598 85572.94
25.90
Stock
Options
4953318 4664.50 -6.32
Total
49,53,318
4664.50 34.23
Bull-Call Spreads
Action Strike Price Risk Reward BEP
Buy
19800 94.70
42.45
57.55
19842.45
Sell
19900 52.25
Buy
19800 94.70
68.00
132.00
19868.00
Sell
20000 26.70
Buy
19900 52.25
25.55 74.45 19925.55
Sell
20000 26.70
Bear-Put Spreads
Action Strike Price Risk Reward BEP
Buy
19700 75.45
28.55
71.45
19671.45
Sell 19600 46.90
Buy 19700 75.45
45.90
154.10
19654.10
Sell
19500 29.55
Buy
19600 46.90
17.35 82.65 19582.65
Sell 19500 29.55
Nifty Put
-
Call Analysis
,0
1000,000
2000,000
3000,000
4000,000
5000,000
6000,000
7000,000
8000,000
9000,000
19200 19300 19400 19500 19600 19700 19800 19900 20000 20100 20200 20300 20400 20500
Call Put

www.angelone.in
Technical & Derivatives Report
September
2
2
, 2023
`
Daily Pivot Levels for Nifty Constituents
Scrips S2 S1 PIVOT R1 R2
ADANIENT 2,439 2,459 2,481 2,502 2,524
ADANIPORTS 809 820 831 842 854
APOLLOHOSP 4,943 4,981 5,014 5,053 5,086
ASIANPAINT 3,148 3,196 3,229 3,277 3,309
AXISBANK 999 1,007 1,020 1,028 1,042
BAJAJ-AUTO 5,002 5,044 5,115 5,156 5,227
BAJFINANCE 7,339 7,412 7,498 7,570 7,656
BAJAJFINSV 1,493 1,509 1,531 1,548 1,569
BPCL 348 352 355 359 362
BHARTIARTL 897 907 914 924 931
BRITANNIA 4,446 4,502 4,534 4,590 4,622
CIPLA 1,181 1,194 1,217 1,230 1,253
COALINDIA 274 277 282 285 290
DIVISLAB 3,694 3,721 3,759 3,786 3,824
DRREDDY 5,575 5,622 5,659 5,706 5,744
EICHERMOT 3,391 3,413 3,427 3,449 3,463
GRASIM 1,872 1,892 1,916 1,936 1,960
HCLTECH 1,248 1,263 1,274 1,289 1,300
HDFCBANK 1,521 1,537 1,553 1,569 1,585
HDFCLIFE 634 639 647 652 659
HEROMOTOCO 2,945 2,973 3,018 3,046 3,091
HINDALCO 471 475 481 485 491
HINDUNILVR 2,426 2,450 2,466 2,490 2,507
ICICIBANK 941 950 966 975 991
INDUSINDBK 1,383 1,397 1,420 1,435 1,458
INFY 1,466 1,484 1,494 1,512 1,523
ITC 439 443 449 453 458
JSW STEEL 764 771 781 789 799
KOTAKBANK 1,726 1,741 1,766 1,781 1,806
LT 2,824 2,862 2,884 2,921 2,943
LTIMINDTREE 5,293 5,343 5,406 5,456 5,519
M&M 1,524 1,554 1,605 1,635 1,686
MARUTI 10,140 10,212 10,279 10,351 10,417
NESTLEIND 22,198 22,366 22,518 22,686 22,838
NTPC 234 236 240 242 245
ONGC 185 186 187 188 189
POWERGRID 197 199 203 205 208
RELIANCE 2,342 2,353 2,372 2,383 2,402
SBILIFE 1,314 1,324 1,338 1,348 1,362
SBIN 571 580 593 602 615
SUNPHARMA 1,132 1,139 1,148 1,155 1,164
TCS 3,496 3,541 3,573 3,618 3,650
TATACONSUM
856 863 869 876 882
TATAMOTORS 613 620 631 638 649
TATASTEEL 126 127 128 129 130
TECHM 1,254 1,273 1,285 1,303 1,315
TITAN 3,268 3,286 3,304 3,323 3,341
ULTRACEMCO 8,195 8,254 8,346 8,405 8,497
UPL 614 620 627 633 640
WIPRO 420 424 428 432 436

www.angelone.in
Technical & Derivatives Report
September
2
2
, 2023
Technical and Derivatives Team:
Sameet Chavan Head Research – Technical & Derivatives sameet.chavan@angelone.in
Sneha Seth Senior Analyst – Technical & Derivatives sneha.seth@angelone.in
Rajesh Bhosale Analyst - Technical rajesh.bhosle@angelone.in
Osho Krishan Senior Analyst – Technical & Derivatives osho.krishan@angelone.in
Hitesh Rathi Analyst – Technical & Derivatives hitesh.rathi@angelone.in
Research Team Tel: 022 – 39357600 Website: www.angelone.in
For Technical Queries E-mail: technicalresearch-cso@angelone.in
For Derivatives Queries E-mail: derivatives.desk@angelone.in
DISCLAIMER
We, Angel One Limited (hereinafter referred to as “Angel”) a company duly incorporated under the provisions of the Companies Act, 1956 with
its registered office at 601, 6th Floor, Ackruti Star, Central Road, MIDC, Andheri East, Mumbai – 400093, CIN: (L67120MH1996PLC101709) and
duly registered as a member of National Stock Exchange of India Limited, Bombay Stock Exchange Limited, Metropolitan Stock Exchange Limited,
Multi Commodity Exchange of India Ltd and National Commodity & Derivatives Exchange Ltd. Angel One limited is a company engaged in
diversified financial services business including securities broking, DP services, distribution of Mutual Fund products. It is also registered as a
Depository Participant with CDSL and Portfolio Manager and Investment Adviser with SEBI. It also has registration with AMFI as a Mutual Fund
Distributor. Angel One Limited is a registered entity with SEBI for Research Analyst in terms of SEBI (Research Analyst) Regulations, 2014 vide
registration number INH000000164 and also registered with PFRDA as PoP ,Registration No.19092018. Angel Group does not have any joint
ventures or associates. Angel One Limited (formerly known as Angel Broking Limited) is the ultimate parent company of the Group. . Angel or its
associates has not been debarred/ suspended by SEBI or any other regulatory authority for accessing /dealing in securities Market.
AOL was merged with Angel Global Capital Private Limited and subsequently name of Angel Global Capital Private Limited was changed to Angel
Broking Private Limited (AOL) pursuant to scheme of Amalgamation sanctioned by the Hon'ble High Court of Judicature at Bombay by Orders
passed in Company Petition No 710 of 2011 and the approval granted by the Registrar of Companies. Further, name of Angel Broking Private
Limited again got changed to Angel Broking Limited (AOL) pursuant to fresh certificate of incorporation issued by Registrar of Companies (ROC)
dated June 28, 2018. Further name of Angel Broking name changed to Angel One Ltd pursuant to fresh certificate of incorporation issued by
Registrar of Companies (ROC) dated 23-09-21.
In case of any grievances please write to: support@angelone.in, Compliance Officer Details: Name : Hiren Thakkar, Tel No. –08657864228, Email
id - compliance@angelone.in
Registration granted by SEBI and certification from NISM in no way guarantee performance of the intermediary or provide any assurance of returns
to investors.
This document is solely for the personal information of the recipient, and must not be singularly used as the basis of any investment decision.
Nothing in this document should be construed as investment or financial advice. Each recipient of this document should make such investigations
as they deem necessary to arrive at an independent evaluation of an investment in the securities of the companies referred to in this document
(including the merits and risks involved), and should consult their own advisors to determine the merits and risks of such an investment.
Angel or its associates or research analyst or his relative may have actual/beneficial ownership of 1% or more in the securities of the subject
company at the end of the month immediately preceding the date of publication of the research report. Neither Angel or its associates nor
Research Analysts or his relative has any material conflict of interest at the time of publication of research report.
Angel or its associates might have received any compensation from the companies mentioned in the report during the period preceding twelve
months from the date of this report for services in respect of managing or co-managing public offerings, corporate finance, investment banking or
merchant banking, brokerage services or other advisory service in a merger or specific transaction in the normal course of business. Angel or its
associates did not receive any compensation or other benefits from the companies mentioned in the report or third party in connection with the
research report. Neither research entity nor research analyst has been engaged in market making activity for the subject company.

www.angelone.in
Technical & Derivatives Report
September
2
2
, 2023
*
Reports based on technical and derivative analysis center on studying charts of a stock's price movement, outstanding positions and trading
volume, as opposed to focusing on a company's fundamentals and, as such, may not match with a report on a company's fundamentals. Investors
are advised to refer the Fundamental and Technical Research Reports available on our website to evaluate the contrary view, if any.
The information in this document has been printed on the basis of publicly available information, internal data and other reliable sources believed
to be true, but we do not represent that it is accurate or complete and it should not be relied on as such, as this document is for general guidance
only. Angel One Limited or any of its affiliates/ group companies shall not be in any way responsible for any loss or damage that may arise to any
person from any inadvertent error in the information contained in this report. Angel One Limited does not warrant the accuracy, adequacy or
completeness of the service, information and materials and expressly disclaims liability for errors or omissions in the service, information and
materials. While Angel One Limited endeavours to update on a reasonable basis the information discussed in this material, there may be
regulatory, compliance, or other reasons that prevent us from doing so.
This document is being supplied to you solely for your information, and its contents, information or data may not be reproduced, redistributed or
passed on, directly or indirectly.
Neither Angel One Limited, nor its directors, employees or affiliates shall be liable for any loss or damage that may arise from or in connection
with the use of this information. Angel or its associates or Research Analyst or his relative might have financial interest in the subject company.
Research analyst has not served as an officer, director or employee of the subject company.
Investment in securities market are subject to market risks. Read all the related documents carefully before investing.
Any communication sent to clients on phone numbers or e-mail ids registered with the Trading Member is meant for client consumption and such
material should not be redistributed. Brokerage will not exceed SEBI prescribed limit. Any Information provided by us through any medium based
on our research or that of our affiliates or third parties or other external sources is subject to domestic and international market conditions and
we do not guarantee the availability or otherwise of any securities or other instruments and such Information is merely an estimation of certain
investments, and we have not and shall not be deemed to have assumed any responsibility for any such Information. You should seek independent
professional advice and/or tax advice regarding the suitability of any investment decision whether based on any Information provided by us
through the Site from inhouse research or third party reports or otherwise.
The report and information contained herein is strictly confidential and meant solely for the selected recipient and may not be altered in any way,
transmitted to, copied or distributed, in part or in whole, to any other person or to the media or reproduced in any form, without prior written
consent.
