SEPT 22, 2022
www.angelone.in
Technical & Derivatives Report
xOOOOOOOO
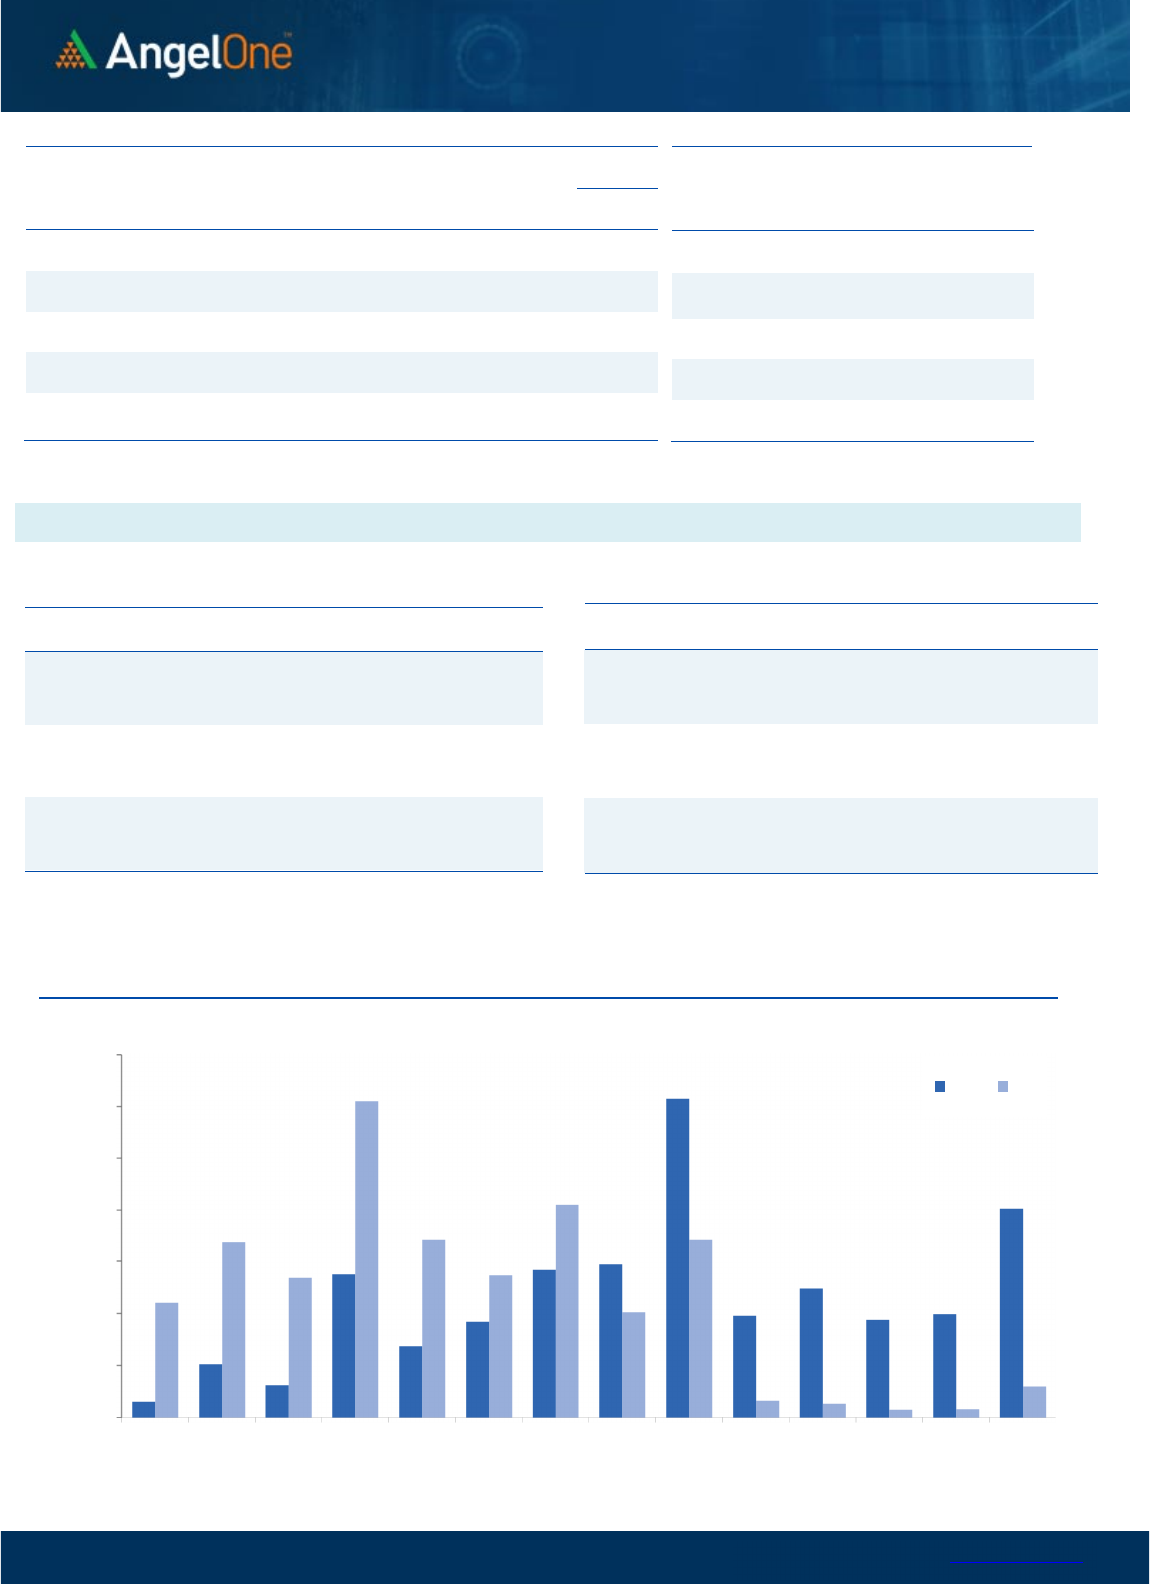
Nifty Bank Outlook (41468)
Ahead of the weekly expiry and key event of the FOMC meeting,
the bank index started on a muted note and then slipped lower
below the 40900 levels. During the second half, there was a modest
recovery to eventually reclaim 41200 levels on closing base and
end with a loss of 0.64%.
Despite a strong bounce back in the last two sessions, we
mentioned avoiding being complacent as we are still not out of
woods, and we are in a consolidation phase. Now if we
meticulously observe the daily chart, prices are trapped within the
big bullish candle left on the 14th September and the next
directional move can only be seen once the index breaks the
consolidation range. If we observe the intraday charts, we are
witnessing a Symmetrical Triangle formation with support placed
around 40800 - 40500 levels whereas, on the higher side, 41600 -
41840 remains a stiff resistance. Traders are advised, to keep a tab
on the mentioned levels and ideally should play the consolidation
by buying around the support and selling around the resistance
levels.
Key Levels
Support 1 – 40800 Resistance 1 – 41600
Support 2 – 40500 Resistance 2 – 41840
Exhibit 1: Nifty Daily Chart
Exhibit 2: Nifty Bank
Weekly
Chart
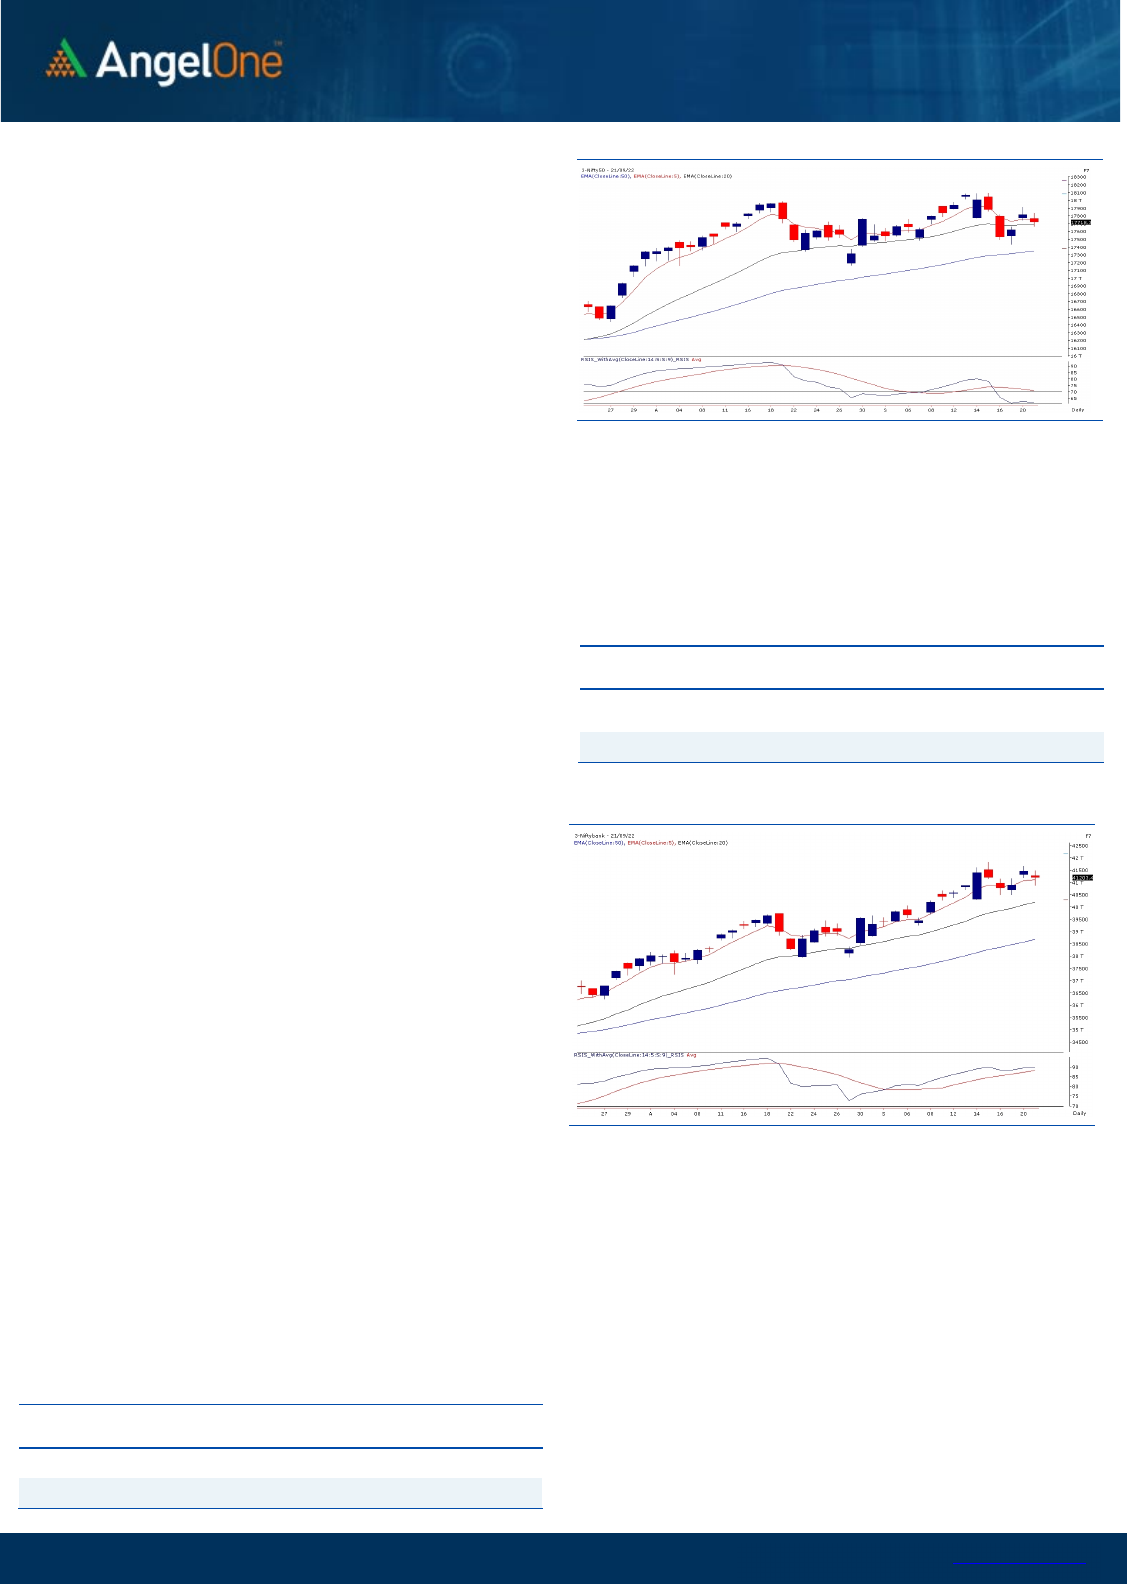
Sensex (59457) / Nifty (17718)
The Indian equity market started the day on a mild note amid mixed
global cues, wherein the benchmark index seemed a bit nervous
from the early trades. During the mid-session, an intense bout of
sell-off triggered, tumbling the index from the top towards 17660
odd zone. However, the bulls retaliated from the lows and made a
modest recovery to pare down some losses. With such a volatile
session, the Nifty concluded the day with a correction of 0.55
percent and settled a tad above the 17700 level.
Technically speaking, the index seems tentative at higher levels and
again slipped in the broad consolidation range. However, the
undertone is likely to remain in favor of the bulls, and as far as levels
are concerned, 17820-17860 zone still holds the sturdy wall for the
index and any persistent breakthrough could only open the gates
for further upside. On the flip side, 17540 - 17500 has seen some
strong resurgence in providing vital support and thus could be seen
as a crucial juncture to add longs for intraday dips, while the
sacrosanct support lies at the 17400 mark.
Going forward, the market is likely to remain volatile, mirroring
the global bourses. We reiterate to keep a close tab on the
mentioned levels. Also, one should continue with the stock-
specific approach, as even though the indices may not be doing
much, the individual stocks are not at all short of action. Hence
one should continue to identify such potential movers and trade
accordingly.
Key Levels
Support 1 – 17540 Resistance 1 – 17820
Support 2 – 17400 Resistance 2 – 17860

www.angelone.in
Technical & Derivatives Report
SEPT 22, 2022
View
We had a slightly nervous start and saw some selling
in the midst to plunge towards 16650. However, yet
another round of recovery was seen which got sold
into in the final hour to conclude the day tad above
17700.
FIIs were net sellers in the cash market segment to
the tune of Rs. 461 crores. Simultaneously, in Index
futures, they sold worth Rs. 1092 crores with rise in
open interest, indicating addition of bearish bets.
In the derivatives segment, we witnessed mixed open
interest activity in both the key indices. In the initial two
sessions, we observed a blend of short covering and
minor longs especially in the banking index followed
by some profit booking on Wednesday. Stronger hands
added some shorts yesterday after last two sessions
short covering. Now, their index futures Long Short
Ratio is at 35%. On the options front, we saw a good
amount of writing in the 17800 call strike since early
morning trade on Wednesday. On the contrary, a
decent amount of unwinding was seen in 17600 and
17650 put strike. Post the Fed meet outcome the
volatility is expected to remain on the higher side.
Hence, we would advocate traders to stay light on the
weekly expiry session.
Comments
The Nifty futures open interest has decreased by
0.34%. and Bank Nifty futures open interest has
decreased by 9.60% as the market closed at 17718.35.
The Nifty Sep future closed with a premium of 13.10
point against a premium of 5.75 point in the last
trading session. The Oct series closed at a premium
of 67.75 point.
The INDIA VIX increased from 18.79 to 19.32. At the
same time, the PCR-OI of Nifty has decreased from
1.15 to 0.95.
Few of the liquid counters where we have seen high
cost of carry are CUB, ABB, GAIL, INTELLECT and
OBEROIRLTY.
Historical Volatility
SCRIP HV
IDEA 81.26
IBULHSGFIN 72.97
RBLBANK 72.53
ZEEL 63.90
HINDCOPPER 62.70
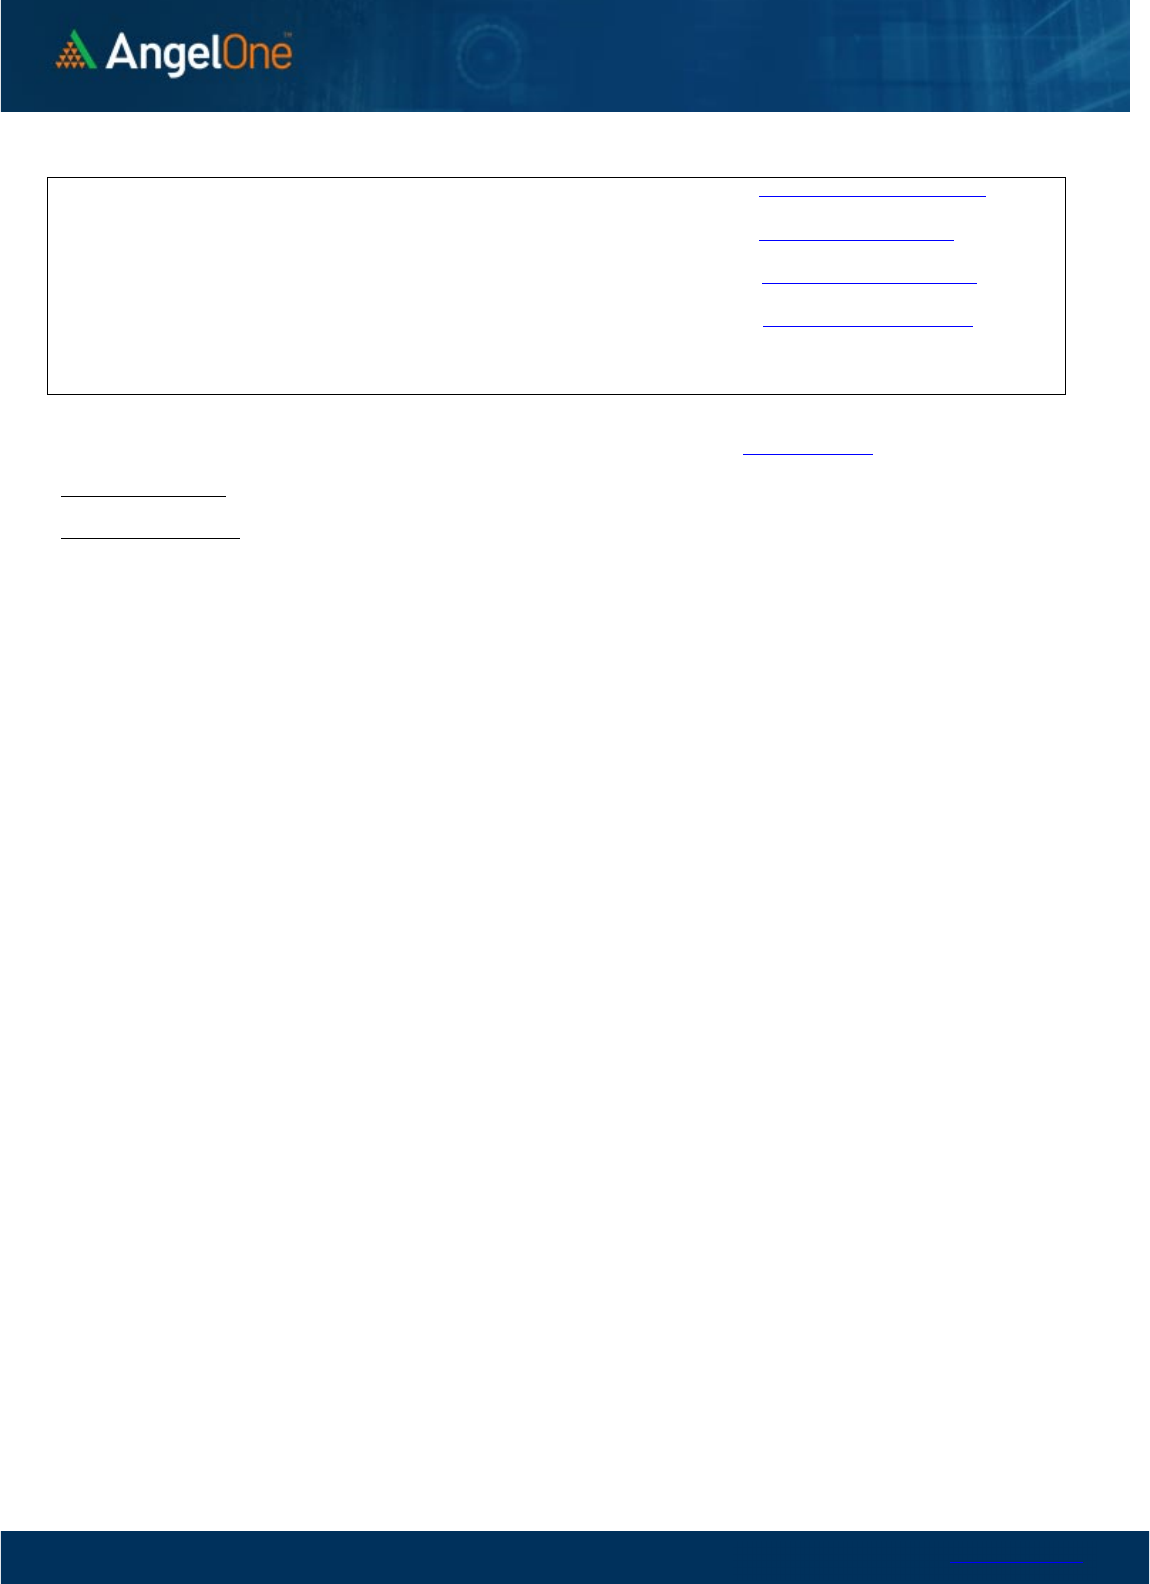
Nifty Vs OI
17200
17300
17400
17500
17600
17700
17800
17900
18000
18100
18200
11,500
12,000
12,500
13,000
13,500
14,000
14,500
15,000
9/6 9/8 9/12 9/14 9/16 9/20
Openinterest Nifty
OI Gainers
SCRIP OI
OI
CHG. (%)
PRICE
PRICE
CHG. (%)
CANFINHOME 5966025 80.61 565.35 -3.93
CIPLA 8585850 14.61 1092.30 4.83
GUJGASLTD 6558750 13.01 503.15 0.24
RAIN 13394500 12.13 181.20 4.47
JKCEMENT 452250 10.91 2909.45 3.18
HONAUT 15885 9.06 40709.90 0.51
LAURUSLABS 6722100 7.95 527.65 3.92
ALKEM 483200 7.09 3319.70 2.25
OI Losers
SCRIP OI
OI
CHG. (%)
PRICE
PRICE
CHG. (%)
ESCORTS 1864500 -15.90 2095.20 -0.25
HEROMOTOCO 2686500 -8.91 2771.55 2.77
INDIACEM 14421700 -8.42 283.45 -2.11
MCX 3313200 -6.21 1284.25 5.02
IRCTC 13767250 -6.10 706.15 2.80
APOLLOTYRE 14210000 -5.78 288.20 -0.33
IPCALAB 1600300 -5.53 871.45 1.72
HINDALCO 29055100 -5.23 421.45 2.32
Put-Call Ratio
SCRIP PCR (OI) PCR (VOL)
NIFTY 1.15 0.90
BANKNIFTY 1.07 0.85
RELIANCE 0.47 0.43
ICICIBANK 0.71 0.61
INFY 0.37 0.39
www.angelone.in
Technical & Derivatives Report
SEPT 22, 2022
Note: Above mentioned Bullish or Bearish Spreads in Nifty (Sep Series) are given as an information and not as a recommendation.
Nifty Spot =
1
7
,
718.35
FII Statistics for
September
2
1
, 2022
Detail Buy
Contracts
Open
Interest
Value
(in Cr.)
Sell
Net
CHANGE
INDEX
FUTURES
2399.84 3492.24 (1092.40) 119225 11186.08 7.65
INDEX
OPTIONS
905676.99 902745.75 2931.24
1537569 142587.38 10.69
STOCK
FUTURES
11386.51 12839.22 (1452.71) 2161364 151594.35 0.03
STOCK
OPTIONS
11318.84 11481.90 (163.06) 205449 14878.05 (0.17)
Total 930782.18
930559.11
223.07
4023607
320245.86
4.07
Turnover on
September
2
1
, 2022
Instrument
No. of
Contracts
Turnover
( in Cr. )
Change
(%)
Index
Futures
385227 36790.85 5.46
Index
Options
128230586
12436966.03
16.51
Stock
Futures
894379 68109.64 -0.21
Stock
Options
4169435 338167.77 -0.34
Total
4,169,435
338167.77 15.86
Bull-Call Spreads
Action Strike Price Risk Reward BEP
Buy
17800 221.65
51.10
48.90
17851.10
Sell
17900 170.55
Buy
17800 221.65
95.40
104.60
17895.40
Sell
18000 126.25
Buy
17900 170.55
44.30 55.70 17944.30
Sell 18000 126.25
Bear
-
Put
Spreads
Action Strike Price Risk Reward BEP
Buy 17800 197.50
42.75
57.25
17757.25
Sell
17700 154.75
Buy 17800 197.50
75.40
124.60
17724.60
Sell 17600 122.10
Buy
17700 154.75
32.65 67.35 17667.35
Sell 17600 122.10
Nifty Put
-
Call Analysis
,0
500,000
1000,000
1500,000
2000,000
2500,000
3000,000
3500,000
17200 17300 17400 17500 17600 17700 17800 17900 18000 18100 18200 18300 18400 18500
Call Put

www.angelone.in
Technical & Derivatives Report
SEPT 22, 2022
`
Daily Pivot Levels for Nifty Constituents
Scrips
S2
S1
PIVOT
R1 R2
ADANIPORTS
883
908
942
967
1,001
APOLLOHOSP 4,497 4,551
4,610
4,664 4,722
ASIANPAINT
3,299
3,328
3,376
3,405
3,453
AXISBANK 796 801
809
814 821
BAJAJ-AUTO
3,671
3,701
3,754 3,784 3,837
BAJFINANCE
7,522
7,606
7,671
7,755
7,820
BAJAJFINSV
1,758
1,780
1,800
1,822
1,842
BPCL 315 318
321
323
326
BHARTIARTL 767 774
785
792
803
BRITANNIA
3,579
3,672
3,731
3,824
3,883
CIPLA 1,041 1,056
1,079
1,093
1,116
COALINDIA
225
228
230
234
236
DIVISLAB
3,519
3,546
3,595
3,622
3,671
DRREDDY 4,049 4,101
4,185
4,237
4,321
EICHERMOT 3,598 3,640
3,714
3,756
3,829
GRASIM
1,687
1,703
1,726
1,743
1,766
HCLTECH
890
895
905
910
919
HDFCBANK
1,498
1,508
1,515
1,525
1,531
HDFCLIFE
542
547
554
559
567
HDFC
2,416
2,438
2,462 2,484
2,508
HEROMOTOCO 2,744 2,760
2,784
2,801
2,824
HINDALCO
402
407
415 420
428
HINDUNILVR 2,550 2,587
2,617
2,654
2,684
ICICIBANK
901
908
913
920
924
INDUSINDBK 1,194 1,209
1,237
1,252
1,280
INFY
1,358
1,368
1,378
1,388
1,399
ITC
331
336
341 346
350
JSW STEEL 676 680
686
691
697
KOTAKBANK 1,871 1,895
1,922
1,946
1,974
LT
1,856
1,876
1,911
1,931
1,966
M&M
1,278
1,293
1,308
1,322
1,337
MARUTI
9,099
9,174
9,286 9,360
9,472
NESTLEIND
18,412
18,531
18,710
18,829
19,008
NTPC
166
167
170
171 174
ONGC 128 130
131
133
135
POWERGRID
219
223
229
233
239
RELIANCE 2,475 2,492
2,513
2,530
2,551
SBILIFE
1,287
1,297
1,308
1,317
1,328
SHREECEM 20,803 21,413
22,411
23,022
24,019
SBIN
559
564
571
576
583
SUNPHARMA
890
898
910
918
930
TCS
2,970
2,986
3,014
3,029 3,057
TATACONSUM
792 798
804
811 817
TATAMOTORS 419 423
430
434
440
TATASTEEL 102 103
105
106
108
TECHM
1,038
1,049
1,058
1,069
1,078
TITAN
2,631
2,649
2,674
2,692
2,718
ULTRACEMCO
6,145
6,229
6,381
6,466
6,617
UPL 696 707
716
726
735
WIPRO 396 398
402
405
408
www.angelone.in
Technical & Derivatives Report
SEPT 22, 2022
*
Technical and Derivatives Team:
Sameet Chavan Chief Analyst – Technical & Derivatives sameet.chavan@angelone.in
Sneha Seth Senior Analyst – Technical & Derivatives sneha.seth@angelone.in
Rajesh Bhosale Technical Analyst rajesh.bhosle@angelone.in
Osho Krishan Senior Analyst – Technical & Derivatives osho.krishan@angelone.in
Research Team Tel: 022 – 39357600 Website: www.angelone.in
For Technical Queries E-mail: technicalresearch-cso@angelone.in
For Derivatives Queries E-mail: derivatives.desk@angelone.in
DISCLAIMER
Angel One Limited (hereinafter referred to as “Angel”) is a registered Member of National Stock Exchange of India Limited, Bombay
Stock Exchange Limited and Metropolitan Stock Exchange Limited. It is also registered as a Depository Participant with CDSL and
Portfolio Manager and investment advisor with SEBI. It also has registration with AMFI as a Mutual Fund Distributor. Angel One
Limited is a registered entity with SEBI for Research Analyst in terms of SEBI (Research Analyst) Regulations, 2014 vide registration
number INH000000164. Angel or its associates has not been debarred/ suspended by SEBI or any other regulatory authority for
accessing /dealing in securities Market.
This document is solely for the personal information of the recipient, and must not be singularly used as the basis of any investment
decision. Nothing in this document should be construed as investment or financial advice. Each recipient of this document should
make such investigations as they deem necessary to arrive at an independent evaluation of an investment in the securities of the
companies referred to in this document (including the merits and risks involved), and should consult their own advisors to determine
the merits and risks of such an investment.
Angel or its associates or research analyst or his relative may have actual/beneficial ownership of 1% or more in the securities of
the subject company at the end of the month immediately preceding the date of publication of the research report. Neither Angel or
its associates nor Research Analysts or his relative has any material conflict of interest at the time of publication of research report.
Angel or its associates might have received any compensation from the companies mentioned in the report during the period
preceding twelve months from the date of this report for services in respect of managing or co-managing public offerings, corporate
finance, investment banking or merchant banking, brokerage services or other advisory service in a merger or specific transaction
in the normal course of business. Angel or its associates did not receive any compensation or other benefits from the companies
mentioned in the report or third party in connection with the research report. Neither Angel nor its research analyst entity has been
engaged in market making activity for the subject company.
Reports based on technical and derivative analysis center on studying charts of a stock's price movement, outstanding positions and
trading volume, as opposed to focusing on a company's fundamentals and, as such, may not match with a report on a company's
fundamentals. Investors are advised to refer the Fundamental and Technical Research Reports available on our website to evaluate
the contrary view, if any.
The information in this document has been printed on the basis of publicly available information, internal data and other reliable
sources believed to be true, but we do not represent that it is accurate or complete and it should not be relied on as such, as this
document is for general guidance only. Angel One Limited or any of its affiliates/ group companies shall not be in any way responsible
for any loss or damage that may arise to any person from any inadvertent error in the information contained in this report. Angel One
Limited has not independently verified all the information contained within this document. Accordingly, we cannot testify, nor make
any representation or warranty, express or implied, to the accuracy, contents or data contained within this document. While Angel
One Limited endeavors to update on a reasonable basis the information discussed in this material, there may be regulatory,
compliance, or other reasons that prevent us from doing so.
This document is being supplied to you solely for your information, and its contents, information or data may not be reproduced,
redistributed or passed on, directly or indirectly.
Neither Angel One Limited, nor its directors, employees or affiliates shall be liable for any loss or damage that may arise from or in
connection with the use of this information. Angel or its associates or Research Analyst or his relative might have financial interest
in the subject company. Research analyst has not served as an officer, director or employee of the subject company.
