February 22, 2022
www.angelone.in
Technical & Derivatives Report
Nifty
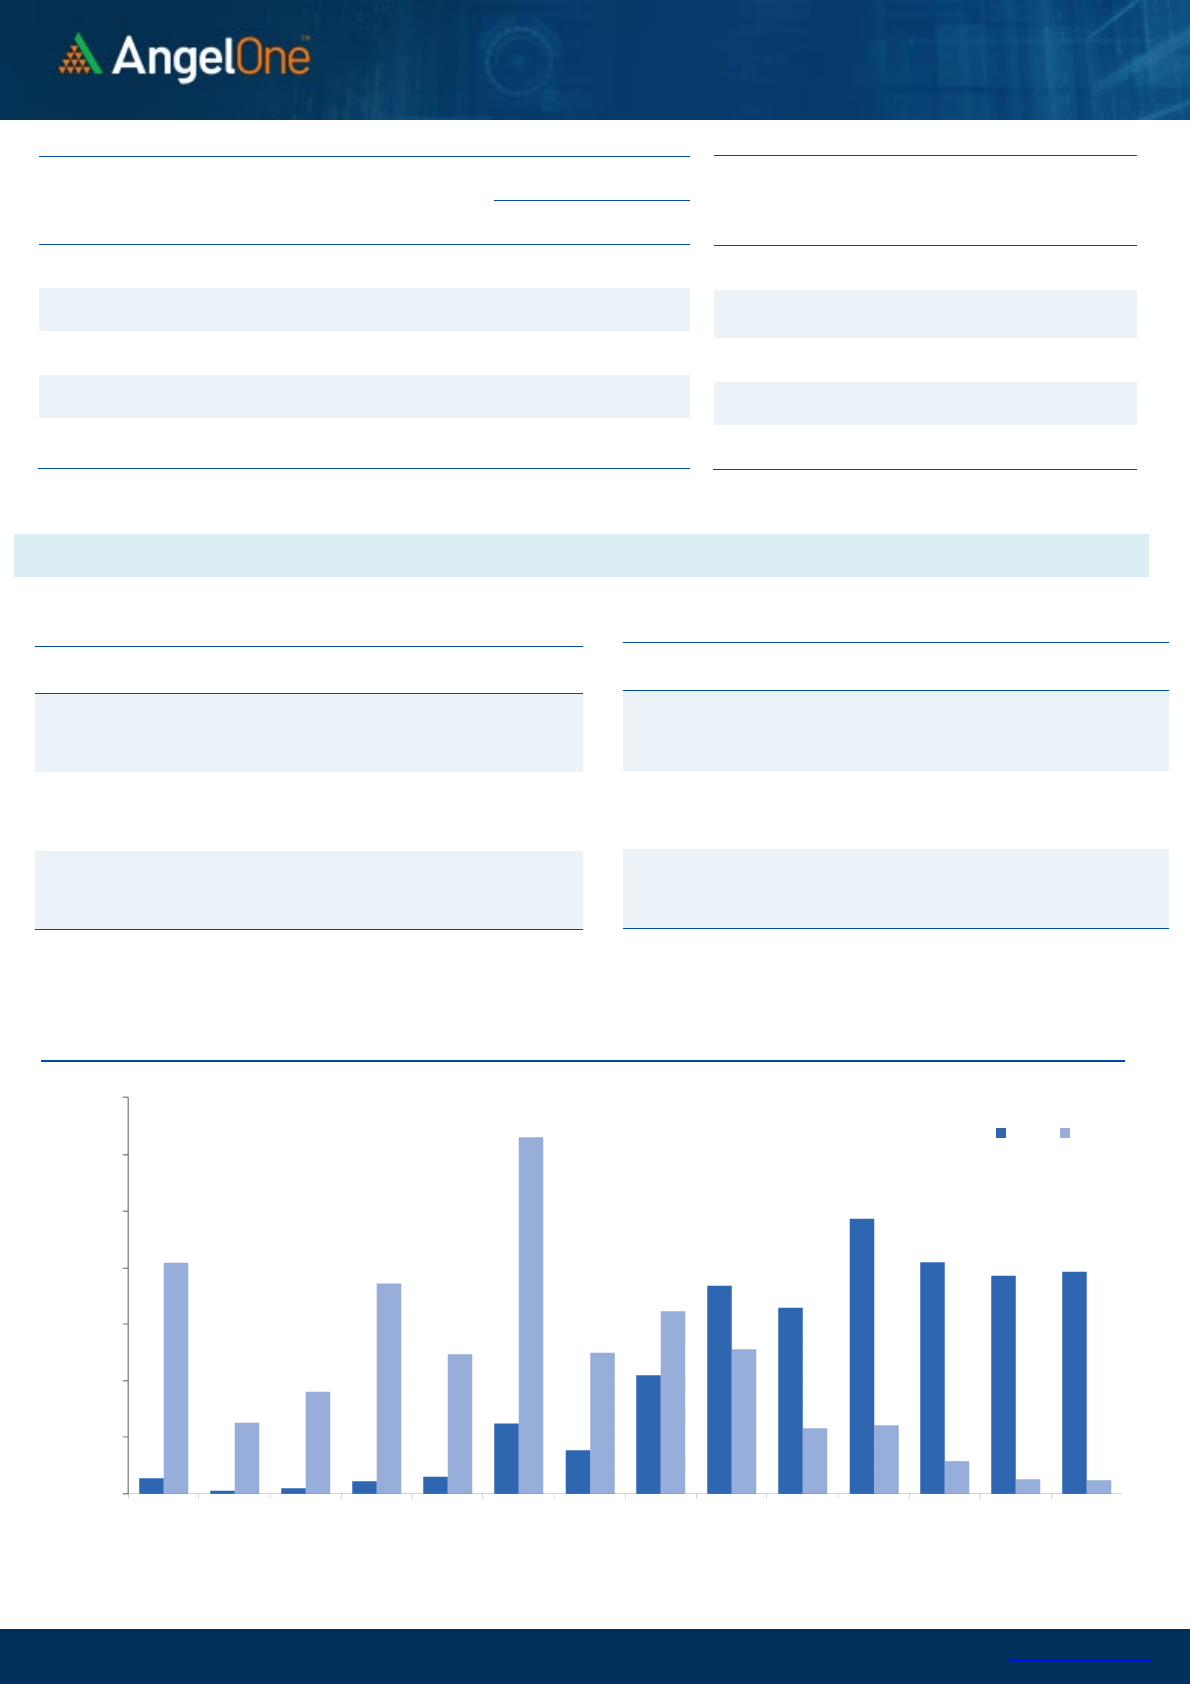
Bank Outlook
-
(37686)
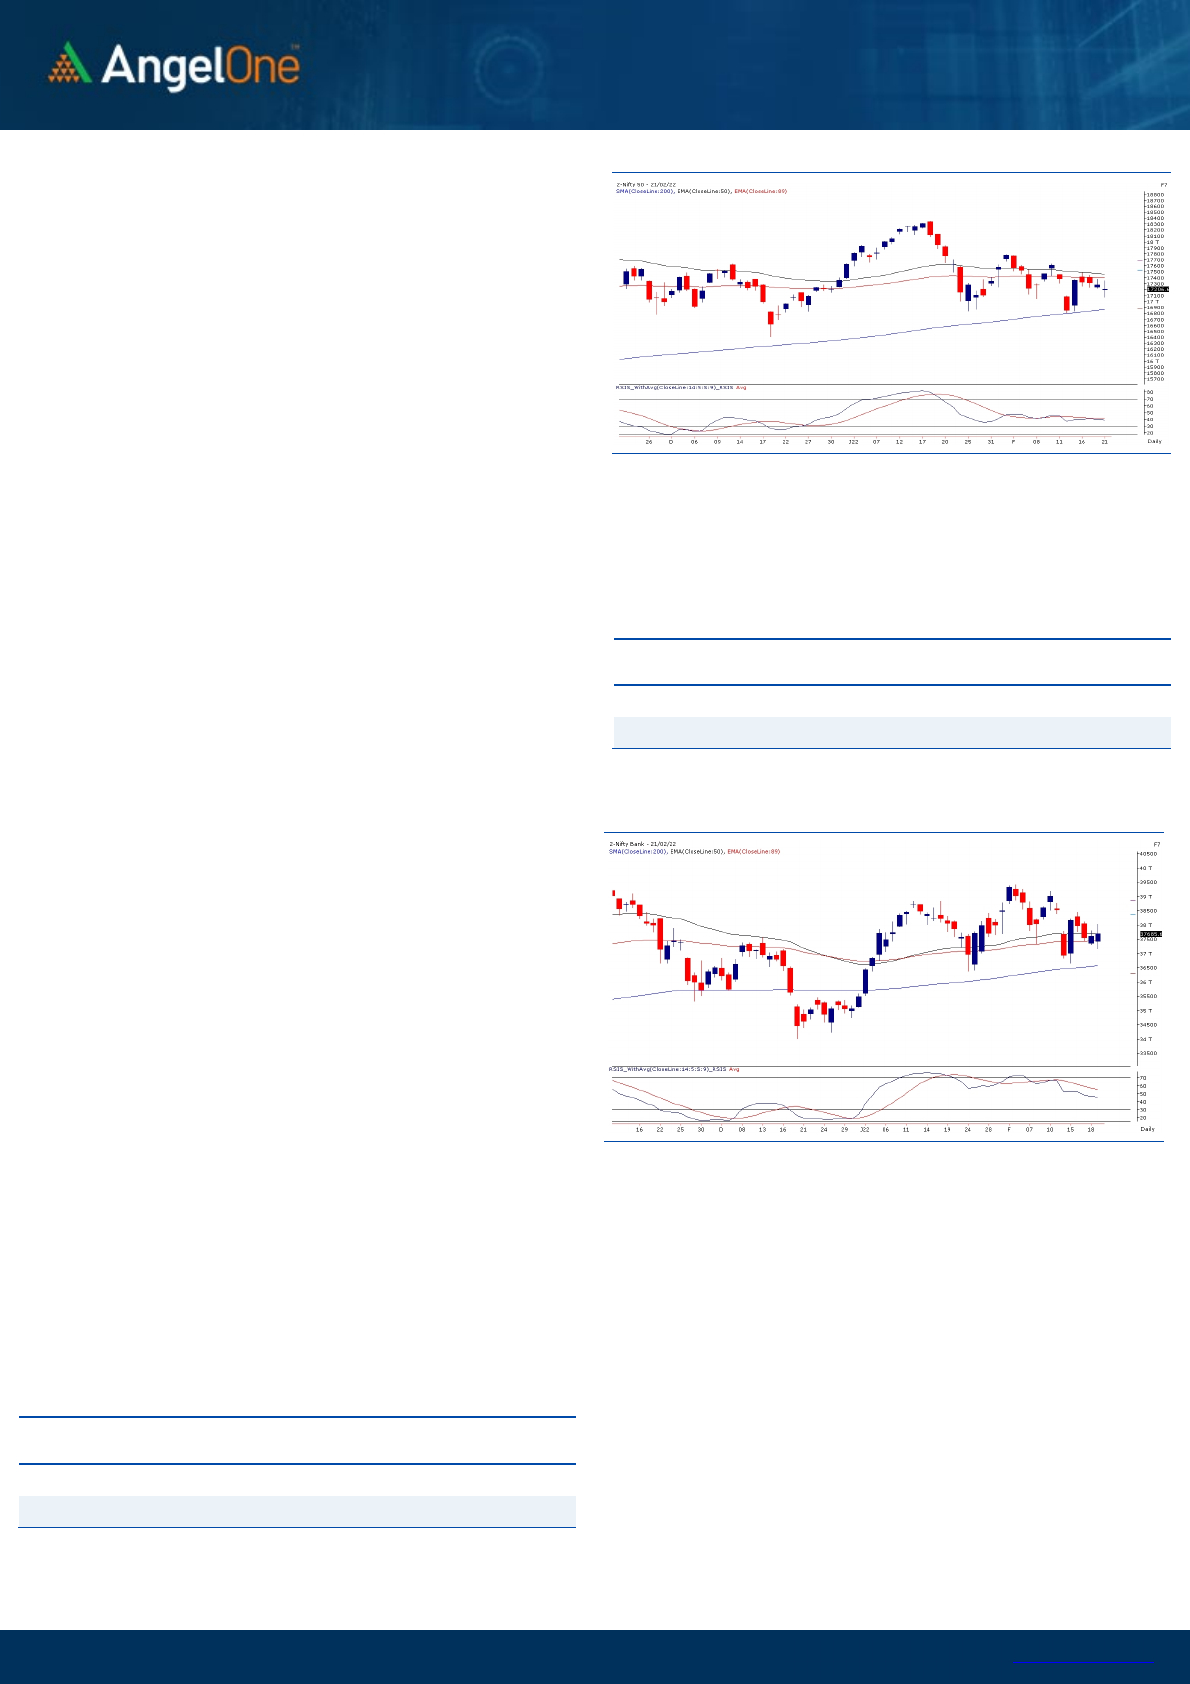
An action-packed session was seen in the banking space,
wherein the bulls took charge past the initial hiccups and helped
the banking index to settle in green. The Bank Nifty index
outperformed the benchmark index to conclude the day in green
with mere gains of 0.23 percent at 37686 levels.
On technical aspects, the 37000 mark has proved to be the
strong demand zone from where the bulls reign, and till the
index sustains above the same, the sentiments are expected to
remain on the upward trend. However, the significant indicators
have not shown any firm bullish reversal indication, and hence
a cautious approach is advised in the present scenario. In
contrast, a closure above 38200 could affirm the strength in
market sentiments. Therefore, for immediate term 37000-
38200 is the primary range for the index, and any decisive
breach could dictate the next set of the rally in the market. Going
forward, the volatility index is placed near 23 levels signifying
the rise in uncertainty. Thus, looking at the data and concerns
over global bourses, avoiding any aggressive overnight bets and
tracking the global market is advisable.
Key Levels
Support 1 – 37000 Resistance 1 – 38000
Support 2 – 36800 Resistance 2 – 38200
Exhibit 1: Nifty Daily Chart
Exhibit 2: Nifty Bank Daily Chart
Sensex (57684) / Nifty (17207)
The Indian equity market had a nervous start to the week
tracking the weakness in global bourses. However, post the
initial hiccups, bulls managed to minimize the damage, which
resulted in a decent recovery around the mid-session.
Eventually, ensuing the showdown, the Nifty50 index concluded
the day marginally in favor of the bears with a Doji look-alike
candle formation, a tad above 17200.
The support base around 17100 – 17000 once again proved to be
the sacrosanct zone, from where the market has witnessed a
substantial pullback indicating the sentiments of our domestic
participants but failed to endure the highs. A firm tug of war was
seen in yesterday’s trade among the various sectors in which
bears have taken the show in the latter part. On the technical
front, Nifty remains in the slender range showcasing
indecisiveness due to the external global scenarios. As far as
levels are concerned, a strong base of 17100 – 17000 is expected
to provide the cushion. While on the higher side, the immediate
resistance could be seen at 17500.
Looking at the range
-
bound movement and technical setup,
the index is expected to remain in the mentioned slender
range until any decisive breach on either side happens. The
global market would play a vital role in any decisive breach
and until then, aggressive overnight bets should strictly be
avoided.
Key Levels
Support 1 – 17100 Resistance 1 – 17450
Support 2 – 17000 Resistance 2 – 17500

www.angelone.in
Technical & Derivatives Report
February 22, 2022
View
Nifty started the week on a negative note and then
witnessed swings on both sides. Eventually, it ended
with a loss of 0.40% tad above 17200.
FIIs were net sellers in the cash market segment to
the tune of Rs. 2262 crores. In Index futures, they sold
worth Rs. 217 crores with a fall in open interest
indicating long unwinding in yesterday’s session.
Yesterday, we witnessed long unwinding in Nifty
futures whereas the Bank Nifty relatively
outperformed, and long formations were seen. FII’s
remain sellers in the cash segment whereas in Index
futures they unwound some of their long positions.
Highest open interest build-up in out of the money
CALL options is seen at 18000 strike however we
continue to see 17500 as immediate resistance where
a decent build-up can be seen in call options. On the
flip side, the highest build-up is seen at 17000 PUT
indicating a support level for the monthly expiry.
Traders should continue to focus on stock-specific
trades however aggressive overnight positions
should be avoided.
Comments
The Nifty futures open interest has decreased by 1.50%.
and BANK Nifty futures open interest has increased by
3.56% as market closed at 17206.65 levels.
The Nifty February future closed with a discount of 1.45
point against a premium of 1.10 point in last trading
session. The March series closed at a premium of 46.85
point.
The INDIA VIX increased from 22.16 to 22.90. At the
same time, the PCR-OI of Nifty has decreased from 1.10
to 1.06.
Few of the liquid counters where we have seen high
cost of carry are LAURUSLABS, PAGEIND,
BALRAMCHIN, GRANULES AND M&MFIN.
Historical Volatility
SCRIP HV
IBULHSGFIN
75.24
BHEL
62.72
GAIL
39.56
ABCAPITAL
52.00
HAL
42.16
Nifty Vs OI
16400
16600
16800
17000
17200
17400
17600
17800
,0
2,000
4,000
6,000
8,000
10,000
12,000
14,000
1-31 2-2 2-4 2-8 2-10 2-14 2-16 2-18
Openinterest Nifty
OI Gainers
SCRIP OI
OI
CHG. (%)
PRICE
PRICE
CHG. (%)
IDEA
912240000 17.48 11.25 5.63
INDIAMART
530175 9.36 4757.65 -0.37
CROMPTON
3521100 9.17 392.40 0.09
INTELLECT
495000 8.37 670.25 -1.60
LTTS
857000 8.26 4365.75 -1.85
INDHOTEL
19888790 7.06 204.95 -1.14
JKCEMENT
354025 6.53 2911.05 -2.33
RECLTD
38544000 6.45 125.50 -0.63
OI Losers
SCRIP OI
OI
CHG. (%)
PRICE
PRICE
CHG. (%)
AMBUJACEM
18849000 -16.92 338.55 0.10
RAMCOCEM
1956700 -14.68 823.95 -1.21
LALPATHLAB
893625 -10.20 2684.40 -1.72
IBULHSGFIN
34977300 -10.16 166.35 -10.13
GUJGASLTD
2580000 -8.91 660.05 0.14
ONGC
36806000 -8.41 163.40 -1.74
COFORGE
758500 -8.19 4412.90 2.23
UBL
943950 -7.98 1525.35 -1.37
Put-Call Ratio
SCRIP PCR (OI) PCR (VOL)
NIFTY
1.06 0.83
BANKNIFTY
0.99 0.89
RELIANCE
0.56 0.55
ICICIBANK
0.50 0.53
INFY
0.43 0.46
www.angelone.in
Technical & Derivatives Report
February 22, 2022
Note: Above mentioned Bullish or Bearish Spreads in Nifty (February Series) are given as an information and not as a recommendation.
Nifty Spot = 17206.70
FII Statistics for
February
21
, 2021
Detail Buy
Net Contracts
Open Interest
Sell
Value
(in Cr.)
Change
INDEX
FUTURES
5044.32 5261.05 (216.73) 192948 16971.99 (1.48)
INDEX
OPTIONS
556012.72 555167.15 845.57
1513617 133829.35 5.65
STOCK
FUTURES
41477.24 40166.55 1310.69
1958392 132729.18 0.73
STOCK
OPTIONS
17456.89 17256.02 200.87
319329 22849.27 (1.92)
Total
619991.17
617850.77
2140.40
3984286
306379.79
2.21
Turnover
on
February
21
, 2021
Instrument
No. of
Contracts
Turnover
( in Cr. )
Change
(%)
Index Futures
543647 48777.49 35.31
Index Options
71169723 6467080.33 52.38
Stock Futures
1863974 126753.90 68.96
Stock Options
3492830 253267.72 17.11
Total
7,70,70,174
6895879.44 50.85
Bull
-
Call Spreads
Action Strike Price Risk Reward BEP
Buy
17200 153.85
49.25 50.75 17249.25
Sell
17300 104.60
Buy
17200 153.85
87.70 112.30 17287.70
Sell
17400 66.15
Buy
17300 104.60
38.45 61.55 17338.45
Sell
17400 66.15
Bear
-
Put Spreads
Action Strike Price Risk Reward BEP
Buy
17200 147.35
39.15 60.85 17160.85
Sell
17100 108.20
Buy
17200 147.35
68.80 131.20 17131.20
Sell
17000 78.55
Buy
17100 108.20
29.65 70.35 17070.35
Sell
17000 78.55
Nifty Put
-
Call Analysis
,0
1000,000
2000,000
3000,000
4000,000
5000,000
6000,000
7000,000
16500 16600 16700 16800 16900 17000 17100 17200 17300 17400 17500 17600 17700 17800
Call Put

www.angelone.in
Technical & Derivatives Report
February 22, 2022
`
Daily Pivot Levels for Nifty Constituents
Scrips
S2
S1
PIVOT
R1
R2
ADANIPORTS 699 705
716 722 733
ASIANPAINT 3,170 3,211
3,245 3,285 3,319
AXISBANK 767 778
787 798 808
BAJAJ-AUTO 3,524 3,552
3,595 3,623 3,666
BAJFINANCE 6,830 6,918
6,999 7,088 7,169
BAJAJFINSV 15,552 15,782
16,010 16,240 16,468
BPCL 361 365
369 373 377
BHARTIARTL 696 703
710 717 723
BRITANNIA 3,398 3,437
3,468 3,507 3,538
CIPLA 888 898
906 915 923
COALINDIA 158 160
162 163 165
DIVISLAB 4,190 4,224
4,285 4,319 4,379
DRREDDY 4,198 4,248
4,333 4,382 4,467
EICHERMOT 2,645 2,672
2,695 2,722 2,746
GRASIM 1,656 1,674
1,706 1,724 1,755
HCLTECH 1,142 1,153
1,161 1,173 1,181
HDFCBANK 1,481 1,502
1,516 1,537 1,551
HDFCLIFE 570 576
583 589 596
HDFC 2,394 2,415
2,431 2,453 2,469
HEROMOTOCO 2,652 2,683
2,715 2,746 2,778
HINDALCO 500 506
517 524 535
HINDUNILVR 2,275 2,285
2,295 2,304 2,314
ICICIBANK 730 742
752 765 775
IOC 117 118
120 121 122
INDUSINDBK 935 944
958 967 981
INFY 1,674 1,702
1,720 1,748 1,766
ITC 215 216
219 220 223
JSW STEEL 613 618
626 632 640
KOTAKBANK 1,778 1,802
1,827 1,852 1,876
LT 1,831 1,847
1,866 1,882 1,901
M&M 823 832
841 850 860
MARUTI 8,313 8,463
8,594 8,743 8,874
NESTLEIND 17,695 17,901
18,030 18,236 18,365
NTPC 129 131
132 134 135
ONGC 160 162
165 166 169
POWERGRID 194 196
198 200 201
RELIANCE 2,354 2,377
2,407 2,430 2,460
SBILIFE 1,109 1,122
1,136 1,149 1,164
SHREECEM 23,631 24,155
24,574 25,098 25,517
SBIN 498 505
511 518 524
SUNPHARMA 825 834
849 859 874
TCS 3,629 3,674
3,751 3,796 3,873
TATACONSUM
696 705
713 722 730
TATAMOTORS 479 487
494 501 508
TATASTEEL 1,158 1,170
1,186 1,198 1,214
TECHM 1,393 1,406
1,423 1,435 1,453
TITAN 2,374 2,414
2,451 2,491 2,528
ULTRACEMCO 6,717 6,765
6,839 6,887 6,961
UPL 687 696
710 719 733
WIPRO 549 560
566 577 584

www.angelone.in
Technical & Derivatives Report
February 22, 2022
*
Technical and Derivatives Team:
Sameet Chavan
Chief Analyst
–
Technical & Derivatives
sameet.chavan@angelone.in
Sneha Seth Derivatives Analyst sneha.seth@angelone.in
Rajesh Bhosale Technical Analyst rajesh.bhosle@angelone.in
Osho Krishan Senior Analyst – Technical & Derivatives osho.krishan@angelone.in
Research Team Tel: 022 – 39357600 (Extn. 6844) Website: www.angelone.in
For Technical Queries E-mail: technicalresearch-cso@angelone.in
For Derivatives Queries E-mail: derivatives.desk@angelone.in
DISCLAIMER
Angel One Limited (hereinafter referred to as “Angel”) is a registered Member of National Stock Exchange of India Limited, Bombay
Stock Exchange Limited and Metropolitan Stock Exchange Limited. It is also registered as a Depository Participant with CDSL and
Portfolio Manager and investment advisor with SEBI. It also has registration with AMFI as a Mutual Fund Distributor. Angel One
Limited is a registered entity with SEBI for Research Analyst in terms of SEBI (Research Analyst) Regulations, 2014 vide registration
number INH000000164. Angel or its associates has not been debarred/ suspended by SEBI or any other regulatory authority for
accessing /dealing in securities Market.
This document is solely for the personal information of the recipient, and must not be singularly used as the basis of any investment
decision. Nothing in this document should be construed as investment or financial advice. Each recipient of this document should
make such investigations as they deem necessary to arrive at an independent evaluation of an investment in the securities of the
companies referred to in this document (including the merits and risks involved), and should consult their own advisors to determine
the merits and risks of such an investment.
Angel or its associates or research analyst or his relative may have actual/beneficial ownership of 1% or more in the securities of
the subject company at the end of the month immediately preceding the date of publication of the research report. Neither Angel or
its associates nor Research Analysts or his relative has any material conflict of interest at the time of publication of research report.
Angel or its associates might have received any compensation from the companies mentioned in the report during the period
preceding twelve months from the date of this report for services in respect of managing or co-managing public offerings, corporate
finance, investment banking or merchant banking, brokerage services or other advisory service in a merger or specific transaction
in the normal course of business. Angel or its associates did not receive any compensation or other benefits from the companies
mentioned in the report or third party in connection with the research report. Neither Angel nor its research analyst entity has been
engaged in market making activity for the subject company.
Reports based on technical and derivative analysis center on studying charts of a stock's price movement, outstanding positions and
trading volume, as opposed to focusing on a company's fundamentals and, as such, may not match with a report on a company's
fundamentals. Investors are advised to refer the Fundamental and Technical Research Reports available on our website to evaluate
the contrary view, if any.
The information in this document has been printed on the basis of publicly available information, internal data and other reliable
sources believed to be true, but we do not represent that it is accurate or complete and it should not be relied on as such, as this
document is for general guidance only. Angel One Limited or any of its affiliates/ group companies shall not be in any way responsible
for any loss or damage that may arise to any person from any inadvertent error in the information contained in this report. Angel One
Limited has not independently verified all the information contained within this document. Accordingly, we cannot testify, nor make
any representation or warranty, express or implied, to the accuracy, contents or data contained within this document. While Angel
One Limited endeavors to update on a reasonable basis the information discussed in this material, there may be regulatory,
compliance, or other reasons that prevent us from doing so.
This document is being supplied to you solely for your information, and its contents, information or data may not be reproduced,
redistributed or passed on, directly or indirectly.
Neither Angel One Limited, nor its directors, employees or affiliates shall be liable for any loss or damage that may arise from or in
connection with the use of this information. Angel or its associates or Research Analyst or his relative might have financial interest
in the subject company. Research analyst has not served as an officer, director or employee of the subject company.
