DEC 21, 2022
www.angelone.in
Technical & Derivatives Report
xOOOOOOOO
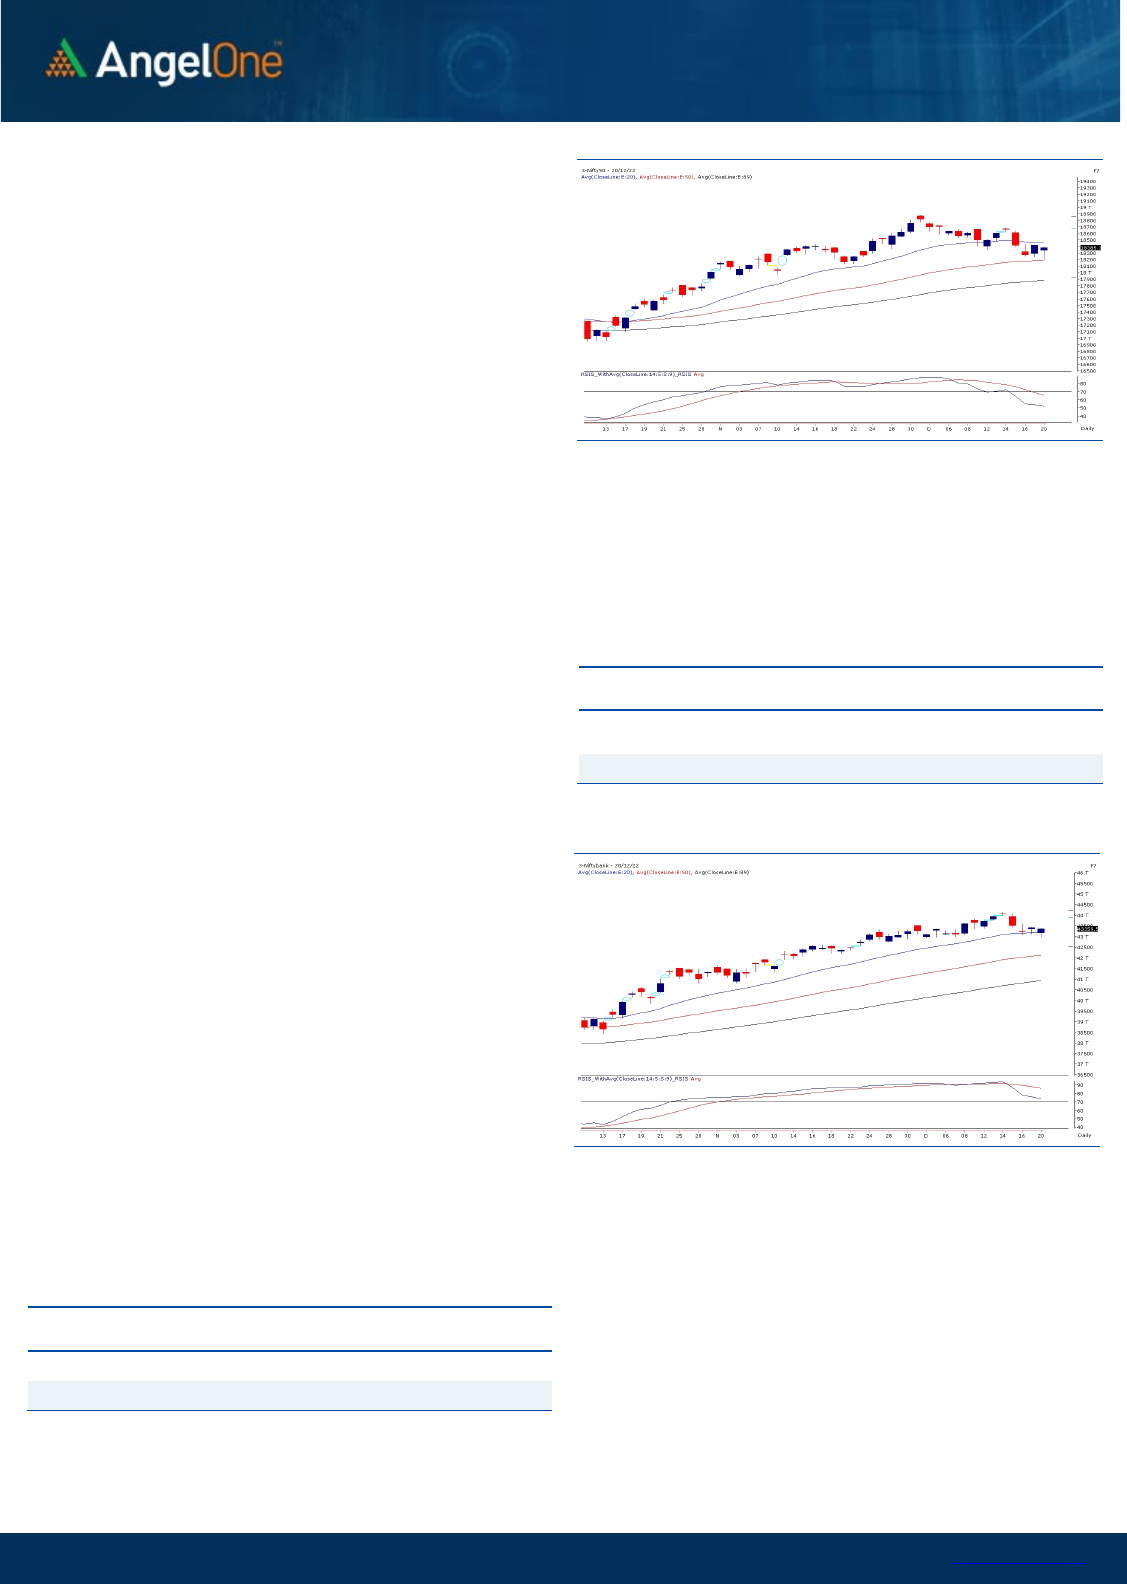
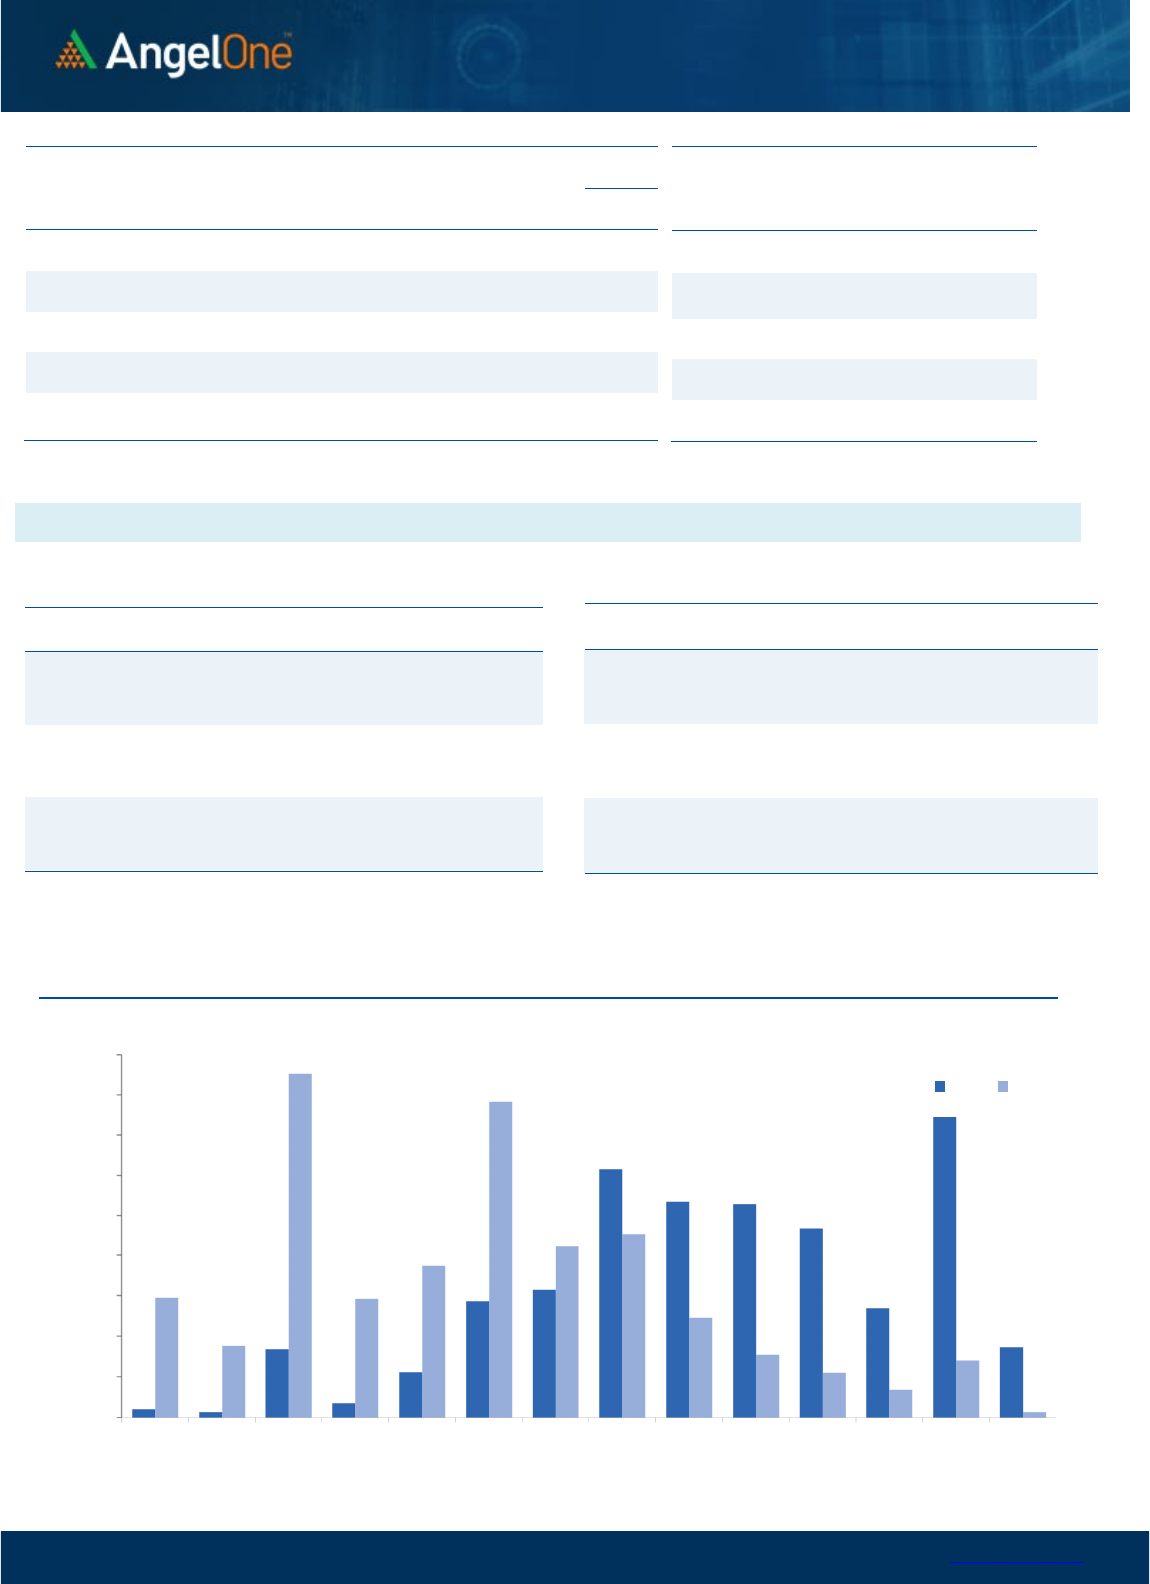
Nifty Bank Outlook (43359)
Bank Nifty as well started on a weak note and as the day progressed
the selling got intensified to even slip below the 43000 level.
However, during the penultimate hours, buying was seen at the
lower levels which triggered recovery to regain all the lost ground.
The bank index ended flat but around the highest point for the day.
Technically, not much has changed, but the last two sessions of
buying from lower levels augur well for the bulls. It seems 20EMA
is acting as a support and as long it holds, traders should maintain
a positive stance and use dips to enter long positions. Hence, 42900
- 43000 remains a strong buying zone. On the flip side, 43600 -
43800 remains a stiff hurdle, and as long prices don't break above
it, we may see some sideways move in this high beta index.
Key Levels
Support 1 – 43000 Resistance 1 – 43600
Support 2 – 42900 Resistance 2 – 43800
Exhibit 1: Nifty
Daily
Chart
Exhibit 2: Nifty Bank
Daily
Chart
Sensex (61702) / Nifty (18385)
The Indian equity markets had a timid start, taking cues from the
bleak global bourses. The benchmark index Nifty50 had a gap-down
opening and slipped below Monday’s low at the very start of the
session and stayed in a slender range at the lower zone for most of
the day. However, by the penultimate hour, the bulls made a
modest recovery and pared down the initial loss. Amidst the volatile
session, Nifty concluded the day with a mere cut of 0.19 percent and
settled a tad below the 18400 level.
We allude to our previous commentary on buying near the support
and staying light near the resistance, which is prominent in the
current situation. On the technical front, 18450-18500 still holds
significant resistance and until we decisively breach the same, the
view remains unchanged. As far as levels are concerned, 18200 is
likely to cushion any intraday blip, while the sacrosanct support lies
at 18100-18000. On the higher end, 18450-18500 is the
intermediate resistance breaching that could regain some relief.
However, the sturdy wall is seen at 18600, reclaiming which the
cheer would return to the market.
Going forward, the index is likely to trade within the mentioned
range in the comparable period, and any decisive breach on
either side could only dictate the near-term trend. From hereon,
selective stocks could outperform the market; hence, we
advocate the participants to remain selective and focus on the
stock-specific approach for better trading opportunities.
Key Levels
Support 1 – 18300 Resistance 1 – 18450
Support 2 – 18200 Resistance 2 – 18500

www.angelone.in
Technical & Derivatives Report
DEC 21, 2022
View
Post Monday’s strong close, we had a disappointing
start as we started the proceeding with a downside
gap and soon touched 18200. Luckily, no further
damage was observed in fact recovered especially in
the final hour to trim the losses and conclude tad
above 18350.
FIIs were net buyers in the cash market segment to
the tune of Rs. 456 crores. Simultaneously, in Index
futures, they sold worth Rs. 2986 crores with a rise in
open interest, indicating addition of short positions.
Looking at the F&O data, we witnessed some fresh
long addition in Nifty, whereas banking index
rebounded due to short covering. On the options
front, the piling up of OI is seen at 18200 and 18300
put strikes, indicating upward shift in the support.
On the flip side, the maximum OI concentration is
seen at the 18600 call strike, signifying a stiff
resistance for the Nifty. Meanwhile, the stronger
hands turned net buyers in equities and preferred
adding bearish bets in index futures segment.
Considering yesterday’s price action, we believe
18200 should now act as sacrosanct support and until
we manage to sustain above same the biasness
remains positive.
Comments
The Nifty futures open interest has increased by
2.28% and Bank Nifty futures open interest has
decreased by 7.86% as the market closed at 18385.30.
The Nifty December future closed with a premium of
38.65 point against a premium of 78.85 point in the
last trading session. The January series closed at a
premium of 143.50 point.
The INDIA VIX increased from 13.55 to 13.78. At the
same time, the PCR-OI of Nifty has remained
unchanged at 1.01.
Few of the liquid counters where we have seen high
cost of carry are IDEA, DALBHARAT, LAURUSLABS,
PIDILITIND and METROPOLIS.
Historical Volatility
SCRIP HV
ADANIPORTS 42.35
HDFCAMC 35.31
M&M 35.52
INDIAMART 50.14
POWERGRID 32.17
Nifty Vs OI
17800
18000
18200
18400
18600
18800
19000
8,000
9,000
10,000
11,000
12,000
13,000
14,000
15,000
16,000
12/1 12/5 12/8 12/12 12/14 12/16 12/18
Openinterest Nifty
OI Gainers
SCRIP OI
OI
CHG. (%)
PRICE
PRICE
CHG. (%)
VOLTAS 6714000 9.22 827.90 -1.06
SBILIFE 5902500 8.82 1231.25 -2.96
DABUR 11970000 8.24 579.50 -1.57
METROPOLIS 1876500 6.11 1281.05 -0.46
APOLLOTYRE 15785000 5.94 327.40 0.67
TATAMOTORS 88439775 5.47 410.50 -1.95
FSL 19219200 5.39 103.85 -0.48
ADANIENT 15364000 4.75 4165.25 1.91
OI Losers
SCRIP OI
OI
CHG. (%)
PRICE
PRICE
CHG. (%)
BALRAMCHIN 8523200 -5.95 406.35 3.42
MCX 1951600 -4.22 1644.15 -0.84
HDFC 15404700 -3.93 2700.30 -0.53
BRITANNIA 1379200 -3.93 4509.05 -0.41
HAVELLS 5080000 -3.88 1172.25 0.59
PNB 201616000 -3.71 55.55 -1.33
AMARAJABAT 4739000 -3.66 645.80 -0.57
ONGC 34141800 -3.61 145.85 -0.41
Put-Call Ratio
SCRIP PCR (OI) PCR (VOL)
NIFTY 1.01 0.93
BANKNIFTY 0.91 1.09
RELIANCE 0.42 0.36
ICICIBANK 0.45 0.65
INFY 0.38 0.42
www.angelone.in
Technical & Derivatives Report
DEC 21, 2022
Note: Above mentioned Bullish or Bearish Spreads in Nifty (Dec Series) are given as an information and not as a recommendation.
Nifty Spot =
1
8
385.30
FII Statistics for
December
20
, 2022
Detail Buy
Contracts
Open
Interest
Value
(in Cr.)
Sell
Net
CHANGE
INDEX
FUTURES
2614.20 5600.65 (2986.45) 157414 15274.42 2.03
INDEX
OPTIONS
1294147.83 1291814.43 2333.40
2134531 207025.98 (0.86)
STOCK
FUTURES
7959.69 9089.55 (1129.86) 1992881 137017.12 0.46
STOCK
OPTIONS
12346.95 12294.15 52.80
168661 11892.28 1.16
Total 1317068.67
1318798.78
(1730.11) 4453487
371209.80
(0.10)
Turnover
on
December
20
,
2022
Instrument
No. of
Contracts
Turnover
( in Cr. )
Change
(%)
Index
Futures
407505 39938.92 52.42
Index
Options
233858545 49441.04 26.89
Stock
Futures
716988 50315.59 7.73
Stock
Options
3817871 2994.16 7.57
Total
3,817,871 2994.16 24.45
Bull-Call Spreads
Action Strike Price Risk Reward BEP
Buy
18400 149.60
50.80
49.20
18450.80
Sell
18500 98.80
Buy
18400 149.60
87.95
112.05
18487.95
Sell
18600 61.65
Buy
18500 98.80
37.15 62.85 18537.15
Sell 18600 61.65
Bear
-
Put Spreads
Action Strike Price Risk Reward BEP
Buy 18400 125.35
36.60
63.40
18363.40
Sell
18300 88.75
Buy 18400 125.35
63.80
136.20
18336.20
Sell 18200 61.55
Buy
18300 88.75
27.20 72.80 18272.80
Sell 18200 61.55
Nifty Put
-
Call Analysis
,0
500,000
1000,000
1500,000
2000,000
2500,000
3000,000
3500,000
4000,000
4500,000
17800 17900 18000 18100 18200 18300 18400 18500 18600 18700 18800 18900 19000 19100
Call Put

www.angelone.in
Technical & Derivatives Report
DEC 21, 2022
`
Daily Pivot Levels for Nifty Constituents
Scrips
S2
S1
PIVOT
R1 R2
ADANIENT 4,029 4,097
4,135
4,203
4,240
ADANIPORTS
860
872
884
896
908
APOLLOHOSP 4,508 4,552
4,584
4,629
4,661
ASIANPAINT
2,992
3,037
3,063
3,108
3,134
AXISBANK
935
943
948
955
960
BAJAJ-AUTO 3,557 3,585
3,610
3,638
3,662
BAJFINANCE 6,528 6,586
6,642
6,699
6,756
BAJAJFINSV
1,584
1,600
1,609
1,625
1,635
BPCL
331
336
339
343
347
BHARTIARTL 812 821
830
838
848
BRITANNIA 4,436 4,473
4,503
4,540
4,570
CIPLA
1,083
1,087
1,092
1,096
1,101
COALINDIA 222 224
225
228
229
DIVISLAB
3,292
3,322
3,338 3,368
3,385
DRREDDY 4,274 4,322
4,356 4,404
4,438
EICHERMOT 3,240 3,277
3,328 3,364
3,415
GRASIM 1,717 1,738
1,751 1,772
1,785
HCLTECH
1,003
1,016
1,025
1,038
1,047
HDFCBANK 1,614 1,624
1,630
1,640
1,646
HDFCLIFE
575
577
581 584
588
HDFC
2,667
2,684
2,694 2,711
2,722
HEROMOTOCO
2,722
2,747
2,769
2,794
2,816
HINDALCO
439
448
454
463
469
HINDUNILVR
2,625
2,650
2,678
2,703
2,731
ICICIBANK
889
899
906
916
923
INDUSINDBK
1,200
1,214
1,224
1,239
1,249
INFY
1,468
1,488
1,502
1,521
1,535
ITC
335
338
339
342
343
JSW STEEL
728
737
742
751
756
KOTAKBANK 1,821 1,834
1,848
1,861
1,875
LT 2,118 2,141
2,160
2,183
2,202
M&M 1,251 1,263
1,275
1,288
1,300
MARUTI
8,361
8,443
8,514
8,595
8,666
NESTLEIND
19,735
19,935
20,051
20,252
20,368
NTPC
167
168
170
171
173
ONGC 142 144
145 147
148
POWERGRID
212
215
217
220
222
RELIANCE 2,545 2,583
2,605 2,643
2,665
SBILIFE
1,203
1,217
1,243
1,257
1,283
SBIN 597 601
604
607
610
SUNPHARMA 975 982
986
993
997
TCS
3,134
3,189
3,219
3,274
3,304
TATACONSUM
796 802
806
812 816
TATAMOTORS
402
406
412 416
422
TATASTEEL 108 109
110
112
113
TECHM
995
1,006
1,016 1,027
1,037
TITAN
2,467
2,488
2,503 2,523 2,538
ULTRACEMCO
6,957
7,027
7,076
7,147
7,196
UPL 736 745
758
768 781
WIPRO
380
385
387
392
394

www.angelone.in
Technical & Derivatives Report
DEC 21, 2022
*
Technical and Derivatives Team:
Sameet Chavan Chief Analyst – Technical & Derivatives sameet.chavan@angelone.in
Sneha Seth Senior Analyst – Technical & Derivatives sneha.seth@angelone.in
Rajesh Bhosale Technical Analyst rajesh.bhosle@angelone.in
Osho Krishan Senior Analyst – Technical & Derivatives osho.krishan@angelone.in
Research Team Tel: 022 – 39357600 Website: www.angelone.in
For Technical Queries E-mail: technicalresearch-cso@angelone.in
For Derivatives Queries E-mail: derivatives.desk@angelone.in
DISCLAIMER
Angel One Limited (hereinafter referred to as “Angel”) is a registered Member of National Stock Exchange of India Limited, Bombay
Stock Exchange Limited and Metropolitan Stock Exchange Limited. It is also registered as a Depository Participant with CDSL and
Portfolio Manager and investment advisor with SEBI. It also has registration with AMFI as a Mutual Fund Distributor. Angel One
Limited is a registered entity with SEBI for Research Analyst in terms of SEBI (Research Analyst) Regulations, 2014 vide registration
number INH000000164. Angel or its associates has not been debarred/ suspended by SEBI or any other regulatory authority for
accessing /dealing in securities Market.
This document is solely for the personal information of the recipient, and must not be singularly used as the basis of any investment
decision. Nothing in this document should be construed as investment or financial advice. Each recipient of this document should
make such investigations as they deem necessary to arrive at an independent evaluation of an investment in the securities of the
companies referred to in this document (including the merits and risks involved), and should consult their own advisors to determine
the merits and risks of such an investment.
Angel or its associates or research analyst or his relative may have actual/beneficial ownership of 1% or more in the securities of
the subject company at the end of the month immediately preceding the date of publication of the research report. Neither Angel or
its associates nor Research Analysts or his relative has any material conflict of interest at the time of publication of research report.
Angel or its associates might have received any compensation from the companies mentioned in the report during the period
preceding twelve months from the date of this report for services in respect of managing or co-managing public offerings, corporate
finance, investment banking or merchant banking, brokerage services or other advisory service in a merger or specific transaction
in the normal course of business. Angel or its associates did not receive any compensation or other benefits from the companies
mentioned in the report or third party in connection with the research report. Neither Angel nor its research analyst entity has been
engaged in market making activity for the subject company.
Reports based on technical and derivative analysis center on studying charts of a stock's price movement, outstanding positions and
trading volume, as opposed to focusing on a company's fundamentals and, as such, may not match with a report on a company's
fundamentals. Investors are advised to refer the Fundamental and Technical Research Reports available on our website to evaluate
the contrary view, if any.
The information in this document has been printed on the basis of publicly available information, internal data and other reliable
sources believed to be true, but we do not represent that it is accurate or complete and it should not be relied on as such, as this
document is for general guidance only. Angel One Limited or any of its affiliates/ group companies shall not be in any way responsible
for any loss or damage that may arise to any person from any inadvertent error in the information contained in this report. Angel One
Limited has not independently verified all the information contained within this document. Accordingly, we cannot testify, nor make
any representation or warranty, express or implied, to the accuracy, contents or data contained within this document. While Angel
One Limited endeavors to update on a reasonable basis the information discussed in this material, there may be regulatory,
compliance, or other reasons that prevent us from doing so.
This document is being supplied to you solely for your information, and its contents, information or data may not be reproduced,
redistributed or passed on, directly or indirectly.
Neither Angel One Limited, nor its directors, employees or affiliates shall be liable for any loss or damage that may arise from or in
connection with the use of this information. Angel or its associates or Research Analyst or his relative might have financial interest
in the subject company. Research analyst has not served as an officer, director or employee of the subject company.
