NOV 21, 2022
www.angelone.in
Technical & Derivatives Report
xOOOOOOOO
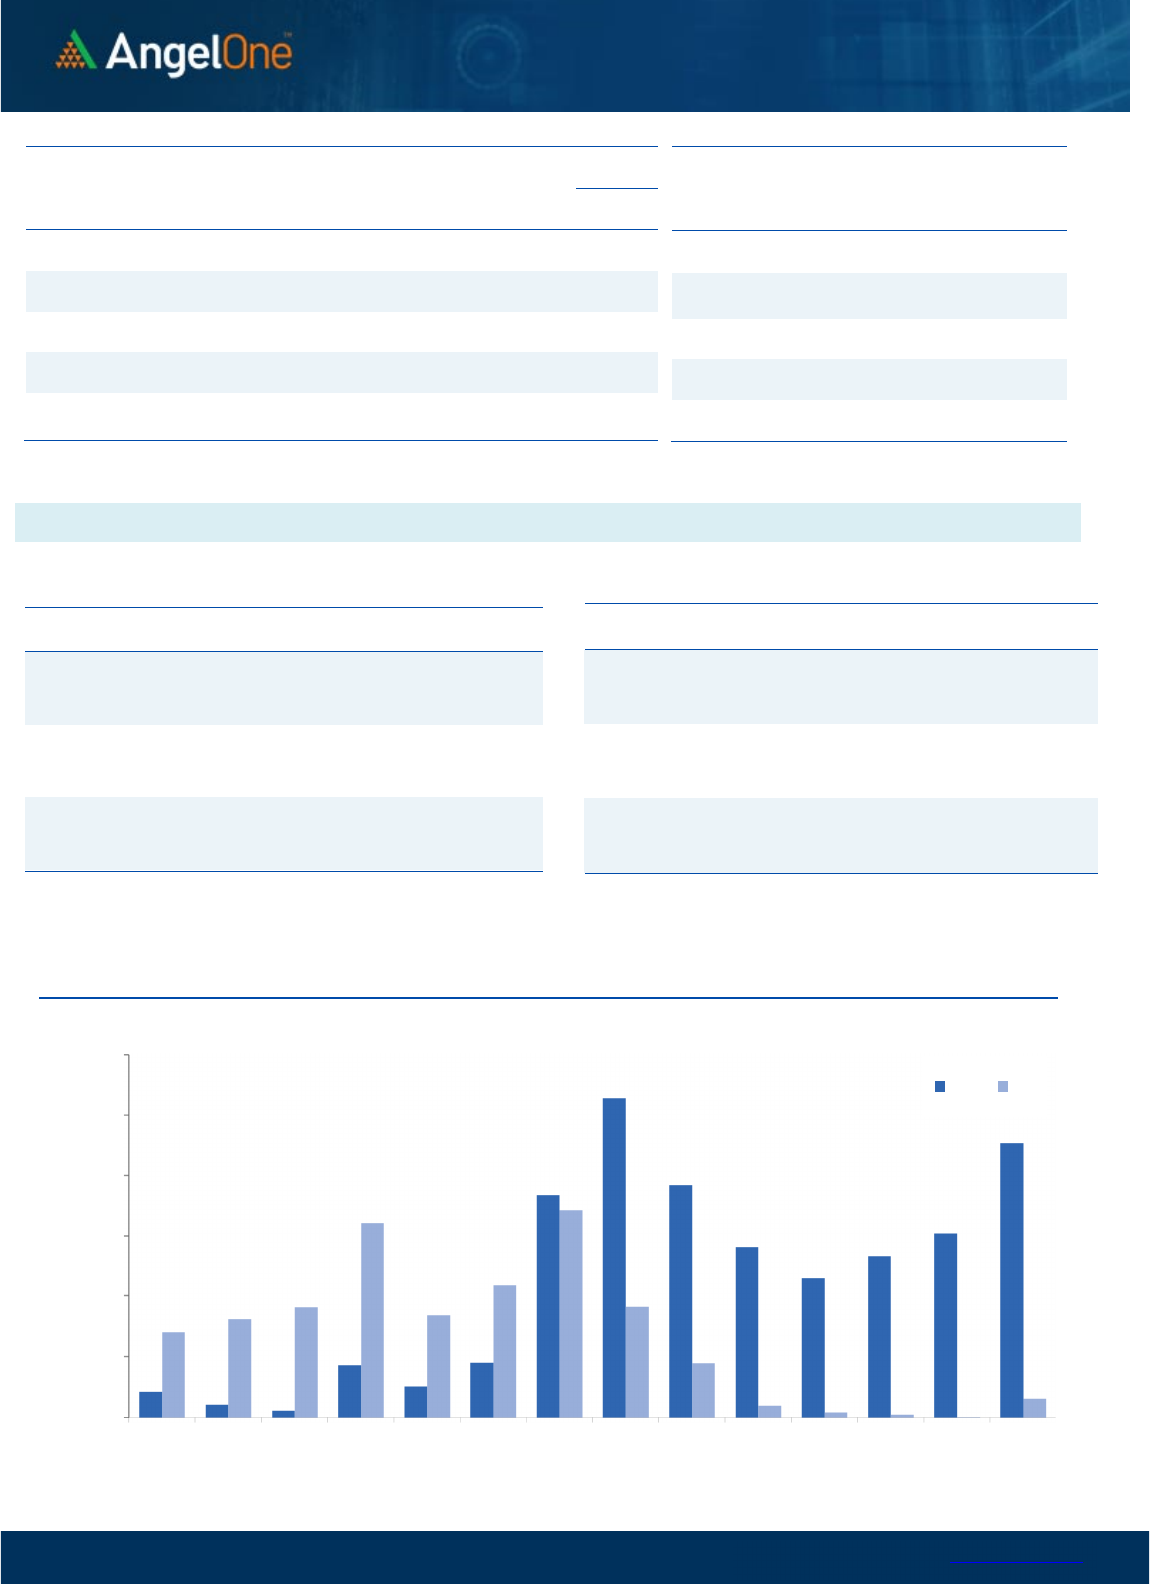
Nifty Bank
Outlook (
4
2
4
37
)
Bank Nifty continued with its northward journey as the weekly
winning streak extends for the seventh consecutive week. The
traction however has cooled down a bit as the weekly gains were
under a percent to end a tad below the 42450 levels.
The bank index continues to be the charioteer for the bulls as even
though there was some tentativeness at higher levels for the
broader markets; this index continued to make fresh new highs.
The momentum on the Index front was not that high; however, we
witnessed some of the private and PSU banks giving mesmerizing
moves. Throughout the week, we witnessed intraday dips getting
bought into, and on Friday as well prices bounced back sharply
after testing the 5EMA on the daily chart. Going ahead, we
continue to see immediate support around the 42200 - 42100
levels whereas the strong support remains around the bullish gap
left around the 41900 - 41650 levels. On the flip side, 42750 - 43000
seems an immediate resistance zone. In this consolidation phase,
the ideal strategy would be buying around the support levels while
booking profit around the mentioned resistance levels.
Key Levels
Support 1 – 42200 Resistance 1 – 42750
Support 2 – 42100 Resistance 2 – 43000
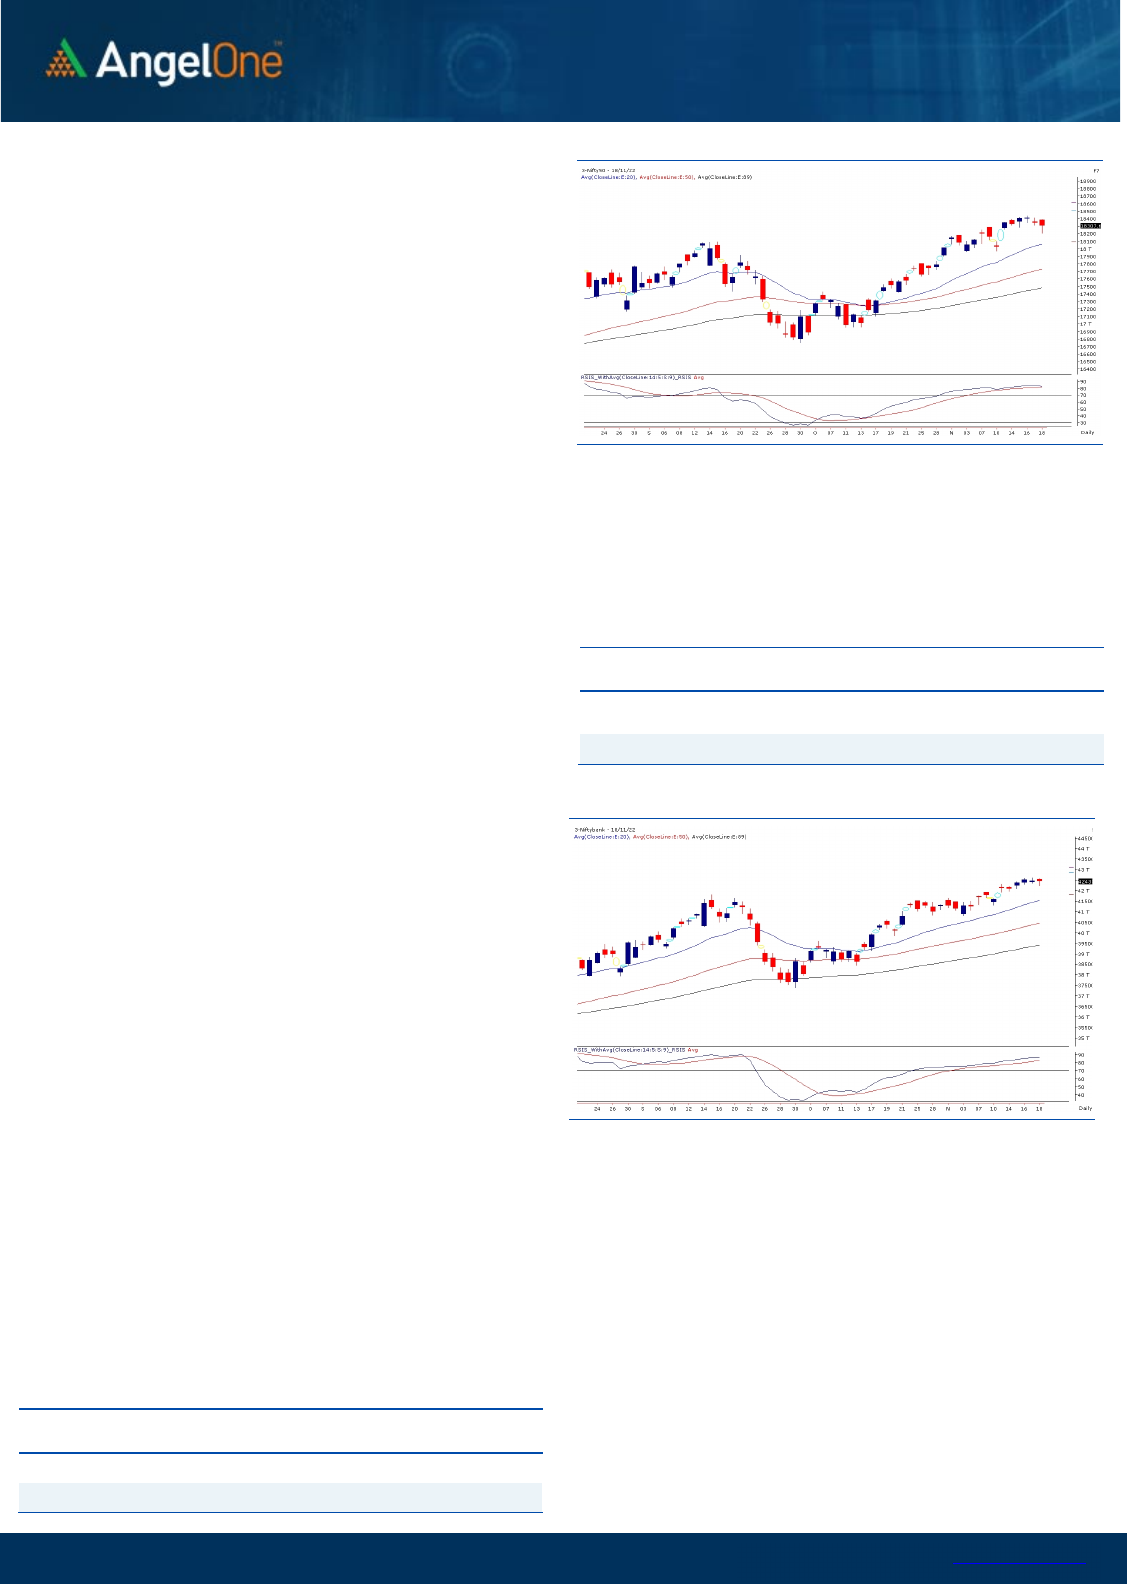
Exhibit 1: Nifty
Daily
Chart
Exhibit 2: Nifty Bank
Daily
Chart
Sensex (61663) / Nifty (18308)
During the last week, Nifty consolidated in a slender range of 200
odd points for a major part of the week. By the weekend, a sell-off
triggered in the broader market, which dragged the benchmark
index lower, but bulls retaliated well to safeguard the support zone
and concluded the week with a mere cut of 0.23 percent. With the
weekly closure, Nifty snapped its four weeks of winning streak and
settled a tad above the 18300 level.
It was a lackluster week for the market participants as the follow-up
buying was clearly missing to uplift the market, and this resulted in
a lull movement in the benchmark index. Global concerns over rising
inflation have led to mixed action, mirroring which our market
remained tentative at the higher levels. On the technical front, the
structure remains upbeat. As far as levels are concerned, the bullish
gap of 18100-18250 is likely to provide a cushion to any intra-week
blip, and it is highly anticipated that the dip would augur well for the
bulls. On the flip side, the 18450-18500 is a significant hurdle for the
bulls, and any decisive breach above the same could only trigger a
fresh round of rally in the market. Meanwhile, the market awaits
some trigger points to have an upsurge, and in the meantime, the
index is expected to remain in the mentioned range.
We remain sanguine with the up trend and would advocate the
traders to utilize the dips to add long position in the index. Also,
despite the lethargic moves in the index throughout the week,
some of the individual pockets kept buzzing. Hence, we expect
some interesting moves to unfold in a larger pool of stocks, which
is likely to provide better opportunities for momentum traders.
Key Levels
Support 1 – 18200 Resistance 1 – 18450
Support 2 – 18100 Resistance 2 – 18525

www.angelone.in
Technical & Derivatives Report
NOV 21, 2022
View
The Indian equity market witnessed a lackluster week
of trade, wherein the benchmark index Nifty50
remained in a slender range and concluded the week
with a mere loss of 0.23%, a tad above the 18300 level.
FIIs were net sellers in the cash market segment to
the tune of Rs. 751 crores. Simultaneously, in Index
futures, they bought worth Rs. 85 crores with a
decrease in open interest, indicating short covering.
Looking at the overall F&O data, we have witnessed a
mixed trade in both indices. On the options front, the
piling up of positions is visible in the 18200-18300 put
strike, indicating nearby support formation for Nifty.
While on the higher end, the OI concentration is now
visible in the 18400 call strike, followed by 18500 CE,
signifying stiff resistance for Nifty. Simultaneously, the
stronger hands have remained steady with their
bullish bets as the ‘Long Short Ratio’ slightly expanded
to 65% from 62% on WoW basis. Going ahead, the
undertone is likely to remain bullish, and any intra-
week dip could be seen as an opportunity to add long
bets in the index.
Comments
The Nifty futures open interest has decreased by
3.05%. and Bank Nifty futures open interest has
increased by 1.46% as the market closed at 18307.65.
The Nifty November future closed with a premium of
48.25 point against a premium of 34.50 point in the
last trading session. The December series closed at
a premium of 135.25 point.
The INDIA VIX decreased from 14.87 to 14.39. At the
same time, the PCR-OI of Nifty has decreased from
0.98 to 0.89.
Few of the liquid counters where we have seen high
cost of carry are GLENMARK, NMDC, NAVINFLUOR,
MANAPPURAM and M&M.
Historical Volatility
SCRIP HV
GNFC 60.18
HDFCBANK 30.63
HDFC 34.63
INDHOTEL 46.24
NAUKRI 50.33
Nifty Vs OI
17600
17700
17800
17900
18000
18100
18200
18300
18400
18500
18600
8,000
9,000
10,000
11,000
12,000
13,000
14,000
15,000
16,000
11/1 11/3 11/7 11/9 11/14 11/16 11/18
Openinterest Nifty
OI Gainers
SCRIP OI
OI
CHG. (%)
PRICE
PRICE
CHG. (%)
ONGC 52656450 18.24 141.75 -0.73
POLYCAB 1281900 17.33 2527.50 -1.47
IGL 13282500 14.80 418.05 1.55
PVR 3539272 11.86 1728.00 -1.26
MFSL 3363100 11.10 661.50 1.80
RBLBANK 50430000 9.01 144.05 -0.72
INDIAMART 314850 8.87 4491.20 -2.14
AARTIIND 4185400 8.65 653.40 -0.20
OI Losers
SCRIP OI
OI
CHG. (%)
PRICE
PRICE
CHG. (%)
GSPL 5170000 -10.67 237.45 -1.02
MINDTREE 2282800 -10.07 3506.15 -0.96
NMDC 29696500 -9.29 111.10 4.99
BSOFT 10517000 -8.28 285.95 3.51
PERSISTENT 626925 -6.31 3734.55 -1.03
BALRAMCHIN 9787200 -6.17 351.05 0.90
ABB 1497250 -5.94 3092.55 -0.97
HAL 4355875 -5.70 2622.55 -1.52
Put-Call Ratio
SCRIP PCR (OI) PCR (VOL)
NIFTY 0.89 0.90
BANKNIFTY 0.92 1.00
RELIANCE 0.58 0.55
ICICIBANK 0.49 0.59
INFY 0.65 0.54
www.angelone.in
Technical & Derivatives Report
NOV 21, 2022
Note: Above mentioned Bullish or Bearish Spreads in Nifty (Nov Series) are given as an information and not as a recommendation.
Nifty Spot =
1
8
3
07
.
65
FII Statistics for
November
1
8
, 2022
Detail Buy
Contracts
Open
Interest
Value
(in Cr.)
Sell
Net
CHANGE
INDEX
FUTURES
2713.89 2628.89 85.00
178902 17001.09 (1.97)
INDEX
OPTIONS
651705.49 645660.32 6045.17
1909773 181070.75 39.64
STOCK
FUTURES
16589.71 16685.35 (95.64) 2170713 148045.03 0.04
STOCK
OPTIONS
13855.70 13456.67 399.03
161252 11375.02 (2.43)
Total 684864.79
678431.23
6433.56
4420640
357491.89
13.78
Turnover on
November
1
8
, 2022
Instrumen
t
No. of
Contracts
Turnover
( in Cr. )
Change
(%)
Index
Futures
334168 3257793.44
36.91
Index
Options
81802337 3277597.29
-11.53
Stock
Futures
1126272 7841218.67
36.32
Stock
Options
4683853 306222.32 -2.51
Total
46,83,853 306222.32 20.84
Bull-Call Spreads
Action Strike Price Risk Reward BEP
Buy
18300 167.10
54.70
45.30
18354.70
Sell
18400 108.45
Buy
18300 167.10
91.30
108.70
18391.30
Sell
18500 64.15
Buy
18400 108.45
36.60 63.40 18436.60
Sell 18500 64.15
Bear
-
Put Spreads
Action Strike Price Risk Reward BEP
Buy 18300 91.10
31.10
68.90
18268.90
Sell
18200 61.00
Buy 18300 91.10
51.05
148.95
18248.95
Sell 18100 40.30
Buy
18200 61.00
19.95 80.05 18180.05
Sell 18100 40.30
Nifty Put
-
Call Analysis
,0
2000,000
4000,000
6000,000
8000,000
10000,000
12000,000
17700 17800 17900 18000 18100 18200 18300 18400 18500 18600 18700 18800 18900 19000
Call Put

www.angelone.in
Technical & Derivatives Report
NOV 21, 2022
`
Daily Pivot Levels for Nifty Constituents
Scrips
S2
S1
PIVOT
R1 R2
ADANIENT
3,957
3,988
4,016
4,047
4,075
ADANIPORTS
873
881
888
896
903
APOLLOHOSP 4,260 4,330
4,389 4,459
4,518
ASIANPAINT 3,030 3,063
3,089 3,122
3,148
AXISBANK
849
854
860
865 871
BAJAJ-AUTO 3,568 3,600
3,654 3,686
3,739
BAJFINANCE 6,645 6,718
6,823
6,896
7,001
BAJAJFINSV
1,623
1,639
1,657
1,672
1,690
BPCL
300
302
304
306
309
BHARTIARTL 819 828
840
849 861
BRITANNIA 4,025 4,065
4,102
4,142
4,179
CIPLA
1,082
1,092
1,110
1,120
1,137
COALINDIA
225
227
230
233
236
DIVISLAB
3,233
3,260
3,287 3,315 3,342
DRREDDY 4,347 4,378
4,406
4,437
4,465
EICHERMOT
3,326
3,358
3,408
3,440
3,489
GRASIM
1,662
1,686
1,705
1,728
1,747
HCLTECH
1,076
1,089
1,098
1,111
1,120
HDFCBANK
1,596
1,605
1,614
1,623
1,632
HDFCLIFE
525
528
531 535
538
HDFC
2,632
2,650
2,661
2,678
2,689
HEROMOTOCO 2,685 2,704
2,722
2,741 2,758
HINDALCO
430
434
439
444
448
HINDUNILVR 2,434 2,459
2,474 2,499
2,513
ICICIBANK
906
913
918 925
929
INDUSINDBK 1,105 1,117
1,134
1,146
1,163
INFY
1,566
1,580
1,589
1,602
1,611
ITC 337 339
342
344
347
JSW STEEL 697 702
707
713
717
KOTAKBANK 1,919 1,939
1,968
1,989
2,018
LT
1,983
2,004
2,027
2,048
2,072
M&M 1,195 1,211
1,233
1,250
1,272
MARUTI
8,715
8,781
8,903
8,969
9,091
NESTLEIND 19,651 19,788
19,917
20,054
20,183
NTPC
163
164
167
168
171
ONGC
139
140
142 143 145
POWERGRID
216
217
218
219
220
RELIANCE 2,555 2,576
2,593
2,614 2,630
SBILIFE
1,224
1,233
1,247
1,257
1,270
SBIN
593
598
602
607
610
SUNPHARMA 999 1,004
1,011
1,016
1,023
TCS
3,301
3,322
3,342 3,364
3,384
TATACONSUM
756 766
779
789
803
TATAMOTORS 419 421
424
426
429
TATASTEEL 104 105
106
106
107
TECHM
1,038
1,050
1,057
1,069
1,076
TITAN
2,526
2,546
2,565 2,584 2,603
ULTRACEMCO
6,661
6,738
6,839 6,915
7,016
UPL 752 759
767
775
783
WIPRO
389
391
395
398 401

www.angelone.in
Technical & Derivatives Report
NOV 21, 2022
*
Technical and Derivatives Team:
Sameet Chavan Chief Analyst – Technical & Derivatives sameet.chavan@angelone.in
Sneha Seth Senior Analyst – Technical & Derivatives sneha.seth@angelone.in
Rajesh Bhosale Technical Analyst rajesh.bhosle@angelone.in
Osho Krishan Senior Analyst – Technical & Derivatives osho.krishan@angelone.in
Research Team Tel: 022 – 39357600 Website: www.angelone.in
For Technical Queries E-mail: technicalresearch-cso@angelone.in
For Derivatives Queries E-mail: derivatives.desk@angelone.in
DISCLAIMER
Angel One Limited (hereinafter referred to as “Angel”) is a registered Member of National Stock Exchange of India Limited, Bombay
Stock Exchange Limited and Metropolitan Stock Exchange Limited. It is also registered as a Depository Participant with CDSL and
Portfolio Manager and investment advisor with SEBI. It also has registration with AMFI as a Mutual Fund Distributor. Angel One
Limited is a registered entity with SEBI for Research Analyst in terms of SEBI (Research Analyst) Regulations, 2014 vide registration
number INH000000164. Angel or its associates has not been debarred/ suspended by SEBI or any other regulatory authority for
accessing /dealing in securities Market.
This document is solely for the personal information of the recipient, and must not be singularly used as the basis of any investment
decision. Nothing in this document should be construed as investment or financial advice. Each recipient of this document should
make such investigations as they deem necessary to arrive at an independent evaluation of an investment in the securities of the
companies referred to in this document (including the merits and risks involved), and should consult their own advisors to determine
the merits and risks of such an investment.
Angel or its associates or research analyst or his relative may have actual/beneficial ownership of 1% or more in the securities of
the subject company at the end of the month immediately preceding the date of publication of the research report. Neither Angel or
its associates nor Research Analysts or his relative has any material conflict of interest at the time of publication of research report.
Angel or its associates might have received any compensation from the companies mentioned in the report during the period
preceding twelve months from the date of this report for services in respect of managing or co-managing public offerings, corporate
finance, investment banking or merchant banking, brokerage services or other advisory service in a merger or specific transaction
in the normal course of business. Angel or its associates did not receive any compensation or other benefits from the companies
mentioned in the report or third party in connection with the research report. Neither Angel nor its research analyst entity has been
engaged in market making activity for the subject company.
Reports based on technical and derivative analysis center on studying charts of a stock's price movement, outstanding positions and
trading volume, as opposed to focusing on a company's fundamentals and, as such, may not match with a report on a company's
fundamentals. Investors are advised to refer the Fundamental and Technical Research Reports available on our website to evaluate
the contrary view, if any.
The information in this document has been printed on the basis of publicly available information, internal data and other reliable
sources believed to be true, but we do not represent that it is accurate or complete and it should not be relied on as such, as this
document is for general guidance only. Angel One Limited or any of its affiliates/ group companies shall not be in any way responsible
for any loss or damage that may arise to any person from any inadvertent error in the information contained in this report. Angel One
Limited has not independently verified all the information contained within this document. Accordingly, we cannot testify, nor make
any representation or warranty, express or implied, to the accuracy, contents or data contained within this document. While Angel
One Limited endeavors to update on a reasonable basis the information discussed in this material, there may be regulatory,
compliance, or other reasons that prevent us from doing so.
This document is being supplied to you solely for your information, and its contents, information or data may not be reproduced,
redistributed or passed on, directly or indirectly.
Neither Angel One Limited, nor its directors, employees or affiliates shall be liable for any loss or damage that may arise from or in
connection with the use of this information. Angel or its associates or Research Analyst or his relative might have financial interest
in the subject company. Research analyst has not served as an officer, director or employee of the subject company.
