OCT 21, 2022
www.angelone.in
Technical & Derivatives Report
xOOOOOOOO
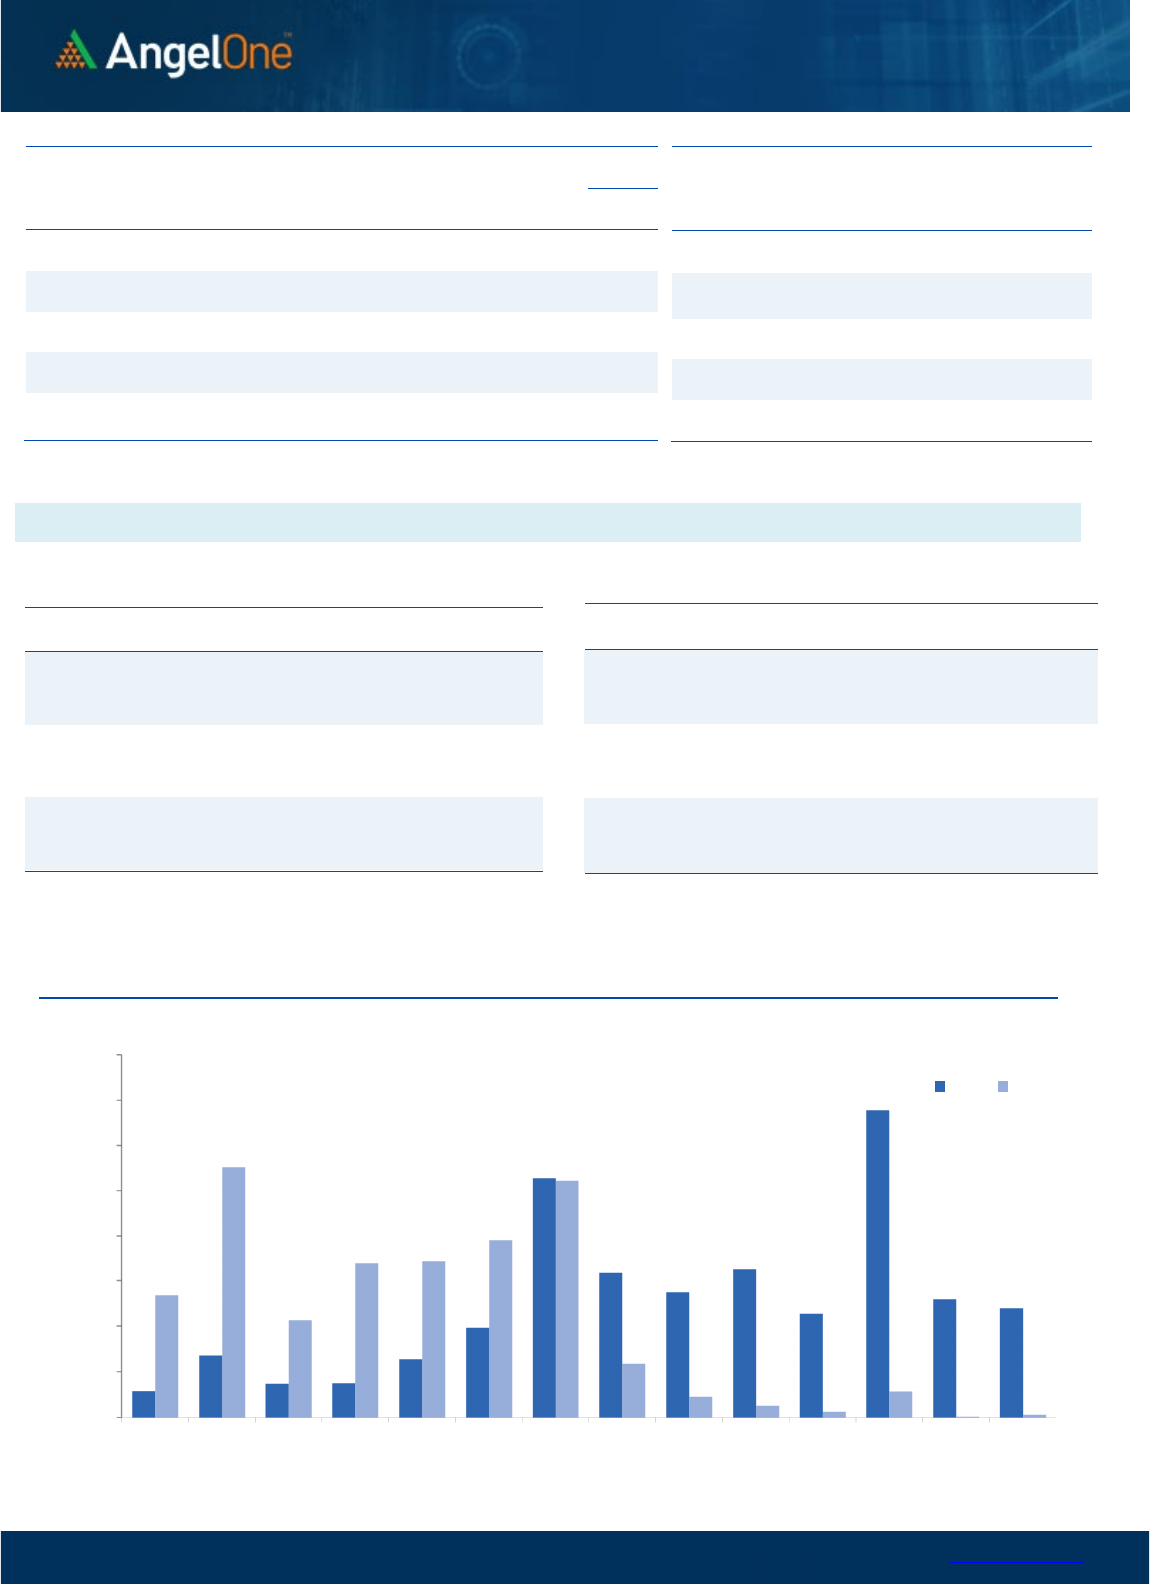
Nifty Bank Outlook (40100)
The Bank Nifty index has snapped its winning streak of four
consecutive sessions and has underperformed the benchmark
index in the last trading session. The index has settled at the 40100
level, with a correction of 0.68 percent.
On the technical aspect, the banking index is still in the bullish
trajectory as it hovers well above all its major exponential moving
averages on the daily chart. Also, the cycle of higher highs – higher
lows is maintained, signifying the bullish quotient in the index.
Meanwhile, the undertone is likely to favor the bulls, wherein any
minor correction could be seen as an opportunity to add fresh
longs. As far as levels are concerned, the 21-DEMA placed around
39500 is likely to provide a cushion for any blip, while on the flip
side, 40500-40650 is expected to act as the immediate hurdle.
Key Levels
Support 1 – 39850 Resistance 1 – 40500
Support 2 – 39500 Resistance 2 – 40650
Exhibit 1: Nifty
Daily
Chart
Exhibit 2: Nifty Bank
Daily
Chart
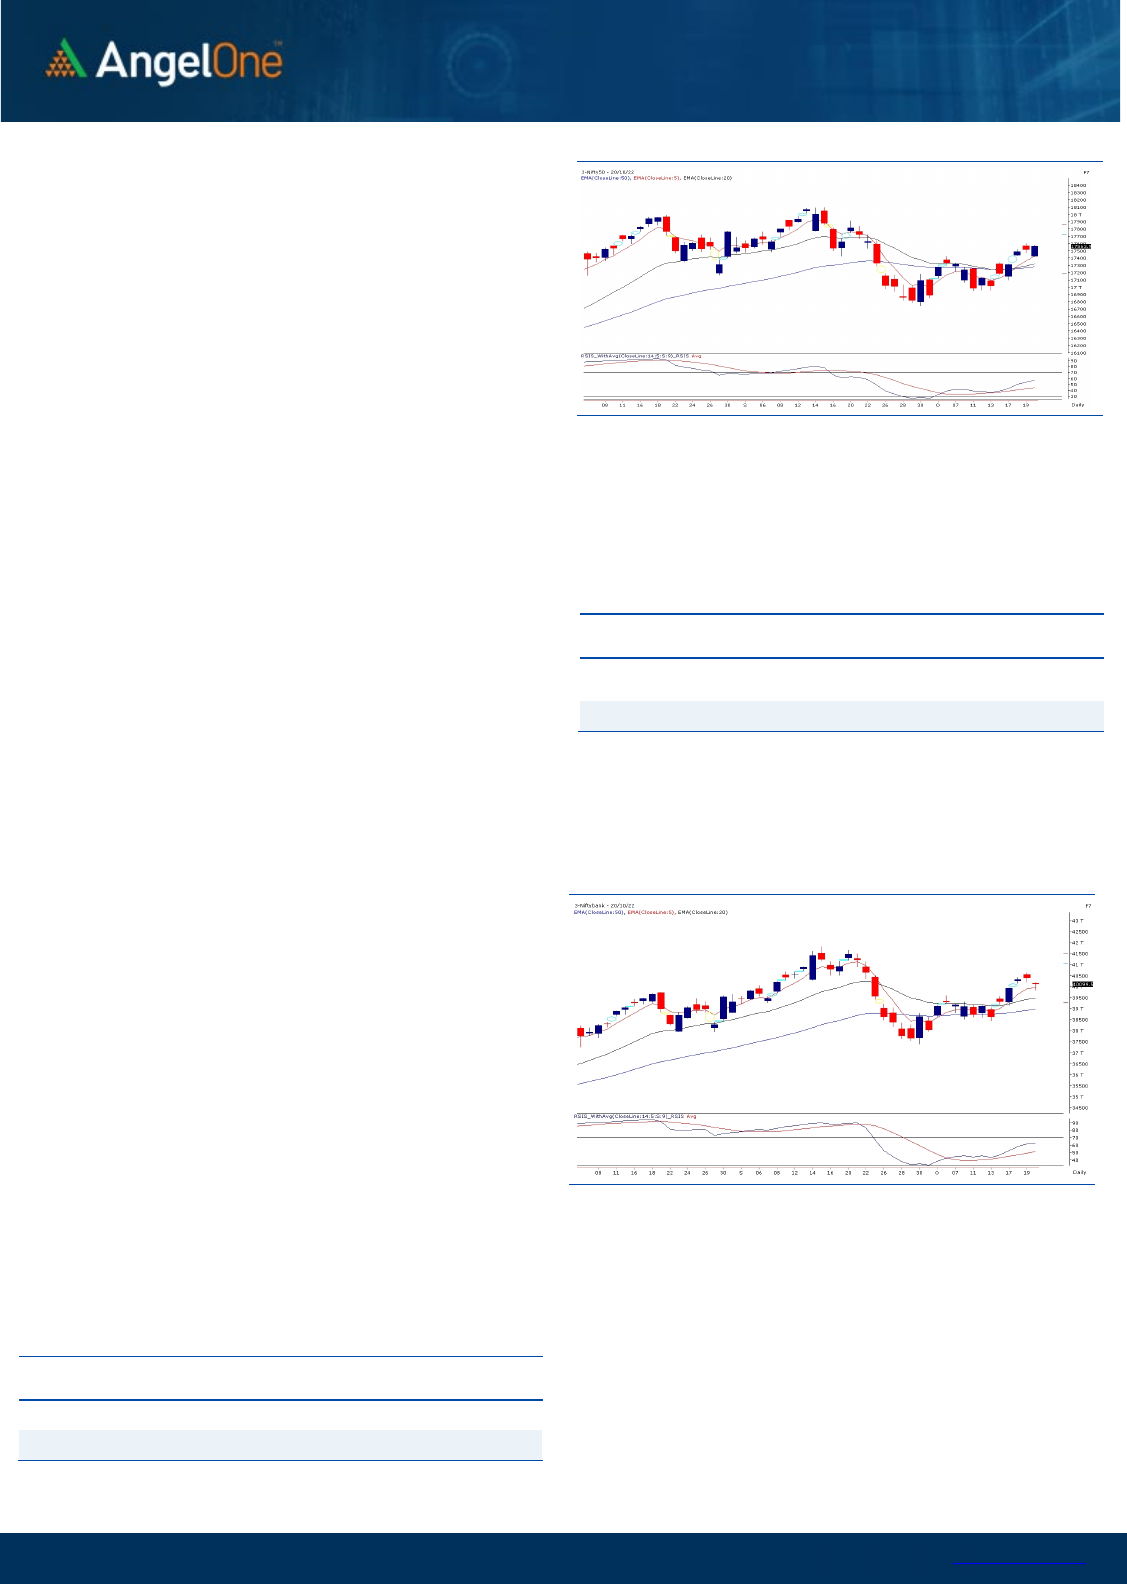
Sensex (59203) / Nifty (17564)
Yesterday morning, the global markets looked a bit sluggish and
hence, indicated a weak opening for our market. We did open lower
but not to the tune of what SGX was indicating. Nifty started the
session slightly above 17400 and from there, the recovery took
place in a gradual manner. However, as we stepped into the latter
half of the session, the buying accelerated in some of the
heavyweight spaces, which resulted in Nifty ending the session well
inside the positive territory a tad above the 17550 mark.
Technically speaking, the intraday price movement was precisely as
per the sturdy structure of Nifty. If we look at the hourly chart
meticulously, we can see Nifty opening and then finding support
exactly at the ’89-EMA’ levels which acted as a sheet anchor. This is
what we have been mentioning since couple of days, market may
see small profit booking in between but the undertone is strongly
bullish. In such scenarios, rather than shorting form small declines,
it’s better to wait for the opportunity to go long around key
supports. Now the kind of close we have witnessed yesterday; Nifty
is well poised for surpassing 17600 in coming session. If global
market supports, we may see Nifty heading towards 17700 – 17800
soon.
On the flipside, 17500 followed by 17400 remains to be a
sacrosanct support for the forthcoming session. Traders are
advised to continue with the positive bias and look for potential
buyers within the appropriate themes.
Key Levels
Support 1 – 17500 Resistance 1 – 17700
Support 2 – 17400 Resistance 2 – 17800

www.angelone.in
Technical & Derivatives Report
OCT 21, 2022
View
We had a negative start on the weekly expiry
session; however, buying interest was observed
thereafter to recoup all the losses and conclude the
session with the gains of 0.30%.
FIIs were net buyers in the cash market segment to
the tune of Rs. 1865 crores. Simultaneously, in Index
futures, they sold worth Rs. 1785 crores with a rise in
open interest; indicating formation of short positions in
yesterday’s session.
In derivatives front, fresh long formation was seen in
Nifty whereas in Bank Nifty we witnessed short
formations. Surprisingly, the stronger hands turned
net buyers in equities after quite some time but
continued selling in index futures segment. In the
monthly expiry series, we observed fresh writing in
17400 and 17500 put strikes adding decent positions.
Considering yesterday’s respite from the support zone
of 17300-17400, we maintain our bullish stance on
market; hence traders are advised adding longs in any
dips for now.
Comments
The Nifty futures open interest has increased by
10.04%. and Bank Nifty futures open interest has
increased by 4.88% as the market closed at 17512.25.
The Nifty October future closed with a discount of
23.25 point against a discount of 17.60 point in the last
trading session. The November series closed at a
premium of 17.50 point.
The INDIA VIX decreased from 17.45 to 17.23. At the
same time, the PCR-OI of Nifty has increased from
1.13 to 1.22.
Few of the liquid counters where we have seen high
cost of carry are IDEA, BALRAMCHIN, ASTRAL, BPCL
and MFSL.
Historical Volatility
SCRIP HV
UPL 40.58
AUBANK 48.53
HDFCAMC 37.63
BSOFT 51.82
INDUSINDBK 51.25
Nifty Vs OI
16400
16600
16800
17000
17200
17400
17600
17800
,0
2,000
4,000
6,000
8,000
10,000
12,000
14,000
16,000
18,000
10/3 10/6 10/10 10/12 10/14 10/18 10/20
Openinterest Nifty
OI Gainers
SCRIP OI
OI
CHG. (%)
PRICE
PRICE
CHG. (%)
AARTIIND 2395300 29.38 686.60 -0.35
AUBANK 7580000 14.29 592.35 -4.86
PNB 311200000 11.32 40.50 2.80
IDFCFIRSTB 206805000 9.96 56.80 -0.52
INDUSINDBK 28662300 9.62 1159.95 -4.72
ICICIPRULI 8440500 9.39 518.80 1.93
IDEA 645540000 9.37 8.55 0.58
AXISBANK 51160800 9.02 825.85 -0.50
OI Losers
SCRIP OI
OI
CHG. (%)
PRICE
PRICE
CHG. (%)
JKCEMENT 390500 -16.20 2684.65 2.34
LTTS 1374800 -15.43 3530.90 2.59
NAVINFLUOR 616500 -13.86 4418.95 1.13
GUJGASLTD 8293750 -13.62 483.65 0.76
DEEPAKNTR 1703000 -13.00 2247.45 -0.56
MUTHOOTFIN 7409625 -12.17 1048.00 0.25
AMARAJABAT 6419000 -11.92 488.55 0.70
RAMCOCEM 3805450 -11.63 708.10 1.70
Put-Call Ratio
SCRIP PCR (OI) PCR (VOL)
NIFTY 1.22 0.97
BANKNIFTY 0.89 0.94
RELIANCE 0.54 0.36
ICICIBANK 0.53 0.52
INFY 0.50 0.38
www.angelone.in
Technical & Derivatives Report
OCT 21, 2022
Note: Above mentioned Bullish or Bearish Spreads in Nifty (Oct Series) are given as an information and not as a recommendation.
Nifty Spot =
1
7
5
63.95
FII Statistics for
October
20
, 2022
Detail Buy
Contracts
Open
Interest
Value
(in Cr.)
Sell
Net
CHANGE
INDEX
FUTURES
4258.78 6043.64 (1784.86) 179687 16308.59 16.57
INDEX
OPTIONS
2263885.03 2248671.22 15213.81
1417529 127960.24 (30.06)
STOCK
FUTURES
48280.05 46930.76 1349.29
2170635 149284.36 (0.29)
STOCK
OPTIONS
9112.49 8892.83 219.66
161183 11690.67 2.05
Total 2325536.35
2310538.45
14997.90
3929034
305243.86
(13.00)
Turnover on
October
20
, 2022
Instrument
No. of
Contracts
Turnover
( in Cr. )
Change
(%)
Index Futures
410639 38231.43 9.26
Index Options
306200177 50528.06 9.97
Stock
Futures
1767891 124418.14 50.06
Stock Options
3370401 2910.05 -20.26
Total
3,370,401 2910.05 29.00
Bull-Call Spreads
Action Strike Price Risk Reward BEP
Buy
17600 108.40
40.50
59.50
17640.50
Sell
17700 67.90
Buy
17600 108.40
69.25
130.75
17669.25
Sell
17800 39.15
Buy
17700 67.90
28.75 71.25 17728.75
Sell 17800 39.15
Bear
-
Put Spreads
Action Strike Price Risk Reward BEP
Buy 17500 120.45
38.35
61.65
17461.65
Sell
17400 82.10
Buy 17500 120.45
64.70
135.30
17435.30
Sell 17300 55.75
Buy
17400 82.10
26.35 73.65 17373.65
Sell 17300 55.75
Nifty Put
-
Call Analysis
,0
1000,000
2000,000
3000,000
4000,000
5000,000
6000,000
7000,000
8000,000
16900 17000 17100 17200 17300 17400 17500 17600 17700 17800 17900 18000 18100 18200
Call Put

www.angelone.in
Technical & Derivatives Report
OCT 21, 2022
`
Daily Pivot Levels for Nifty Constituents
Scrips
S2
S1
PIVOT
R1 R2
ADANIENT 3,202 3,280
3,322
3,400
3,442
ADANIPORTS
785
803
812 830
840
APOLLOHOSP 4,239 4,281
4,337 4,379
4,435
ASIANPAINT
3,021
3,081
3,162
3,221 3,302
AXISBANK 810 818
825
833
840
BAJAJ-AUTO 3,543 3,617
3,661
3,735
3,778
BAJFINANCE
7,193
7,313
7,381
7,501
7,569
BAJAJFINSV
1,657
1,691
1,711
1,745
1,764
BPCL
284
290
295
301
306
BHARTIARTL 773 783
788
799
804
BRITANNIA
3,725
3,758
3,780 3,813
3,835
CIPLA 1,107 1,122
1,132 1,147
1,157
COALINDIA
230
236
239
244
248
DIVISLAB 3,533 3,592
3,624 3,683
3,715
DRREDDY 4,253 4,301
4,328 4,376
4,403
EICHERMOT 3,524 3,587
3,624 3,687 3,724
GRASIM
1,657
1,673
1,684
1,700
1,711
HCLTECH 977 997
1,008
1,028
1,040
HDFCBANK
1,438
1,443
1,448
1,454
1,458
HDFCLIFE
523
530
534
541
545
HDFC
2,336
2,353
2,364 2,380
2,392
HEROMOTOCO
2,479
2,522
2,546 2,589
2,613
HINDALCO
374
385
391
401
407
HINDUNILVR
2,551
2,576
2,593
2,618
2,635
ICICIBANK
874
881
887
895
901
INDUSINDBK 1,111 1,135
1,175 1,199
1,239
INFY
1,463
1,482
1,493
1,512
1,523
ITC
342
346
348
352
355
JSW STEEL
609
619
624
634
639
KOTAKBANK
1,840
1,852
1,867
1,879
1,895
LT 1,871 1,888
1,903
1,919
1,934
M&M 1,212 1,231
1,243
1,261
1,273
MARUTI 8,558 8,633
8,686 8,761
8,814
NESTLEIND
19,525
19,793
19,968
20,237
20,412
NTPC
159
163
165
169
172
ONGC 124 127
129
132
134
POWERGRID 210 214
216
220
222
RELIANCE 2,468 2,484
2,502 2,518
2,536
SBILIFE
1,206
1,215
1,222
1,231
1,238
SBIN 541 548
553
560
564
SUNPHARMA
960
970
977
987
993
TCS 3,086 3,122
3,141
3,177
3,196
TATACONSUM
750
760
766
777
783
TATAMOTORS
390
394
397
401
404
TATASTEEL 98 99
100 102 103
TECHM
994
1,018
1,031
1,054
1,067
TITAN 2,556 2,594
2,619
2,657
2,682
ULTRACEMCO
6,195
6,249
6,331
6,385
6,467
UPL
650
682
699
731
748
WIPRO 373 377
380
384
387

www.angelone.in
Technical & Derivatives Report
OCT 21, 2022
*
Technical and Derivatives Team:
Sameet Chavan Chief Analyst – Technical & Derivatives sameet.chavan@angelone.in
Sneha Seth Senior Analyst – Technical & Derivatives sneha.seth@angelone.in
Rajesh Bhosale Technical Analyst rajesh.bhosle@angelone.in
Osho Krishan Senior Analyst – Technical & Derivatives osho.krishan@angelone.in
Research Team Tel: 022 – 39357600 Website: www.angelone.in
For Technical Queries E-mail: technicalresearch-cso@angelone.in
For Derivatives Queries E-mail: derivatives.desk@angelone.in
DISCLAIMER
Angel One Limited (hereinafter referred to as “Angel”) is a registered Member of National Stock Exchange of India Limited, Bombay
Stock Exchange Limited and Metropolitan Stock Exchange Limited. It is also registered as a Depository Participant with CDSL and
Portfolio Manager and investment advisor with SEBI. It also has registration with AMFI as a Mutual Fund Distributor. Angel One
Limited is a registered entity with SEBI for Research Analyst in terms of SEBI (Research Analyst) Regulations, 2014 vide registration
number INH000000164. Angel or its associates has not been debarred/ suspended by SEBI or any other regulatory authority for
accessing /dealing in securities Market.
This document is solely for the personal information of the recipient, and must not be singularly used as the basis of any investment
decision. Nothing in this document should be construed as investment or financial advice. Each recipient of this document should
make such investigations as they deem necessary to arrive at an independent evaluation of an investment in the securities of the
companies referred to in this document (including the merits and risks involved), and should consult their own advisors to determine
the merits and risks of such an investment.
Angel or its associates or research analyst or his relative may have actual/beneficial ownership of 1% or more in the securities of
the subject company at the end of the month immediately preceding the date of publication of the research report. Neither Angel or
its associates nor Research Analysts or his relative has any material conflict of interest at the time of publication of research report.
Angel or its associates might have received any compensation from the companies mentioned in the report during the period
preceding twelve months from the date of this report for services in respect of managing or co-managing public offerings, corporate
finance, investment banking or merchant banking, brokerage services or other advisory service in a merger or specific transaction
in the normal course of business. Angel or its associates did not receive any compensation or other benefits from the companies
mentioned in the report or third party in connection with the research report. Neither Angel nor its research analyst entity has been
engaged in market making activity for the subject company.
Reports based on technical and derivative analysis center on studying charts of a stock's price movement, outstanding positions and
trading volume, as opposed to focusing on a company's fundamentals and, as such, may not match with a report on a company's
fundamentals. Investors are advised to refer the Fundamental and Technical Research Reports available on our website to evaluate
the contrary view, if any.
The information in this document has been printed on the basis of publicly available information, internal data and other reliable
sources believed to be true, but we do not represent that it is accurate or complete and it should not be relied on as such, as this
document is for general guidance only. Angel One Limited or any of its affiliates/ group companies shall not be in any way responsible
for any loss or damage that may arise to any person from any inadvertent error in the information contained in this report. Angel One
Limited has not independently verified all the information contained within this document. Accordingly, we cannot testify, nor make
any representation or warranty, express or implied, to the accuracy, contents or data contained within this document. While Angel
One Limited endeavors to update on a reasonable basis the information discussed in this material, there may be regulatory,
compliance, or other reasons that prevent us from doing so.
This document is being supplied to you solely for your information, and its contents, information or data may not be reproduced,
redistributed or passed on, directly or indirectly.
Neither Angel One Limited, nor its directors, employees or affiliates shall be liable for any loss or damage that may arise from or in
connection with the use of this information. Angel or its associates or Research Analyst or his relative might have financial interest
in the subject company. Research analyst has not served as an officer, director or employee of the subject company.
