SEPT 21, 2022
www.angelone.in
Technical & Derivatives Report
xOOOOOOOO
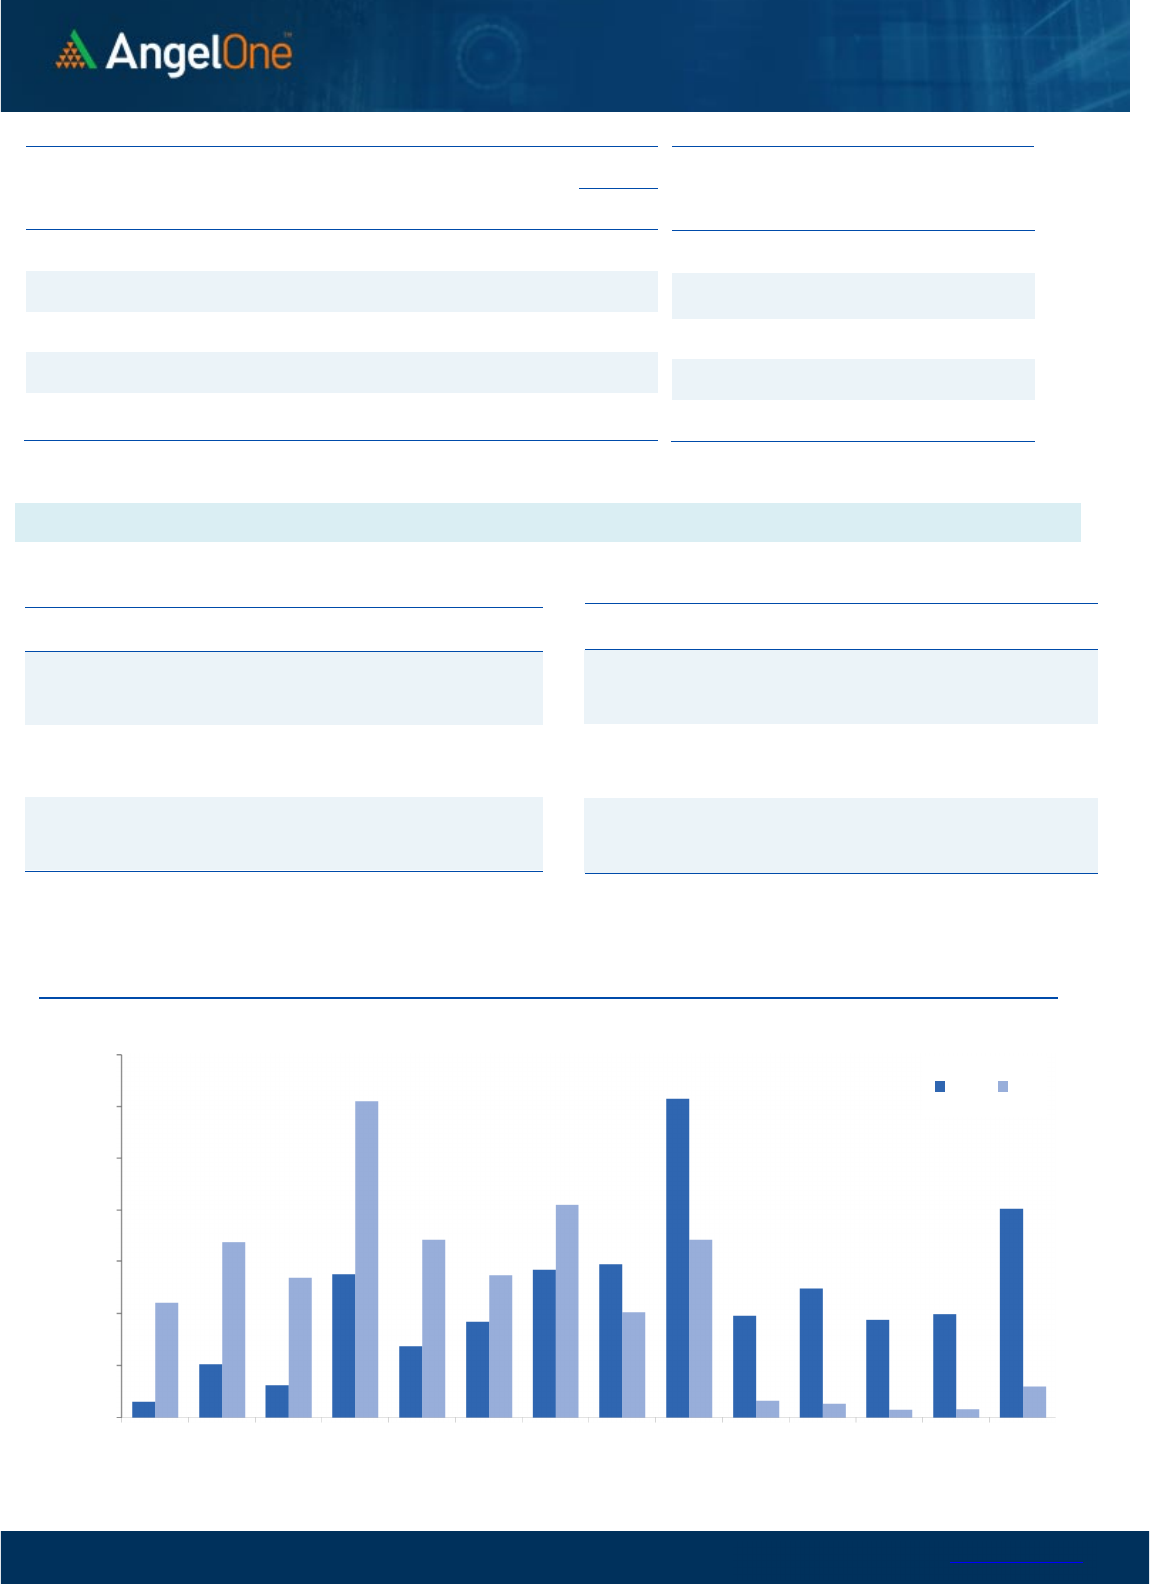
Nifty Bank Outlook (41468)
Bank Nifty as well started with a gap-up opening and as the day
progressed the momentum accelerated beyond the 41600 levels.
As the prices approached the all-time high levels there was some
tentativeness which erased some gains to eventually end with
gains of 1.38% at 41468.
The bulls are back in momentum as the bank index ended at the
highest close ever. Going ahead, the strategy remains of buying on
dips and focusing on stock-specific action. However, in such a
scenario, one should avoid being complacent as we are still not
completely out of woods and the Shooting Star bearish pattern
seen on the weekly chart last week is still active and will get
neglected only once the bank index closes above the 41850 levels.
Also, one should not forget that we are lined up for the key global
event and hence one should avoid aggressive overnight bets and
need to be very selective. As far as levels are concerned, immediate
support is seen at 41100 - 40900 whereas resistance is seen at
41840 - 42000 levels.
Key Levels
Support 1 – 41100 Resistance 1 – 41840
Support 2 – 40900 Resistance 2 – 42000
Exhibit 1: Nifty
Daily
Chart
Exhibit 2: Nifty Bank
Weekly
Chart
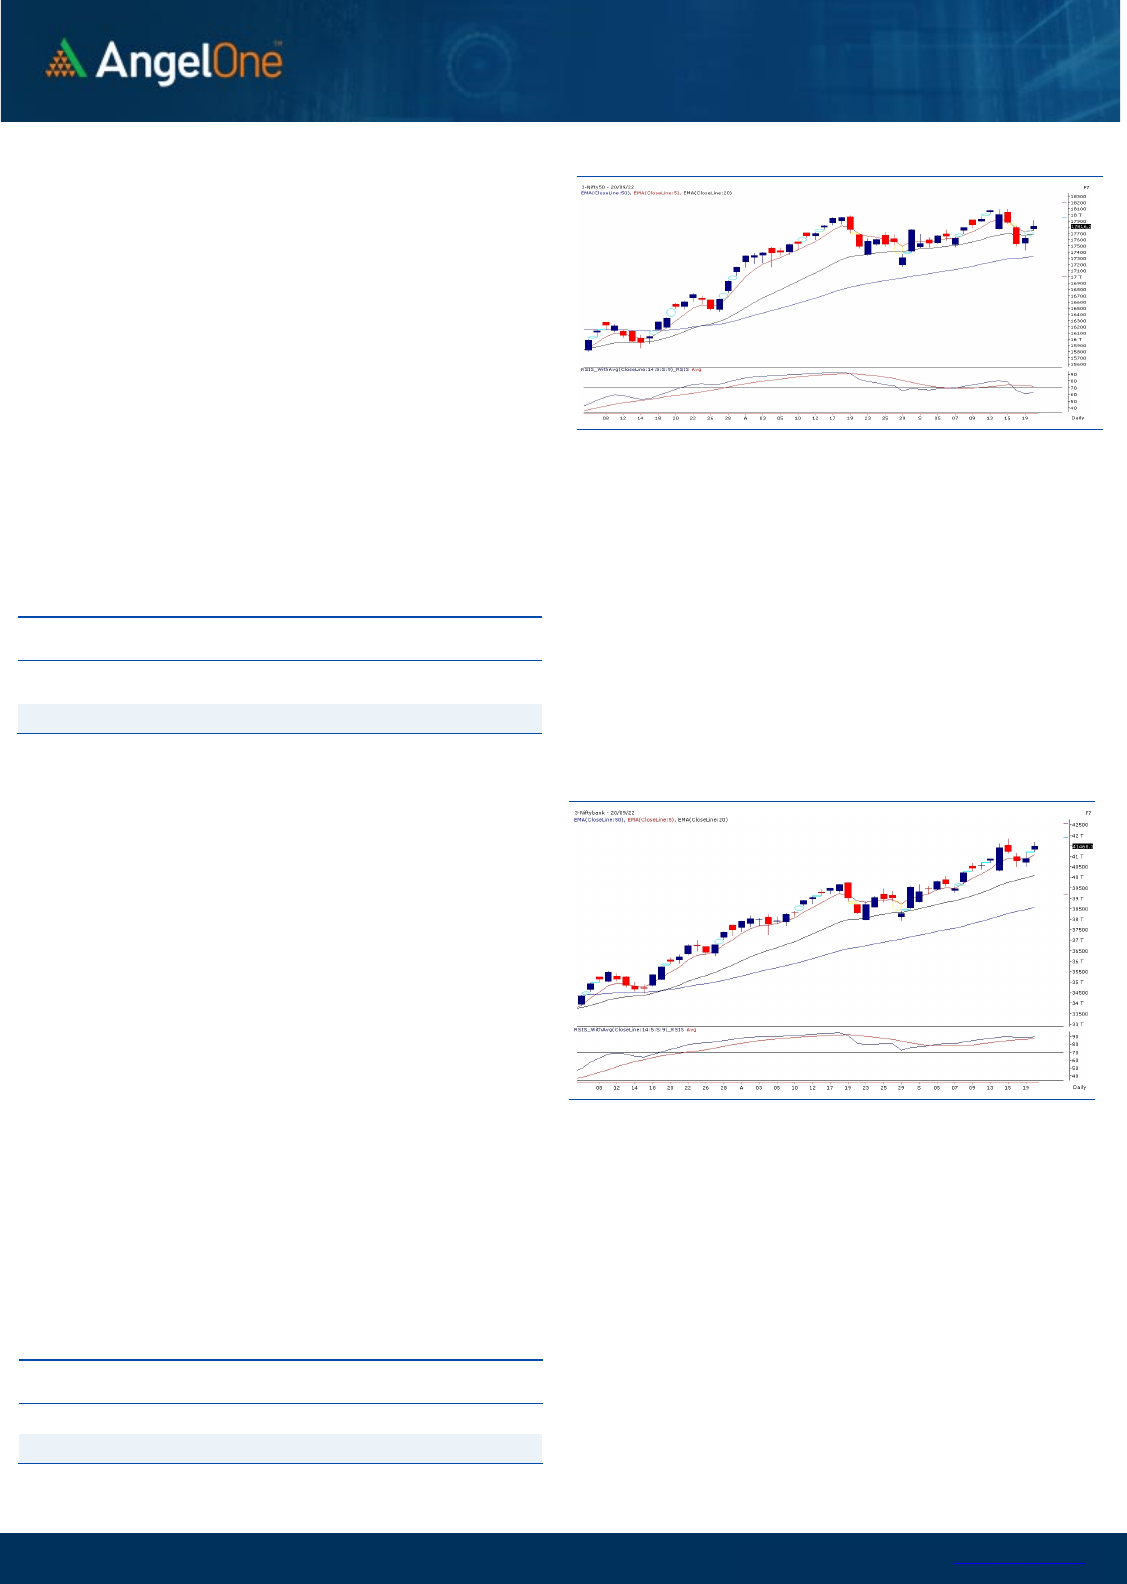
Sensex (59720) / Nifty (17816)
The favorable global markets have embarked optimism to our
equities as we witnessed a decent gap up opening, followed by
across-board buying interest. The benchmark index gradually
inched upwards until a correction triggered in the fag end and pared
down some of the initial gains of the market. At last, post the action-
packed session, the Nifty concluded the day a tad above the 17800
level with a gain of 1.10 percent.
On the technical aspect, a consecutive day of gain certainly
showcased inherent strength, but the tentativeness at the higher
levels portrays the nervousness ahead of the Fed meeting. At the
current juncture, the 17950-18000 zone is likely to be seen as the
sturdy hurdle for the index. While on the downside, the immediate
support is placed around the 17660-17740 odd zone, followed by
the sacrosanct support of the 17500 mark.
Key Levels
Support 1 – 17740 Resistance 1 – 17950
Support 2 – 17660 Resistance 2 – 18000
Hence, looking at index placements and the recent price action
that construes the undertone to favor the bulls, participants are
advised to avoid aggressive bets and stay abreast with global and
domestic developments. Also, we advocate continuing with a
stock-centric approach for better trading opportunities.

www.angelone.in
Technical & Derivatives Report
SEPT 21, 2022
View
We once again had a cheerful start for the day and then
follow-up buying was observed to reclaim 17900 with
an ease. However, due to some profit booking in final
hour of trade we trim some gains and hence we finally
concluded the session with the gains of over a percent.
FIIs were net buyers in the cash market segment to
the tune of Rs. 1196 crores. Simultaneously, in Index
futures, they bought worth Rs. 1844 crores with fall in
open interest, indicating covering of bearish bets.
In F&O space, we observed decent short covering in
Nifty, whereas some fresh long addition was observed
in case of banking index. Stronger hands bought
equities and covered shorts in index futures segment,
which is a positive development. Now, their index
futures Long Short Ratio has improved from 32% to
39%. Interestingly, we saw decent unwinding in ATM
and OTM call strikes along with writing in 17600-17800
put strikes. Considering the above development in
above data, we expect 17600-17700 to act as a strong
base now and on the higher side traders can expect
continuation of ongoing move towards 18000-18100.
Comments
The Nifty futures open interest has decreased by
3.18%. and Bank Nifty futures open interest has
increased by 1.44% as the market closed at 17816.25.
The Nifty Sep future closed with a premium of 5.75
point against a premium of 35.30 point in the last
trading session. The Oct series closed at a premium
of 60.85 point.
The INDIA VIX decreased from 19.94 to 18.79. At the
same time, the PCR-OI of Nifty has increased from
0.94 to 1.15.
Few of the liquid counters where we have seen high
cost of carry are IDEA, IBULHSGFIN, GMRINFRA, CUB
and ABB.
Historical Volatility
SCRIP HV
IDEA 81.26
IBULHSGFIN 72.97
RBLBANK 72.53
ZEEL 63.90
HINDCOPPER 62.70
Nifty Vs OI
17200
17300
17400
17500
17600
17700
17800
17900
18000
18100
18200
11,500
12,000
12,500
13,000
13,500
14,000
14,500
15,000
9/5 9/7 9/9 9/13 9/15 9/19
Openinterest Nifty
OI Gainers
SCRIP OI
OI
CHG. (%)
PRICE
PRICE
CHG. (%)
CANFINHOME 5966025 80.61 565.35 -3.93
CIPLA 8585850 14.61 1092.30 4.83
GUJGASLTD 6558750 13.01 503.15 0.24
RAIN 13394500 12.13 181.20 4.47
JKCEMENT 452250 10.91 2909.45 3.18
HONAUT 15885 9.06 40709.90 0.51
LAURUSLABS 6722100 7.95 527.65 3.92
ALKEM 483200 7.09 3319.70 2.25
OI Losers
SCRIP OI
OI
CHG. (%)
PRICE
PRICE
CHG. (%)
ESCORTS 1864500 -15.90 2095.20 -0.25
HEROMOTOCO 2686500 -8.91 2771.55 2.77
INDIACEM 14421700 -8.42 283.45 -2.11
MCX 3313200 -6.21 1284.25 5.02
IRCTC 13767250 -6.10 706.15 2.80
APOLLOTYRE 14210000 -5.78 288.20 -0.33
IPCALAB 1600300 -5.53 871.45 1.72
HINDALCO 29055100 -5.23 421.45 2.32
Put-Call Ratio
SCRIP PCR (OI) PCR (VOL)
NIFTY 1.15 0.90
BANKNIFTY 1.07 0.85
RELIANCE 0.47 0.43
ICICIBANK 0.71 0.61
INFY 0.37 0.39
www.angelone.in
Technical & Derivatives Report
SEPT 21, 2022
Note: Above mentioned Bullish or Bearish Spreads in Nifty (Sep Series) are given as an information and not as a recommendation.
Nifty Spot =
1
7
,
816.25
FII Statistics for
September
20
, 2022
Detail Buy
Contracts
Open
Interest
Value
(in Cr.)
Sell
Net
CHANGE
INDEX
FUTURES
4363.69 2519.66 1844.03
110753 10480.40 (11.70)
INDEX
OPTIONS
667020.18 665509.36 1510.82
1389019 129350.32 (0.28)
STOCK
FUTURES
12214.51 11026.91 1187.60
2160691 152803.01 (0.76)
STOCK
OPTIONS
11143.99 11085.63 58.36
205805 14980.08 (0.66)
Total 694742.37
690141.56
4600.81
3866268
307613.81
(0.93)
Turnover on
September
20
, 2022
Instrument
No. of
Contracts
Turnover
( in Cr. )
Change
(%)
Index
Futures
366661 34884.43 3.68
Index
Options
115757401
10674730.65
19.64
Stock
Futures
922128 68253.77 0.37
Stock
Options
4376995 339325.67 6.02
Total
4,376,995
339325.67 18.98
Bull-Call Spreads
Action Strike Price Risk Reward BEP
Buy
17800 221.65
51.10
48.90
17851.10
Sell
17900 170.55
Buy
17800 221.65
95.40
104.60
17895.40
Sell
18000 126.25
Buy
17900 170.55
44.30 55.70 17944.30
Sell 18000 126.25
Bear
-
Put Spreads
Action Strike Price Risk Reward BEP
Buy 17800 197.50
42.75
57.25
17757.25
Sell
17700 154.75
Buy 17800 197.50
75.40
124.60
17724.60
Sell 17600 122.10
Buy
17700 154.75
32.65 67.35 17667.35
Sell 17600 122.10
Nifty Put
-
Call Analysis
,0
500,000
1000,000
1500,000
2000,000
2500,000
3000,000
3500,000
17200 17300 17400 17500 17600 17700 17800 17900 18000 18100 18200 18300 18400 18500
Call Put

www.angelone.in
Technical & Derivatives Report
SEPT 21, 2022
`
Daily Pivot Levels for Nifty Constituents
Scrips
S2
S1
PIVOT
R1 R2
ADANIPORTS
954
962
975
983
996
APOLLOHOSP
4,212
4,386
4,490
4,664
4,769
ASIANPAINT 3,303 3,348
3,379
3,424
3,455
AXISBANK 796 804
810 819
825
BAJAJ-AUTO 3,684 3,726
3,767
3,809
3,850
BAJFINANCE 7,488 7,562
7,638 7,712 7,788
BAJAJFINSV
1,765
1,782
1,798
1,815
1,830
BPCL
319
321
324
326
329
BHARTIARTL 779 786
791
798
803
BRITANNIA
3,576
3,613
3,639
3,676
3,702
CIPLA 1,018 1,055
1,076
1,113
1,135
COALINDIA 226 228
231
233
236
DIVISLAB
3,596
3,614
3,633
3,651
3,670
DRREDDY 4,055 4,135
4,187
4,267
4,319
EICHERMOT
3,572
3,642
3,690
3,760
3,808
GRASIM 1,710 1,726
1,747
1,763
1,784
HCLTECH
893
904
912
923
931
HDFCBANK
1,504
1,512
1,518
1,527
1,532
HDFCLIFE
540
550
557
567
575
HDFC 2,435 2,461
2,477
2,503
2,519
HEROMOTOCO
2,661
2,716
2,770
2,825 2,878
HINDALCO 410 416
422
427
433
HINDUNILVR 2,553 2,568
2,595 2,610
2,637
ICICIBANK
900
909
916
924
931
INDUSINDBK
1,224
1,244
1,260
1,280
1,296
INFY
1,367
1,378
1,396
1,406
1,424
ITC
332
334
337
339 341
JSW STEEL
674
681
690
697
706
KOTAKBANK 1,916 1,928
1,945
1,957
1,974
LT
1,907
1,920
1,938
1,951
1,969
M&M
1,288
1,296
1,304
1,311
1,319
MARUTI
9,147
9,224
9,327
9,404 9,507
NESTLEIND
18,359
18,488
18,704
18,833
19,049
NTPC
170
171
172
173
174
ONGC 130 132
133
134 135
POWERGRID
230
231
234
235
238
RELIANCE 2,469 2,486
2,512
2,529
2,555
SBILIFE
1,297
1,303
1,313 1,319
1,329
SHREECEM
22,351
22,797
23,260 23,706
24,169
SBIN
570
572
575
577
580
SUNPHARMA
863
888
901
926
939
TCS 3,000 3,020
3,050 3,070
3,100
TATACONSUM
787
796
804
813 821
TATAMOTORS
423
429
436
442
449
TATASTEEL 103 104
105
107
108
TECHM
1,042
1,049
1,057
1,065
1,073
TITAN
2,612
2,648
2,671
2,707
2,729
ULTRACEMCO
6,397
6,441
6,502 6,546
6,607
UPL
710
715
719
724
729
WIPRO 401 403
406
408
411

www.angelone.in
Technical & Derivatives Report
SEPT 21, 2022
*
Technical and Derivatives Team:
Sameet Chavan Chief Analyst – Technical & Derivatives sameet.chavan@angelone.in
Sneha Seth Senior Analyst – Technical & Derivatives sneha.seth@angelone.in
Rajesh Bhosale Technical Analyst rajesh.bhosle@angelone.in
Osho Krishan Senior Analyst – Technical & Derivatives osho.krishan@angelone.in
Research Team Tel: 022 – 39357600 Website: www.angelone.in
For Technical Queries E-mail: technicalresearch-cso@angelone.in
For Derivatives Queries E-mail: derivatives.desk@angelone.in
DISCLAIMER
Angel One Limited (hereinafter referred to as “Angel”) is a registered Member of National Stock Exchange of India Limited, Bombay
Stock Exchange Limited and Metropolitan Stock Exchange Limited. It is also registered as a Depository Participant with CDSL and
Portfolio Manager and investment advisor with SEBI. It also has registration with AMFI as a Mutual Fund Distributor. Angel One
Limited is a registered entity with SEBI for Research Analyst in terms of SEBI (Research Analyst) Regulations, 2014 vide registration
number INH000000164. Angel or its associates has not been debarred/ suspended by SEBI or any other regulatory authority for
accessing /dealing in securities Market.
This document is solely for the personal information of the recipient, and must not be singularly used as the basis of any investment
decision. Nothing in this document should be construed as investment or financial advice. Each recipient of this document should
make such investigations as they deem necessary to arrive at an independent evaluation of an investment in the securities of the
companies referred to in this document (including the merits and risks involved), and should consult their own advisors to determine
the merits and risks of such an investment.
Angel or its associates or research analyst or his relative may have actual/beneficial ownership of 1% or more in the securities of
the subject company at the end of the month immediately preceding the date of publication of the research report. Neither Angel or
its associates nor Research Analysts or his relative has any material conflict of interest at the time of publication of research report.
Angel or its associates might have received any compensation from the companies mentioned in the report during the period
preceding twelve months from the date of this report for services in respect of managing or co-managing public offerings, corporate
finance, investment banking or merchant banking, brokerage services or other advisory service in a merger or specific transaction
in the normal course of business. Angel or its associates did not receive any compensation or other benefits from the companies
mentioned in the report or third party in connection with the research report. Neither Angel nor its research analyst entity has been
engaged in market making activity for the subject company.
Reports based on technical and derivative analysis center on studying charts of a stock's price movement, outstanding positions and
trading volume, as opposed to focusing on a company's fundamentals and, as such, may not match with a report on a company's
fundamentals. Investors are advised to refer the Fundamental and Technical Research Reports available on our website to evaluate
the contrary view, if any.
The information in this document has been printed on the basis of publicly available information, internal data and other reliable
sources believed to be true, but we do not represent that it is accurate or complete and it should not be relied on as such, as this
document is for general guidance only. Angel One Limited or any of its affiliates/ group companies shall not be in any way responsible
for any loss or damage that may arise to any person from any inadvertent error in the information contained in this report. Angel One
Limited has not independently verified all the information contained within this document. Accordingly, we cannot testify, nor make
any representation or warranty, express or implied, to the accuracy, contents or data contained within this document. While Angel
One Limited endeavors to update on a reasonable basis the information discussed in this material, there may be regulatory,
compliance, or other reasons that prevent us from doing so.
This document is being supplied to you solely for your information, and its contents, information or data may not be reproduced,
redistributed or passed on, directly or indirectly.
Neither Angel One Limited, nor its directors, employees or affiliates shall be liable for any loss or damage that may arise from or in
connection with the use of this information. Angel or its associates or Research Analyst or his relative might have financial interest
in the subject company. Research analyst has not served as an officer, director or employee of the subject company.
