March 21, 2023
www.angelone.in
Technical & Derivatives Report
Nifty Bank
Outlook (
39
362
)
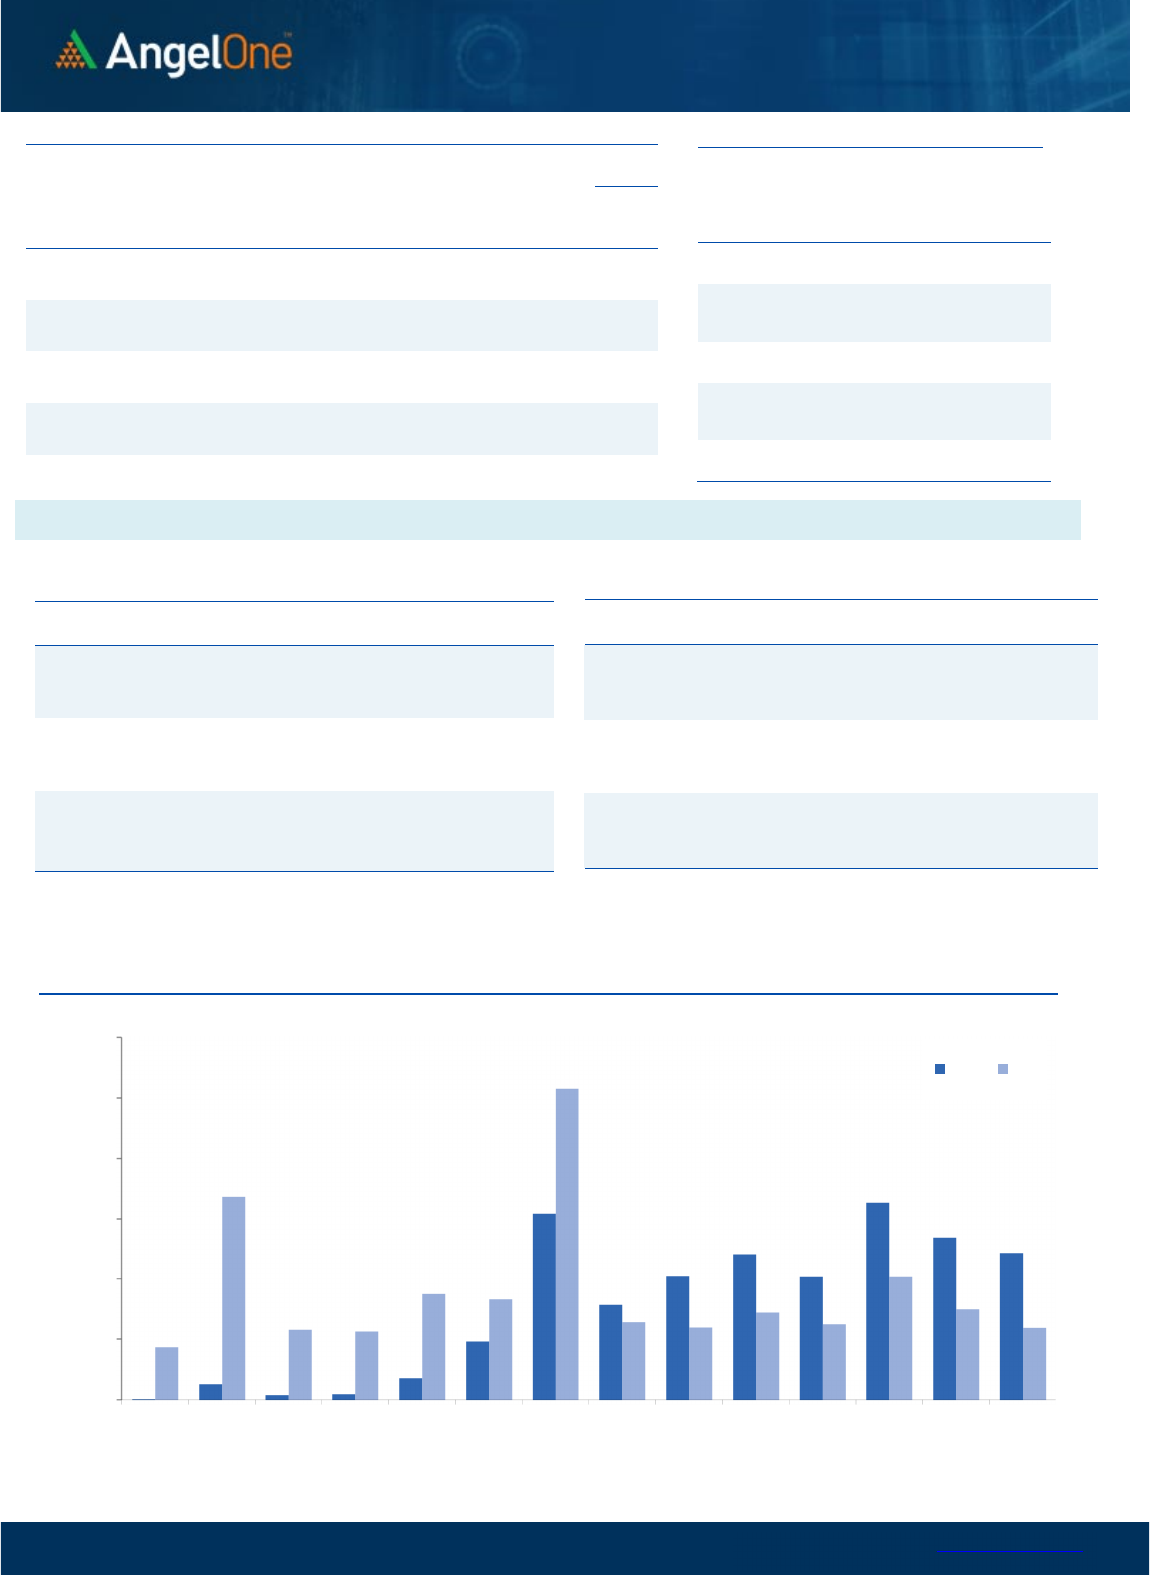
The Bank Nifty commenced the day with negative momentum,
following the broader market trend, and plummeted to test
Friday's lows. However, there was a late rally that recouped
significant losses, and it ended the day down by 0.60% at 39362.
Despite the benchmark dropping below Thursday's lows, the Bank
Index was relatively resilient, finding support around Friday's lows.
The RSI oscillator exhibits positive divergence, and a Tweezer
Bottom formation indicates a strong support at 38900, followed by
38600. On the hourly chart, there are early indications of an
"Inverse Head and Shoulders" pattern, which could signal a much-
awaited market rebound if there is a sustained move beyond
39700. Traders are advised to monitor these levels and trade
accordingly.
Key Levels
Support 1 – 38900 Resistance 1 – 39700
Support 2 – 38600 Resistance 2 – 40000
Exhibit 1: Nifty Daily Chart
Exhibit 2: Nifty Bank Daily Chart
Sensex (
5
7
629
) / Nifty (
16988
)
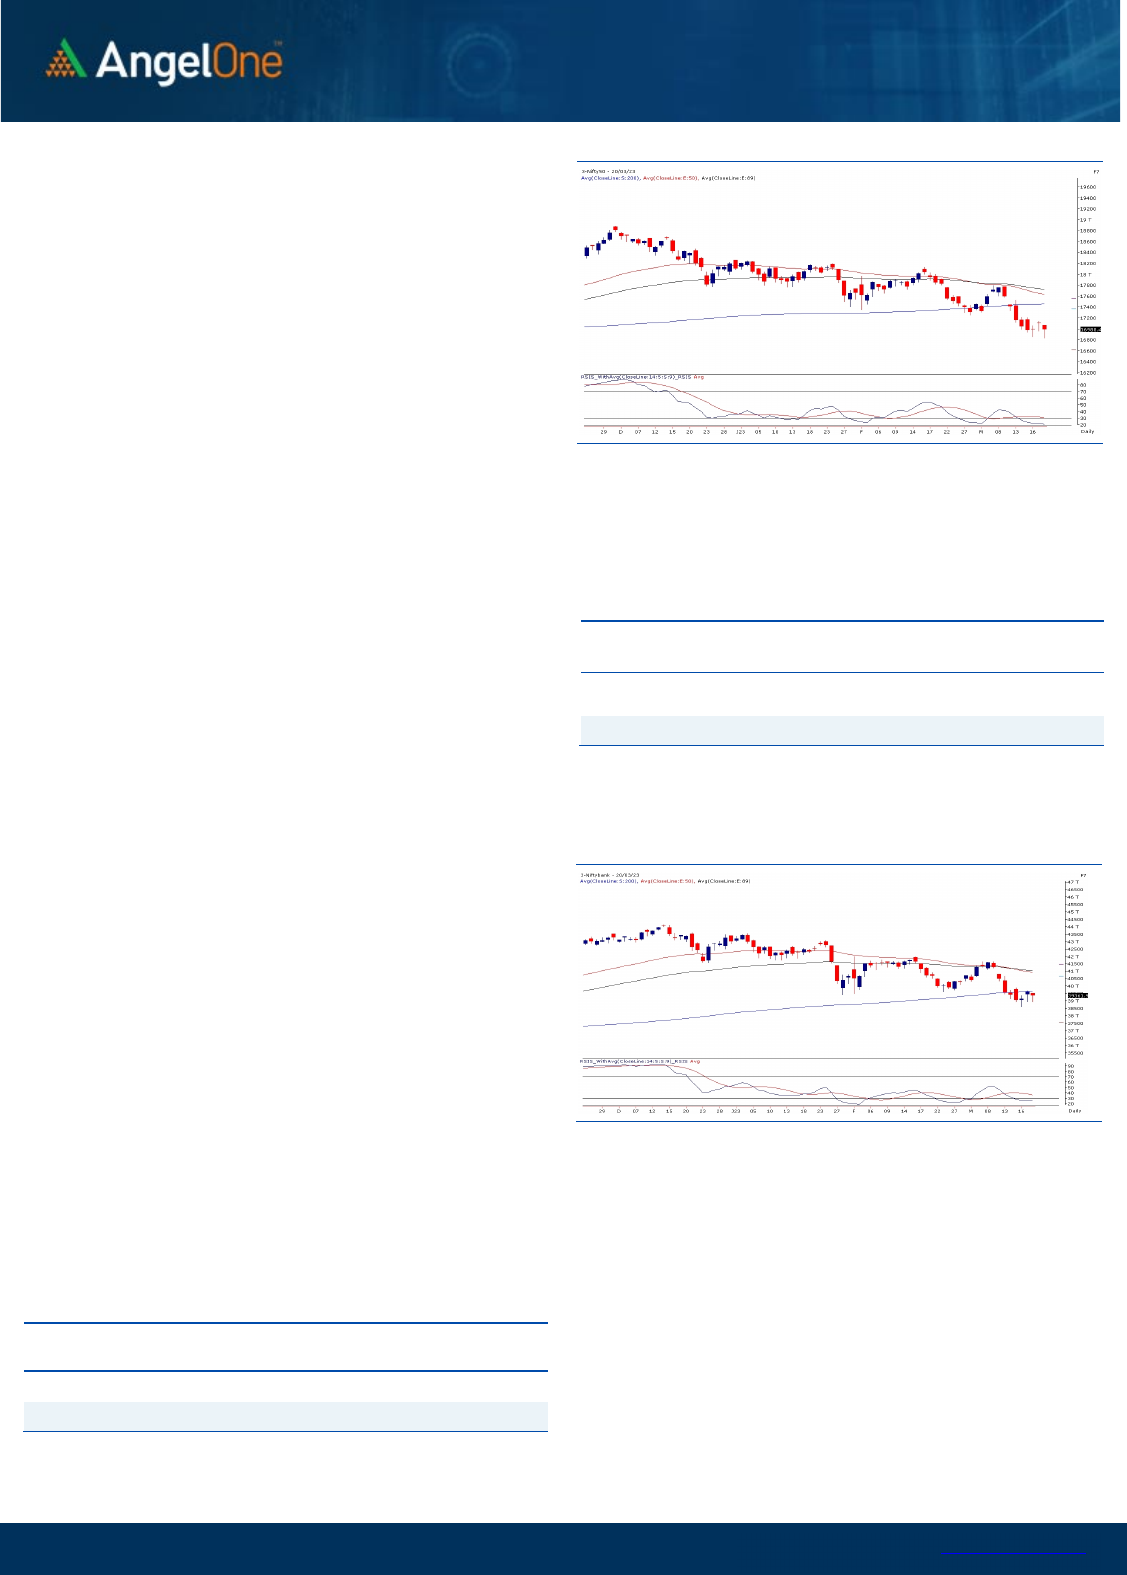
Despite SGX was indicating a sluggish start, our markets opened
marginally in the red. However, without wasting much of a time, the
selling resumed across the broader market. The Nifty kept on
sinking to not only slide below 17000 but also went on to challenge
the Thursday’s low of 16850. Fortunately, some buying emerged
after posting a low of 16828 around the midsession. The recovery
extended towards the fag end to reduce the damage to merely
0.65%, a tad below the 17000 mark.
Globally, the mounting concerns over few banks have risen in last
few days and market is clearly jolting with every piece of
information with respect to this development. The tail end recovery
yesterday was quite crucial for our market, and any follow up in
coming session would certainly augur well for the bulls. As far as
levels are concerned, 17150 is to be seen as key hurdle, because any
sustainable move above this would provide some sigh of relief for
optimist traders. This is possible only if we see strong relief move in
the global markets. On the flipside, 16900 followed by 16800 is to
be seen as a sacrosanct support zone. Markets are extremely
oversold, and we are placed around a cluster of supports, hence we
continue to remain hopeful and expect some respite in coming
days.
As a caveat, one should avoid aggressive bets and should keep a
close tab on global developments, because such financial issues
can be very lethal at times. In case of a relief, we may find ample
opportunities in the beaten spaces. Traders can certainly focus
on such potential candidates.
Key Levels
Support 1 – 16900 Resistance 1 – 17080
Support 2 – 16800 Resistance 2 – 17150

www.angelone.in
Technical & Derivatives Report
March 21, 2023
View
Our market started the week on a bleak note, taking
cues from weak global cues. The benchmark index
Nifty50 plunged below the recent lows, but
fortunately, some buying emerged towards the fag
end to make a modest recovery and Nifty settled a
tad below the 17000 mark.
FIIs were net sellers in the cash market segment to
the tune of Rs. 2546 crores. Simultaneously, in Index
futures, they sold worth Rs. 1996 crores with an
increase in open interest, indicating short addition.
In the F&O space, we witnessed fresh short
formation in both key indices at the start of the
week. On the options front, a decent pile up of
positions is seen at 16900-17000 put strikes,
suggesting immediate support. On the flip side, the
17200-call strike holds the highest OI concentration,
followed by 17000 CE, which could act as immediate
hurdles. Stronger hands continue with their selling
streak in equities and index futures. Their ‘Long Short
Ratio’ has plunged to 9% from 10%. Data suggests
our markets are extremely oversold; hence, traders
should avoid any bearish bets in the system.
Comments
The Nifty futures open interest has increased by 6.28%
and Bank Nifty futures open interest has increased by
3.20% as the market closed at 16988.40.
The Nifty March future closed with a premium of 40.50
point against a premium of 78.10 point in the last
trading session. The April series closed at a premium of
133.20 point.
The INDIA VIX has increased from 14.76 to 16.00. At the
same time, the PCR-OI of Nifty has decreased from 0.88
to 0.83.
Few of the liquid counters where we have seen high
cost of carry are BALRAMCHIN, HAL, BAJAJFINSV, MFSL
and PEL.
Historical Volatility
SCRIP HV
ADANIENT 94.02
IDEA 69.80
IBULHSGFIN 66.38
RBLBANK 63.32
ADANIPORTS 59.54
Nifty Vs OI
16600
16800
17000
17200
17400
17600
17800
18000
2,000
4,000
6,000
8,000
10,000
12,000
14,000
16,000
18,000
20,000
3/1 3/3 3/8 3/10 3/14 3/16 3/20
Openinterest Nifty
OI Gainers
SCRIP OI
OI
CHG. (%)
PRICE
PRICE
CHG. (%)
GAIL 78598500 17.35 109.80 -0.27
INDIACEM 17861100 12.86 178.05 -5.41
RAMCOCEM 2767600 9.34 719.10 -0.57
HDFCAMC 3782700 9.31 1680.15 -0.08
VOLTAS 5451000 8.54 850.95 -3.48
BAJAJ-AUTO 1425000 8.45 3804.95 -0.14
PVR 2404149 8.05 1546.05 -1.90
HAL 3534000 7.61 2644.80 -4.86
OI Losers
SCRIP OI
OI
CHG. (%)
PRICE
PRICE
CHG. (%)
M&MFIN 17600 -6.97 225.50 -4.27
BOSCHLTD 145750 -6.84 18139.15 -0.01
AUROPHARMA 13933000 -5.76 474.30 -0.96
ZYDUSLIFE 6849000 -5.32 476.20 -0.21
ONGC 31750950 -5.03 152.30 -0.94
NAVINFLUOR 504900 -4.94 4211.80 0.23
TRENT 3338800 -4.82 1344.40 -1.15
BALRAMCHIN 6740800 -4.27 361.70 -6.74
Put-Call Ratio
SCRIP PCR (OI) PCR (VOL)
NIFTY 0.83 0.89
BANKNIFTY 0.78 1.03
RELIANCE 0.47 0.45
ICICIBANK 0.59 0.65
INFY 0.43 0.55
www.angelone.in
Technical & Derivatives Report
March 21, 2023
Note: Above mentioned Bullish or Bearish Spreads in Nifty (March Series) are given as an information and not as a recommendation.
Nifty Spot =
1
6988
.
40
0900
Lot Size = 75
FII Statistics for
March
20
, 202
3
Detail Buy
Contracts
Open
Interest
Value
(in Cr.)
Sell
Net
CHANGE
INDEX
FUTURES
4820.71 6817.12 (1996.41) 235156 20821.29 9.05
INDEX
OPTIONS
1360685.55 1369105.69 (8420.14) 2909517 256506.85 5.53
STOCK
FUTURES
9803.45 12023.64 (2220.19) 2245136 144372.05 1.05
STOCK
OPTIONS
13832.91 13641.10 191.81
188980 12103.95 2.83
Total 1389142.62
1401587.55
(12444.93) 5578789
433804.14
3.73
Turnover
on
March
20
, 202
3
Instrument
No. of
Contracts
Turnover
( in Cr. )
Change
(%)
Index Futures
524903 47771.70 25.44
Index
Options
196419818
75252.30 50.36
Stock Futures
826715 52785.02 13.66
Stock
Options
3676614 2809.47 -6.61
Total
36,76,614 2809.47 29.83
Bull-Call Spreads
Action Strike Price Risk Reward BEP
Buy
17000 189.85
53.80
46.20
17053.80
Sell
17100 136.05
Buy
17000 189.85
96.30
103.70
17096.30
Sell
17200 93.55
Buy
17100 136.05
42.50 57.50 17142.50
Sell
17200 93.55
Bear-Put Spreads
Action Strike Price Risk Reward BEP
Buy
17100 210.75
49.00
51.00
17051.00
Sell 17000 161.75
Buy 17100 210.75
86.20
113.80
17013.80
Sell
16900 124.55
Buy
17000 161.75
37.20 62.80 16962.80
Sell 16900 124.55
Nifty Put-Call Analysis
,0
1000,000
2000,000
3000,000
4000,000
5000,000
6000,000
16400 16500 16600 16700 16800 16900 17000 17100 17200 17300 17400 17500 17600 17700
Call Put

www.angelone.in
Technical & Derivatives Report
March 21, 2023
`
Daily
Pivot Levels for Nifty Constituents
Scrips
S2
S1
PIVOT
R1
R2
ADANIENT
1,738
1,772
1,811
1,844
1,883
ADANIPORTS 649 658
668
677
686
APOLLOHOSP
4,128
4,221
4,287
4,380
4,446
ASIANPAINT
2,783
2,819
2,867
2,903
2,951
AXISBANK 819 828
835
844
850
BAJAJ-AUTO
3,759
3,782
3,808
3,832
3,858
BAJFINANCE
5,338
5,444
5,592
5,699
5,847
BAJAJFINSV
1,185
1,215
1,261
1,292
1,338
BPCL 347 353
357
364
368
BHARTIARTL 743 749
754
760
765
BRITANNIA
4,216
4,274
4,320
4,378
4,424
CIPLA 853 860
868
875
884
COALINDIA 212 215
218
221
224
DIVISLAB
2,763
2,782
2,806
2,824
2,849
DRREDDY
4,380
4,410
4,452
4,481
4,523
EICHERMOT
2,870
2,911
2,950
2,992
3,031
GRASIM
1,533
1,563
1,581
1,611
1,629
HCLTECH
1,073
1,082
1,095
1,104
1,117
HDFCBANK
1,536
1,549
1,558
1,571
1,581
HDFCLIFE
452
458
465
472
478
HDFC
2,510
2,532
2,555
2,577
2,600
HEROMOTOCO
2,281
2,310
2,333
2,363
2,386
HINDALCO 374 380
387
393
400
HINDUNILVR
2,393
2,452
2,484
2,544
2,576
ICICIBANK 820 828
833
841
846
INDUSINDBK 974 988
1,004
1,018
1,034
INFY
1,368
1,386
1,403
1,421
1,438
ITC 369 374
377
381
384
JSW STEEL 654 661
667
674
680
KOTAKBANK
1,673
1,686
1,695
1,708
1,716
LT
2,125
2,151
2,178
2,204
2,231
M&M
1,130
1,149
1,164
1,183
1,198
MARUTI
8,035
8,127
8,222
8,314
8,409
NESTLEIND
18,522
18,730
18,860
19,068
19,198
NTPC 174 175
176
177
179
ONGC 150 151
153
154
155
POWERGRID 223 225
227
230
232
RELIANCE
2,160
2,181
2,200
2,221
2,240
SBILIFE
1,037
1,055
1,073
1,091
1,109
SBIN 509 514
520
526
532
SUNPHARMA 942 951
957
967
972
TCS
3,061
3,102
3,136
3,177
3,211
TATACONSUM
684 693
700
709
716
TATAMOTORS 400 405
411
417
423
TATASTEEL 102 103
105
106
108
TECHM
1,073
1,091
1,114
1,132
1,155
TITAN
2,425
2,443
2,459
2,476
2,492
ULTRACEMCO
7,022
7,133
7,209
7,319
7,395
UPL 693 701
708
715
722
WIPRO 359 363
369
374
380

www.angelone.in
Technical & Derivatives Report
March 21, 2023
*
Technical and Derivatives Team:
Sameet Chavan Chief Analyst – Technical & Derivatives sameet.chavan@angelone.in
Sneha Seth Senior Analyst – Technical & Derivatives sneha.seth@angelone.in
Rajesh Bhosale Technical Analyst rajesh.bhosle@angelone.in
Osho Krishan Senior Analyst – Technical & Derivatives osho.krishan@angelone.in
Research Team Tel: 022 – 39357600 Website: www.angelone.in
For Technical Queries E-mail: technicalresearch-cso@angelone.in
For Derivatives Queries E-mail: derivatives.desk@angelone.in
DISCLAIMER
Angel One Limited (hereinafter referred to as “Angel”) is a registered Member of National Stock Exchange of India Limited, Bombay Stock Exchange
Limited and Metropolitan Stock Exchange Limited. It is also registered as a Depository Participant with CDSL and Portfolio Manager and investment
advisor with SEBI. It also has registration with AMFI as a Mutual Fund Distributor. Angel One Limited is a registered entity with SEBI for Research
Analyst in terms of SEBI (Research Analyst) Regulations, 2014 vide registration number INH000000164. Angel or its associates has not been
debarred/ suspended by SEBI or any other regulatory authority for accessing /dealing in securities Market.
This document is solely for the personal information of the recipient, and must not be singularly used as the basis of any investment decision.
Nothing in this document should be construed as investment or financial advice. Each recipient of this document should make such investigations
as they deem necessary to arrive at an independent evaluation of an investment in the securities of the companies referred to in this document
(including the merits and risks involved), and should consult their own advisors to determine the merits and risks of such an investment.
Angel or its associates or research analyst or his relative may have actual/beneficial ownership of 1% or more in the securities of the subject
company at the end of the month immediately preceding the date of publication of the research report. Neither Angel or its associates nor
Research Analysts or his relative has any material conflict of interest at the time of publication of research report.
Angel or its associates might have received any compensation from the companies mentioned in the report during the period preceding twelve
months from the date of this report for services in respect of managing or co-managing public offerings, corporate finance, investment banking or
merchant banking, brokerage services or other advisory service in a merger or specific transaction in the normal course of business. Angel or its
associates did not receive any compensation or other benefits from the companies mentioned in the report or third party in connection with the
research report. Neither Angel nor its research analyst entity has been engaged in market making activity for the subject company.
Reports based on technical and derivative analysis center on studying charts of a stock's price movement, outstanding positions and trading
volume, as opposed to focusing on a company's fundamentals and, as such, may not match with a report on a company's fundamentals. Investors
are advised to refer the Fundamental and Technical Research Reports available on our website to evaluate the contrary view, if any.
The information in this document has been printed on the basis of publicly available information, internal data and other reliable sources believed
to be true, but we do not represent that it is accurate or complete and it should not be relied on as such, as this document is for general guidance
only. Angel One Limited or any of its affiliates/ group companies shall not be in any way responsible for any loss or damage that may arise to any
person from any inadvertent error in the information contained in this report. Angel One Limited has not independently verified all the information
contained within this document. Accordingly, we cannot testify, nor make any representation or warranty, express or implied, to the accuracy,
contents or data contained within this document. While Angel One Limited endeavors to update on a reasonable basis the information discussed
in this material, there may be regulatory, compliance, or other reasons that prevent us from doing so.
This document is being supplied to you solely for your information, and its contents, information or data may not be reproduced, redistributed or
passed on, directly or indirectly.
Neither Angel One Limited, nor its directors, employees or affiliates shall be liable for any loss or damage that may arise from or in connection
with the use of this information. Angel or its associates or Research Analyst or his relative might have financial interest in the subject company.
Research analyst has not served as an officer, director or employee of the subject company.
