October
20
, 2023
www.angelone.in
Technical & Derivatives Report
8
Nifty Bank
Outlook (
4
3
754
)
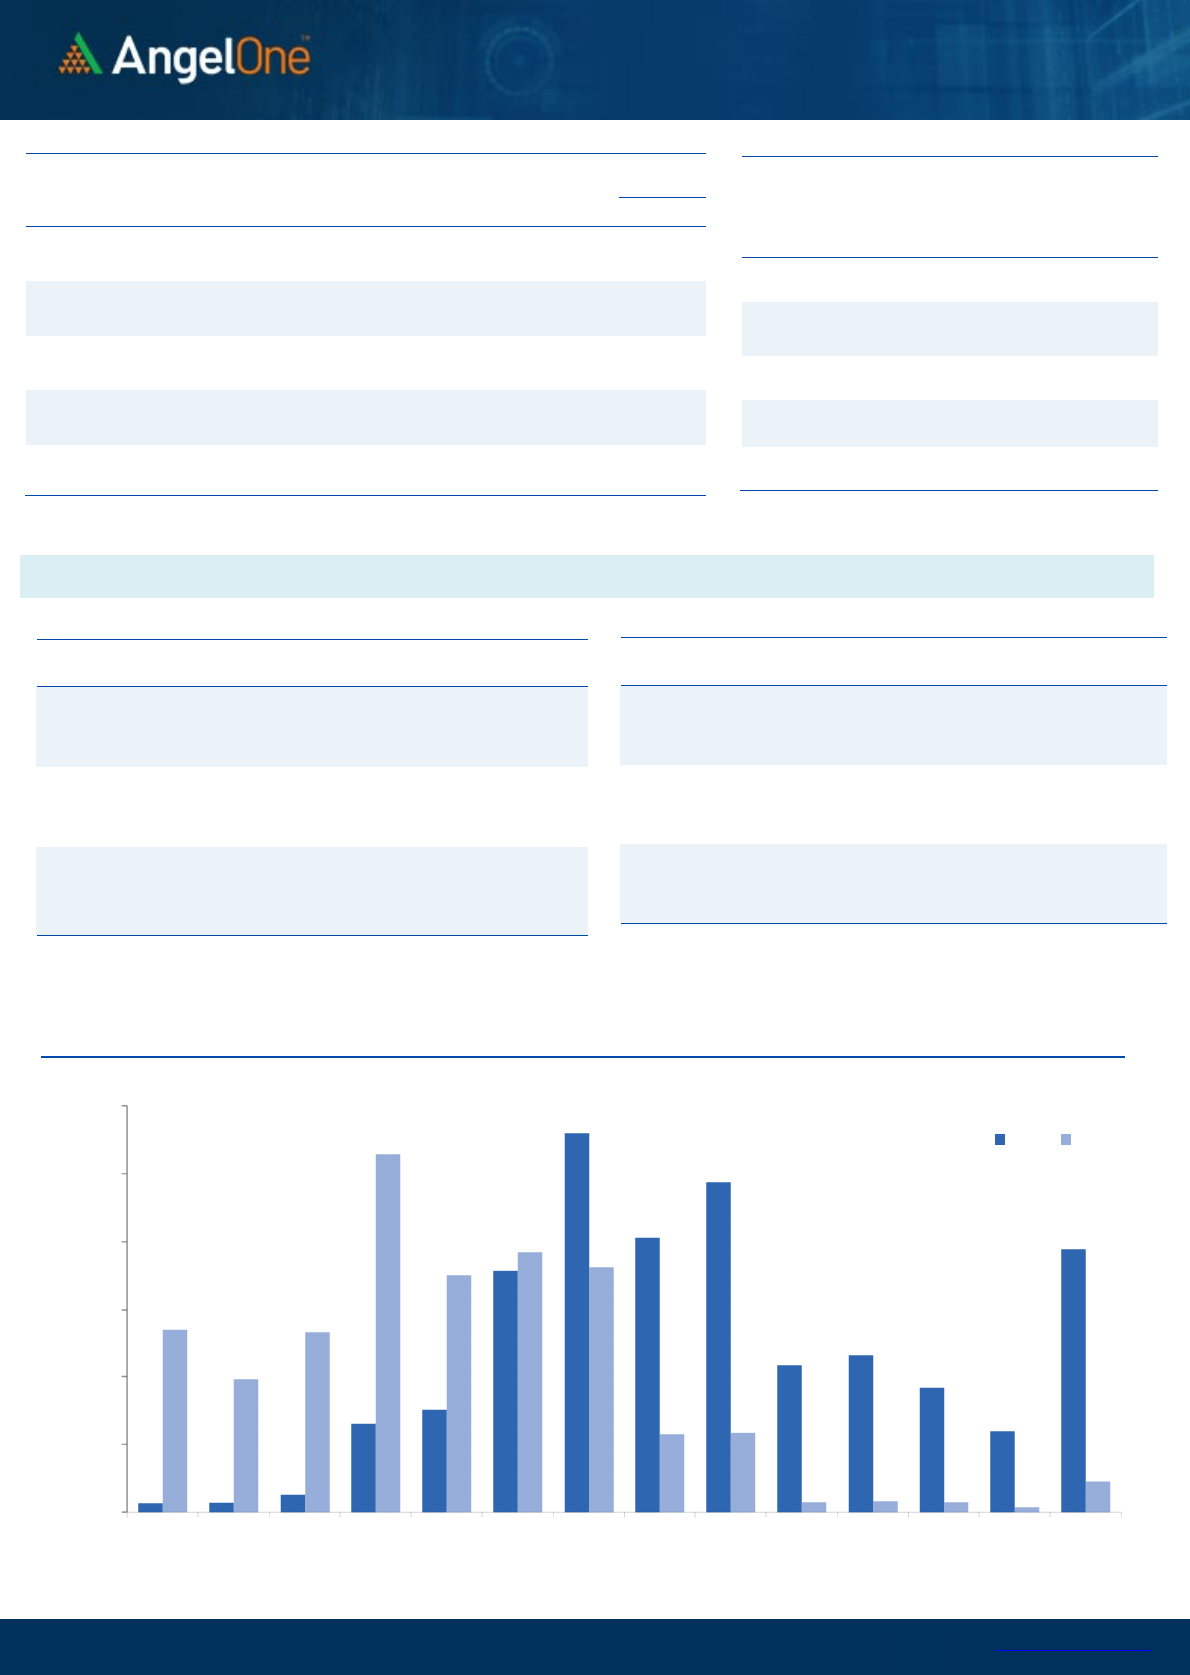
In response to negative global cues, Bank Nifty, along with other major
indices commenced the day on a pessimistic note. However, as the
index approached its significant support clusters, buyers, sensing a
lucrative buying opportunity, sprung into action and propelled the
index higher towards 44000. Later in the day, the index experienced
back and forth movements, consolidating within a narrow range, only
to witness some selling towards the fag end of the day. Eventually,
Bank Nifty closed for the day a tad above 43750, losing three-tenths
of a percent.
From a technical perspective, the structure of this rate-sensitive index
doesn’t inspire an encouraging outlook. On its daily chart, the index
has ultimately broken and closed below the realms of its lower trading
range, as we have discussed in our earlier write-ups, signalling further
weakness. Nonetheless, it’s worth noting that the index did stage a
minor intra-day recovery, but such movements are reminiscent of
oversold markets and traders should exercise caution and not be
overly emboldened by them. Participants would be better positioned;
if they capitalized such intra day moves to sell at higher until the
markets clearly signal a reversal.
Exhibit 1: Nifty Daily Chart
Exhibit 2: Nifty Bank Daily Chart
Sensex (
6
5
629
) / Nifty (
19
6
25
)
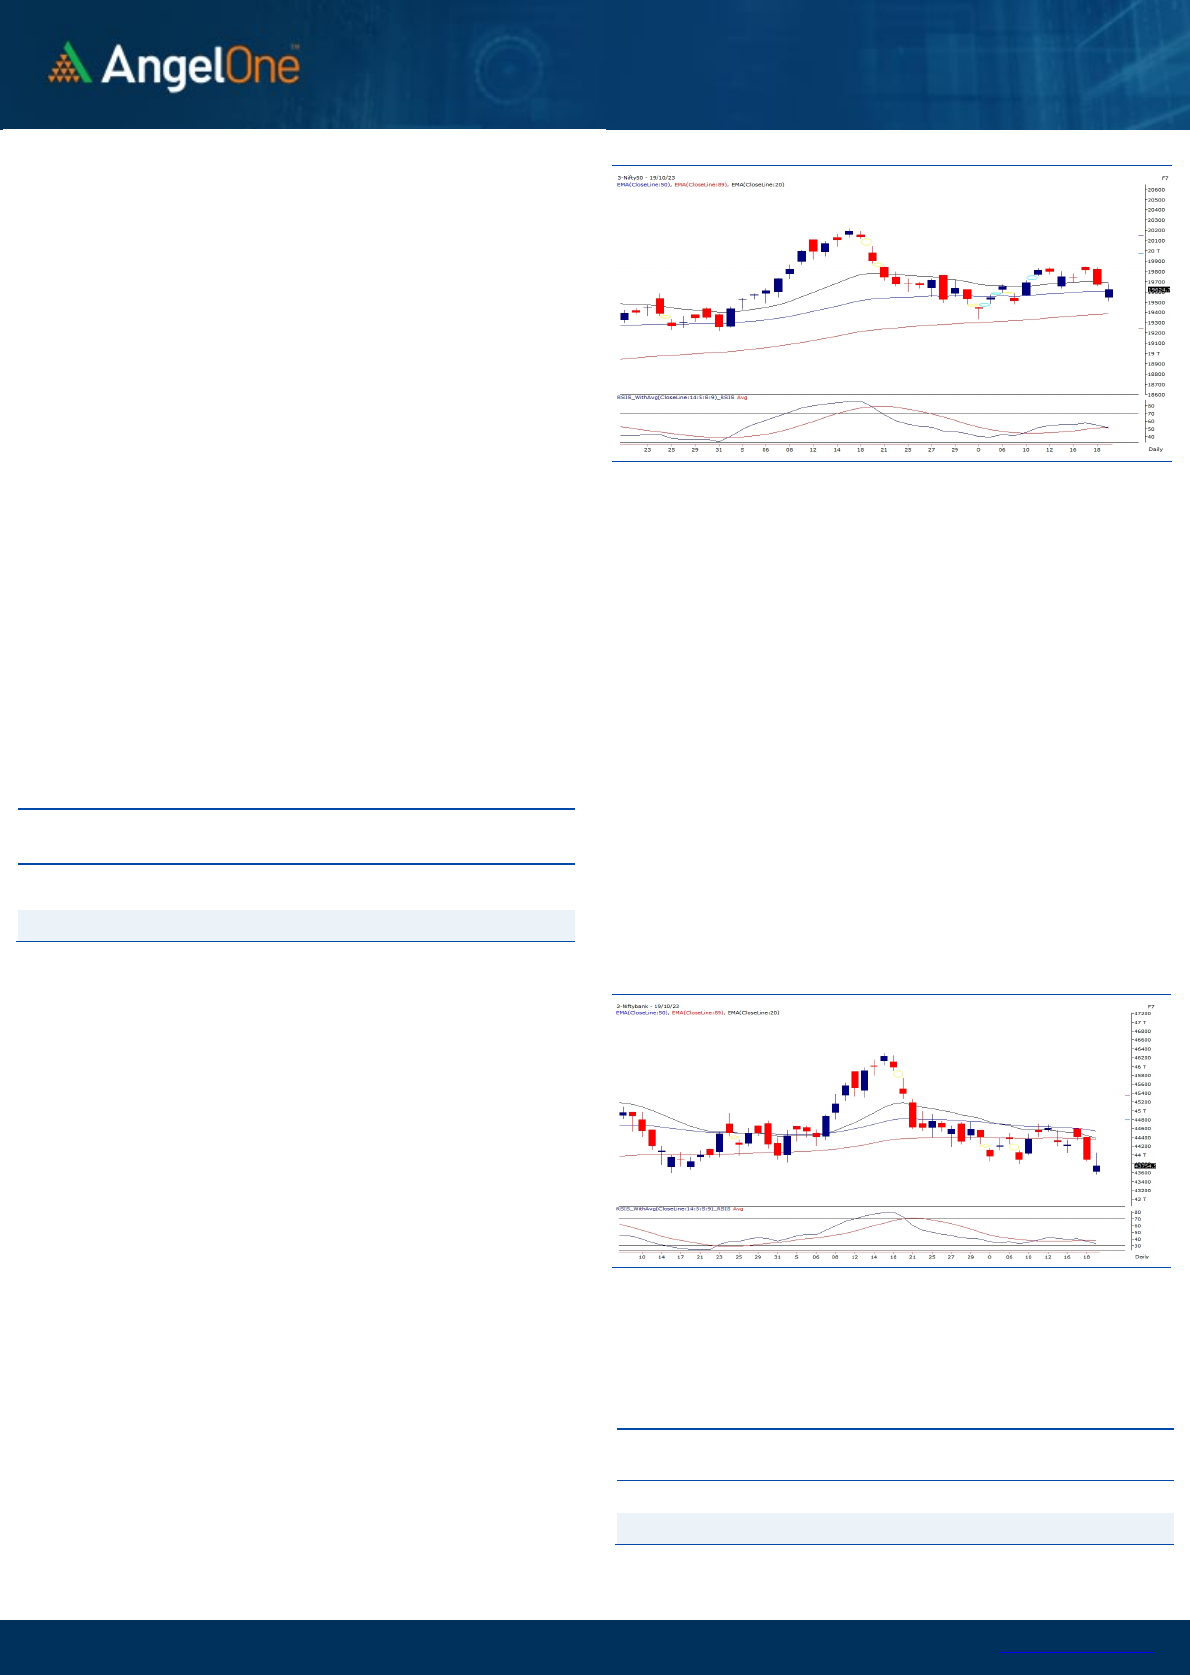
After a day of weakness, Nifty opened lower, but a significant support
level on the weekly expiry session prompted a mid-session rebound,
recouping most of the morning losses. The second half of the day was
less eventful, marked by consolidation and tentativeness at higher
levels, Nifty eventually ended the day with a loss of 0.24% at 19625.
Nifty has now declined for a second consecutive session, but there was
some relief at lower levels, as indicators were a bit oversold and as
prices approached crucial support levels. Technically, the daily chart
shows a formation of a lower top on a key resistance level on the daily
chart. Hence, we maintain a cautious stance going forward and
anticipate that any potential rebounds may face selling pressure. In this
context, 19750 - 19850 serves as an immediate resistance, while a
convincing bullish comeback would require a close beyond 19850 with
authority. On the downside, there is a likelihood of retesting the 19500
- 19400 range, which is considered a sacrosanct support zone. Market
reactions in this area will be critical, as a breach of these levels could
lead to further weakness in the near term. Traders should monitor
these levels closely and align their trading strategies accordingly.
Additionally, it is essential to remain vigilant regarding geopolitical
factors, as they can significantly influence market trends.
Key Levels
Support 1 – 19500 Resistance 1 – 19750
Support 2 – 19450 Resistance 2 – 19850
As far as levels are concerned, any rise is likely to face hurdle now
around the 44000 level, which coincides with the short term 5-DEMA
and also yesterday’s high, where any aggression from sellers is like
to find cushion around the 43500 level.
Key Levels
Support 1 – 43500 Resistance 1 – 44000
Support 2 – 43300 Resistance 2 – 44200

www.angelone.in
Technical & Derivatives Report
October
20
, 2023
View
Post Wednesday’s selling, we witnessed a negative
start for the weekly expiry session. However, the
index rebounded from the lows around 19500 mark
and then consolidated in the end to conclude the
session with a cut of 0.24%
FIIs were net sellers in the cash market segment to
the tune of Rs. 1093 cr. Simultaneously, they sold
worth Rs. 392 cr in Index futures with rise in open
interest, indicating the addition of fresh shorts.
On the derivatives front, we observed decent
unwinding in key indices. FIIs remained net sellers in
equities and index futures segments. For the coming
monthly series, 19800 call and 19500 put strikes are
attracting trader’s attention. Considering the recent
sell-off and FIIs selling specifically in the last two
sessions, the overall sentiment remains uncertain.
Hence, or the time being we need to keep a close tab
on global development and strictly avoid any kind of
bottom fishing until we see a sustainable upmove
beyond 19700-19800 zone.
Comments
The Nifty futures open interest has decreased by 0.07%
and Bank Nifty futures open interest has decreased by
4.68% as the market closed at 19624.70.
The Nifty October future closed with a discount of 5.95
points against a premium of 12.25 points in the last
trading session. The November series closed at a
premium of 126.20 points.
The INDIA VIX has decreased from 10.97 to 10.90. At
the same time, the PCR-OI of Nifty has increased from
0.82 to 0.93.
A few of the liquid counters where we have seen high
cost of carry are DELTACORP, IDEA, INDIACEM,
ABCAPITAL and PVRINOX.
Historical Volatility
SCRIP HV
BAJAJ-AUTO 27.31
ASTRAL 36.20
NESTLEIND 21.60
LTIM 35.43
IGL 34.27
Nifty Vs OI
19000
19200
19400
19600
19800
20000
20200
20400
20600
9,000
9,500
10,000
10,500
11,000
11,500
12,000
12,500
13,000
13,500
14,000
9-29 10-5 10-9 10-12 10-16 10-18
Openinterest Nifty
OI Gainers
SCRIP OI
OI
CHG. (%)
PRICE
PRICE
CHG. (%)
BAJAJ-AUTO 3112500 27.18 5482.65 6.45
ASTRAL 3992593 18.48 1843.85 -6.21
IGL 14015375 17.97 457.65 -4.86
LALPATHLAB 1188600 16.32 2507.65 -0.16
NESTLEIND 341240 13.31 24132.05 3.41
IPCALAB 2852850 10.47 946.85 -1.14
OFSS 331200 9.23 4011.50 -2.50
ULTRACEMCO 1716800 7.91 8518.50 2.86
OI Losers
SCRIP OI
OI
CHG. (%)
PRICE
PRICE
CHG. (%)
PERSISTENT 17600 -12.73 5848.95 2.41
COFORGE 1372050 -10.73 5108.70 0.78
JKCEMENT 700500 -6.91 3345.00 2.00
COROMANDEL 1362900 -5.21 1160.05 -0.15
IEX 56966250 -5.05 133.70 0.41
HAVELLS 6361000 -3.93 1362.70 1.74
ICICIPRULI 10572000 -3.31 522.20 0.51
SBILIFE 6183000 -3.27 1348.15 -0.58
Put-Call Ratio
SCRIP PCR (OI) PCR (VOL)
NIFTY 0.93 0.98
BANKNIFTY 0.74 0.86
RELIANCE 0.52 0.41
ICICIBANK 0.52 0.44
INFY 0.40 0.39
www.angelone.in
Technical & Derivatives Report
October
20
, 2023
Note: Above mentioned Bullish or Bearish Spreads in Nifty (Oct Series) are given as an information and not as a recommendation.
Nifty Spot =
19
6
24.70
FII Statistics for
October
1
9
, 2023
Detail Buy
Contracts
OI Value
(in Cr.)
Sell Net CHANGE
INDEX
FUTURES
3789.40
4181.57
(392.17) 193791
15548.81
0.36
INDEX
OPTIONS
1896061.34
1867049.73
29011.61
2990447
243505.06
(4.59)
STOCK
FUTURES
22667.98
22074.78
593.20
2435663
191774.26
0.17
STOCK
OPTIONS
31160.42 31143.30 17.12
243787 19775.35 (0.07)
Total
1953679.14
1924449.38
29229.76
5863688
470603.48
(2.32)
Turnover on
October
1
9
, 2023
Instrument
No. of
Contracts
Turnover
(in Cr.)
Change
(%)
Index Futures
199055 15938.62
2.82
Index Options
389518656
37584.05
-8.16
Stock Futures
746466 61833.95
5.89
Stock Options
4286881 4039.15 -1.27
Total
42,86,881 4039.15 0.41
Bull-Call Spreads
Action Strike Price Risk Reward BEP
Buy
19600
118.70 46.90
53.10
19646.90
Sell
19700
71.80
Buy
19600 118.70 80.00
120.00
19680.00
Sell
19800 38.70
Buy
19700
71.80 33.10 66.90 19733.10
Sell
19800 38.70
Bear-Put Spreads
Action Strike Price Risk Reward BEP
Buy
19600 38.70
-33.10
133.10
19633.10
Sell 19500 71.80
Buy 19600 38.70
-80.00
280.00
19680.00
Sell
19400 118.70
Buy
19500 71.80
-46.90 146.90 19546.90
Sell 19400 118.70
Nifty Put
-
Call Analysis
,0
1000,000
2000,000
3000,000
4000,000
5000,000
6000,000
19200 19300 19400 19500 19600 19700 19800 19900 20000 20100 20200 20300 20400 20500
Call Put

www.angelone.in
Technical & Derivatives Report
October
20
, 2023
`
Daily Pivot Levels for Nifty Constituents
Scrips S2 S1 PIVOT R1 R2
ADANIENT 2,368 2,385 2,400 2,417 2,432
ADANIPORTS 783 788 793 798 802
APOLLOHOSP 4,899 4,948 4,984 5,033 5,069
ASIANPAINT 3,061 3,082 3,096 3,116 3,131
AXISBANK 971 981 990 1,000 1,009
BAJAJ-AUTO 5,158 5,320 5,408 5,570 5,658
BAJFINANCE 7,640 7,741 7,832 7,933 8,024
BAJAJFINSV 1,579 1,607 1,625 1,653 1,671
BPCL 347 350 352 356 358
BHARTIARTL 935 939 945 949 955
BRITANNIA 4,539 4,571 4,593 4,625 4,648
CIPLA 1,177 1,200 1,213 1,236 1,248
COALINDIA 306 311 313 317 320
DIVISLAB 3,575 3,607 3,632 3,663 3,688
DRREDDY 5,574 5,603 5,639 5,667 5,703
EICHERMOT 3,425 3,463 3,499 3,537 3,572
GRASIM 1,910 1,943 1,961 1,994 2,012
HCLTECH 1,259 1,263 1,269 1,273 1,279
HDFCBANK 1,492 1,503 1,515 1,526 1,538
HDFCLIFE 622 631 637 646 653
HEROMOTOCO 3,089 3,178 3,226 3,315 3,363
HINDALCO 466 473 478 484 489
HINDUNILVR 2,513 2,531 2,543 2,560 2,572
ICICIBANK 927 932 938 943 949
INDUSINDBK 1,404 1,427 1,446 1,469 1,488
INFY 1,420 1,427 1,433 1,440 1,447
ITC 443 447 451 455 459
JSW STEEL 764 772 777 786 791
KOTAKBANK 1,725 1,732 1,742 1,749 1,760
LT 2,981 3,018 3,044 3,080 3,107
LTIMINDTREE 5,099 5,279 5,379 5,559 5,659
M&M 1,542 1,556 1,567 1,581 1,593
MARUTI 10,658 10,715 10,757 10,814 10,856
NESTLEIND 22,693 23,413 23,820 24,539 24,946
NTPC 237 238 240 241 243
ONGC 184 185 186 187 188
POWERGRID 200 203 205 208 210
RELIANCE 2,289 2,298 2,310 2,318 2,330
SBILIFE 1,332 1,340 1,347 1,355 1,362
SBIN 564 567 571 574 578
SUNPHARMA 1,127 1,134 1,142 1,149 1,157
TCS 3,437 3,446 3,461 3,471 3,486
TATACONSUM
870 883 892 904 913
TATAMOTORS 653 661 667 675 680
TATASTEEL 123 125 126 127 128
TECHM 1,157 1,165 1,175 1,182 1,193
TITAN 3,213 3,249 3,275 3,311 3,337
ULTRACEMCO 8,072 8,295 8,417 8,640 8,761
UPL 602 608 613 618 623
WIPRO 387 391 394 398 401

www.angelone.in
Technical & Derivatives Report
October
20
, 2023
Technical and Derivatives Team:
Sameet Chavan Head Research – Technical & Derivatives sameet.chavan@angelone.in
Sneha Seth Senior Analyst – Technical & Derivatives sneha.seth@angelone.in
Rajesh Bhosale Analyst - Technical rajesh.bhosle@angelone.in
Osho Krishan Senior Analyst – Technical & Derivatives osho.krishan@angelone.in
Hitesh Rathi Analyst – Technical & Derivatives hitesh.rathi@angelone.in
Research Team Tel: 022 – 39357600 Website: www.angelone.in
For Technical Queries E-mail: technicalresearch-cso@angelone.in
For Derivatives Queries E-mail: derivatives.desk@angelone.in
DISCLAIMER
We, Angel One Limited (hereinafter referred to as “Angel”) a company duly incorporated under the provisions of the Companies Act, 1956 with
its registered office at 601, 6th Floor, Ackruti Star, Central Road, MIDC, Andheri East, Mumbai – 400093, CIN: (L67120MH1996PLC101709) and
duly registered as a member of National Stock Exchange of India Limited, Bombay Stock Exchange Limited, Metropolitan Stock Exchange Limited,
Multi Commodity Exchange of India Ltd and National Commodity & Derivatives Exchange Ltd. Angel One limited is a company engaged in
diversified financial services business including securities broking, DP services, distribution of Mutual Fund products. It is also registered as a
Depository Participant with CDSL and Portfolio Manager and Investment Adviser with SEBI. It also has registration with AMFI as a Mutual Fund
Distributor. Angel One Limited is a registered entity with SEBI for Research Analyst in terms of SEBI (Research Analyst) Regulations, 2014 vide
registration number INH000000164 and also registered with PFRDA as PoP ,Registration No.19092018. Angel Group does not have any joint
ventures or associates. Angel One Limited is the ultimate parent company of the Group. Angel or its associates has not been debarred/ suspended
by SEBI or any other regulatory authority for accessing /dealing in securities Market.
AOL was merged with Angel Global Capital Private Limited and subsequently name of Angel Global Capital Private Limited was changed to Angel
Broking Private Limited (AOL) pursuant to scheme of Amalgamation sanctioned by the Hon'ble High Court of Judicature at Bombay by Orders
passed in Company Petition No 710 of 2011 and the approval granted by the Registrar of Companies. Further, name of Angel Broking Private
Limited again got changed to Angel Broking Limited (AOL) pursuant to fresh certificate of incorporation issued by Registrar of Companies (ROC)
dated June 28, 2018. Further name of Angel Broking name changed to Angel One Ltd pursuant to fresh certificate of incorporation issued by
Registrar of Companies (ROC) dated 23-09-21.
In case of any grievances please write to: support@angelone.in, Compliance Officer Details: Name : Hiren Thakkar, Tel No. –08657864228, Email
id - compliance@angelone.in
Registration granted by SEBI and certification from NISM in no way guarantee performance of the intermediary or provide any assurance of returns
to investors.
This document is solely for the personal information of the recipient, and must not be singularly used as the basis of any investment decision.
Nothing in this document should be construed as investment or financial advice. Each recipient of this document should make such investigations
as they deem necessary to arrive at an independent evaluation of an investment in the securities of the companies referred to in this document
(including the merits and risks involved), and should consult their own advisors to determine the merits and risks of such an investment.
Angel or its associates or research analyst or his relative may have actual/beneficial ownership of 1% or more in the securities of the subject
company at the end of the month immediately preceding the date of publication of the research report. Neither Angel or its associates nor
Research Analysts or his relative has any material conflict of interest at the time of publication of research report.
Angel or its associates might have received any compensation from the companies mentioned in the report during the period preceding twelve
months from the date of this report for services in respect of managing or co-managing public offerings, corporate finance, investment banking or
merchant banking, brokerage services or other advisory service in a merger or specific transaction in the normal course of business. Angel or its
associates did not receive any compensation or other benefits from the companies mentioned in the report or third party in connection with the
research report. Neither research entity nor research analyst has been engaged in market making activity for the subject company.

www.angelone.in
Technical & Derivatives Report
October
20
, 2023
*
Reports based on technical and derivative analysis center on studying charts of a stock's price movement, outstanding positions and trading
volume, as opposed to focusing on a company's fundamentals and, as such, may not match with a report on a company's fundamentals. Investors
are advised to refer the Fundamental and Technical Research Reports available on our website to evaluate the contrary view, if any.
The information in this document has been printed on the basis of publicly available information, internal data and other reliable sources believed
to be true, but we do not represent that it is accurate or complete and it should not be relied on as such, as this document is for general guidance
only. Angel One Limited or any of its affiliates/ group companies shall not be in any way responsible for any loss or damage that may arise to any
person from any inadvertent error in the information contained in this report. Angel One Limited does not warrant the accuracy, adequacy or
completeness of the service, information and materials and expressly disclaims liability for errors or omissions in the service, information and
materials. While Angel One Limited endeavours to update on a reasonable basis the information discussed in this material, there may be
regulatory, compliance, or other reasons that prevent us from doing so.
This document is being supplied to you solely for your information, and its contents, information or data may not be reproduced, redistributed or
passed on, directly or indirectly.
Neither Angel One Limited, nor its directors, employees or affiliates shall be liable for any loss or damage that may arise from or in connection
with the use of this information. Angel or its associates or Research Analyst or his relative might have financial interest in the subject company.
Research analyst has not served as an officer, director or employee of the subject company.
Investment in securities market are subject to market risks. Read all the related documents carefully before investing.
Any communication sent to clients on phone numbers or e-mail ids registered with the Trading Member is meant for client consumption and such
material should not be redistributed. Brokerage will not exceed SEBI prescribed limit. Any Information provided by us through any medium based
on our research or that of our affiliates or third parties or other external sources is subject to domestic and international market conditions and
we do not guarantee the availability or otherwise of any securities or other instruments and such Information is merely an estimation of certain
investments, and we have not and shall not be deemed to have assumed any responsibility for any such Information. You should seek independent
professional advice and/or tax advice regarding the suitability of any investment decision whether based on any Information provided by us
through the Site from inhouse research or third party reports or otherwise.
The report and information contained herein is strictly confidential and meant solely for the selected recipient and may not be altered in any way,
transmitted to, copied or distributed, in part or in whole, to any other person or to the media or reproduced in any form, without prior written
consent.
