OCT 20, 2022
www.angelone.in
Technical & Derivatives Report
xOOOOOOOO
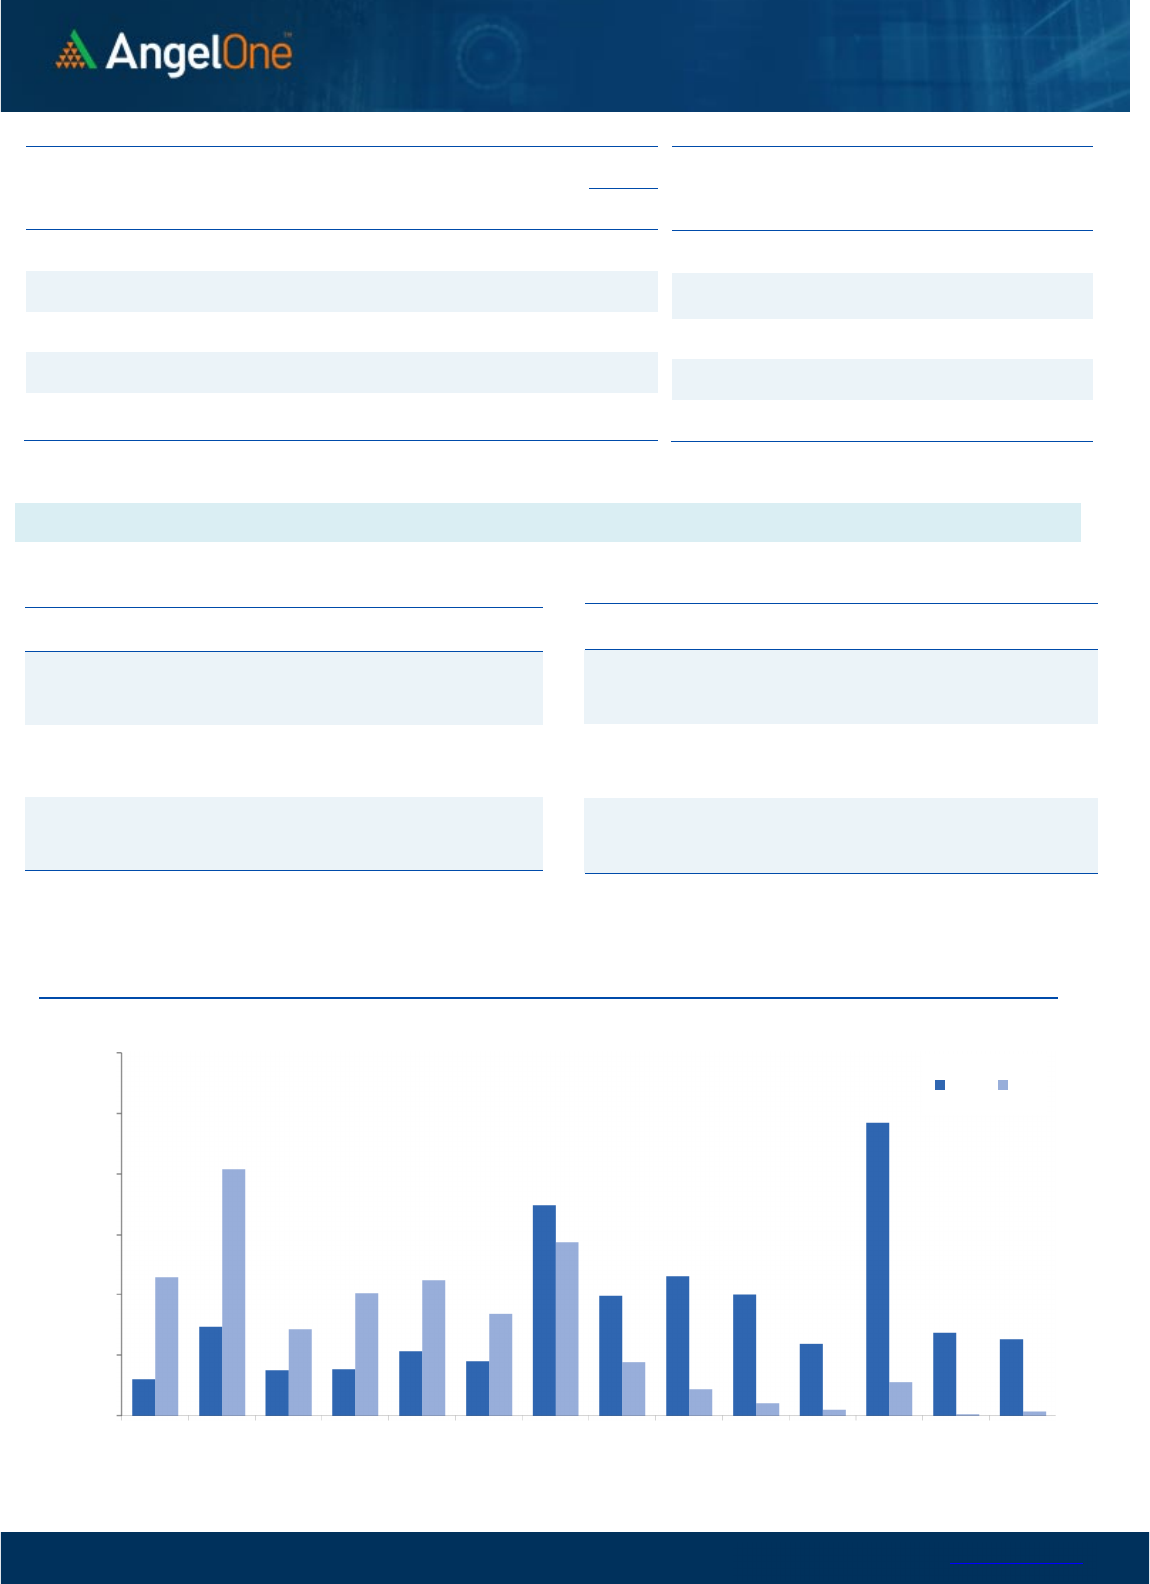
Nifty Bank Outlook (40373)
Once again, the start for the day was on a positive note however
there was no follow up buying post opening. In the second half
there was some profit booking and then after trading in a range the
bank index eventually ended with marginal gains of 0.14% at
40373.
Even though the bulls continued with their winning streak, the
intraday moves for the last two sessions have been lethargic. On
the weekly expiry as well, we may see some further consolidation
in key indices and the real action can continue in stock specific
trades. With couple of key results lined up within the banking
space, traders should focus on the outperforming counters. The
bias remains positive and incase of any dips it should be taken as a
buying opportunity. As far as levels are concerned, immediate
support is seen around 40100 - 39900 levels whereas resistance is
seen at 40730 - 40890 levels.
Key Levels
Support 1 – 40100 Resistance 1 – 40730
Support 2 – 39900 Resistance 2 – 40890
Exhibit 1: Nifty
Daily
Chart
Exhibit 2: Nifty Bank
Daily
Chart
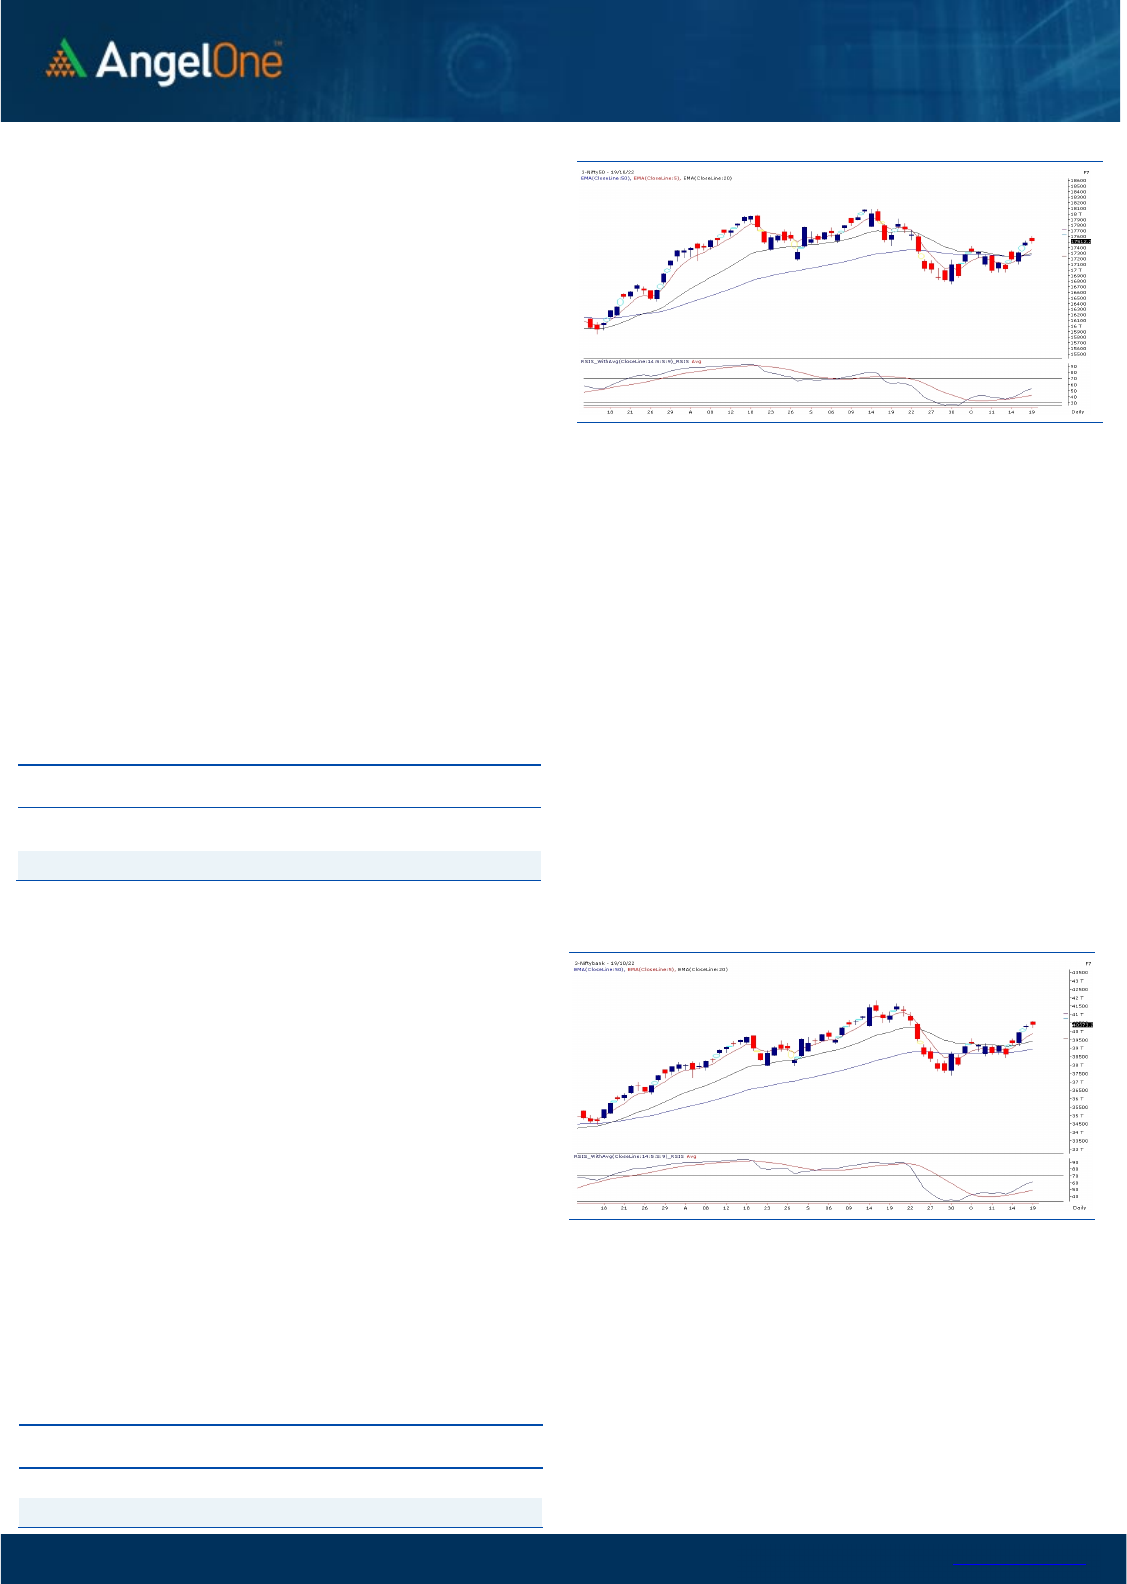
Sensex (59107) / Nifty (17512)
For the second consecutive session, our markets witnessed a
healthy gap-up opening, courtesy to an extended rebound in US
bourses. In the initial hour, Nifty hastened towards 17600; but
traders chose to take some money off the table there, and hence,
we witnessed a gradual decline for the major part of the session.
Due to last hour extended selling, Nifty ended the session tad above
17500 by restricting the gains to not even two-tenths of a percent.
In the last 3-4 trading sessions, we have seen an excellent rally in
our markets and hence, after reaching the important junction of
17600, some profit booking was evident. But by this, does the trend
completely reverse? In our sense, No; because the tide seems to
have turned upwards once again, and in between such small
declines are a part of the broader healthy structure. Traders are
advised not to trade against the trend and should rather wait for the
index to revisit key supports to add on to bullish bets. As far as
support is concerned, it is clearly visible in the zone of 17400-17350.
On the flip side, soon we will see Nifty surpassing 17600 to test
17800 and beyond levels. The undertone is strongly bullish and
hence, traders are advised to keep focusing on thematic plays.
Key Levels
Support 1 – 17400 Resistance 1 – 17580
Support 2 – 17300 Resistance 2 – 17650

www.angelone.in
Technical & Derivatives Report
OCT 20, 2022
View
We had a positive start for the day which was then
followed by a range bound session for the index.
Nifty eventually ended tad below 17500.
FIIs were net sellers in the cash market segment to the
tune of Rs. 454 crores. Simultaneously, in Index
futures, they sold worth Rs. 141 crores with a rise in
open interest; indicating formation of mixed bets in
yesterday’s session.
In derivatives front, we hardly observed any relevant
open interest change in both the key indices. FIIs
added mixed bets in index futures and continued selling
equities. However, their Long short ratio has improved
this week to 30% from 23% seen last Friday. As the
Index witnessed some tentativeness around 17600
zone, we observed call writers adding meaningful bets
in 17600-17800 strikes. Suggesting, traders are
expecting 17600 zone to act as hurdle on the weekly
expiry session. For now, 17350 - 17400 remains an
immediate support zone and as long we manage to
sustain above the same there is no sign of worrisome.
Hence, traders can use such dips to add fresh longs in
system.
Comments
The Nifty futures open interest has increased by
0.41%. and Bank Nifty futures open interest has
increased by 0.25% as the market closed at
17512.25.
The Nifty October future closed with a discount of
17.60 point against a premium of 15.05 point in the
last trading session. The November series closed at
a premium of 20.40 point.
The INDIA VIX increased from 17.45 to 17.48. At the
same time, the PCR-OI of Nifty has decreased from
1.19 to 1.13.
Few of the liquid counters where we have seen high
cost of carry are IDEA, WHIRLPOOL, ALKEM, FSL
AND RECLTD
Historical Volatility
SCRIP HV
SYNGENE 37.09
CONCOR 42.89
LTTS 49.19
ASTRAL 45.61
AARTIIND 43.30
Nifty Vs OI
16400
16600
16800
17000
17200
17400
17600
,0
2,000
4,000
6,000
8,000
10,000
12,000
14,000
16,000
18,000
9/30 10/4 10/7 10/11 10/13 10/17 10/19
Openinterest Nifty
OI Gainers
SCRIP OI
OI
CHG. (%)
PRICE
PRICE
CHG. (%)
AARTIIND 1851300 113.32 683.30 5.00
LTTS 1625600 63.11 3495.00 -6.50
TORNTPOWER 4959000 27.45 481.40 -0.42
ULTRACEMCO 2376000 17.79 6398.40 0.73
TVSMOTOR 7802200 15.53 1171.45 3.60
CONCOR 7400000 14.02 771.25 6.87
POLYCAB 1268700 12.92 2706.55 -2.10
ITC 85561600 10.71 346.35 1.76
OI Losers
SCRIP OI
OI
CHG. (%)
PRICE
PRICE
CHG. (%)
BHEL 148281000 -8.41 67.55 -1.32
SIEMENS 1527350 -7.01 2885.75 2.07
ESCORTS 1132450 -6.49 1991.60 0.42
BAJAJ-AUTO 2324000 -5.82 3655.80 0.94
GNFC 5846100 -5.80 722.15 1.40
PVR 3273094 -5.79 1781.15 2.99
FEDERALBNK 96960000 -5.59 131.30 -0.87
HDFC 18551100 -5.50 2381.80 1.85
Put-Call Ratio
SCRIP PCR (OI) PCR (VOL)
NIFTY 1.13 1.07
BANKNIFTY 1.06 1.03
RELIANCE 0.57 0.37
ICICIBANK 0.54 0.46
INFY 0.47 0.53
www.angelone.in
Technical & Derivatives Report
OCT 20, 2022
Note: Above mentioned Bullish or Bearish Spreads in Nifty (Oct Series) are given as an information and not as a recommendation.
Nifty Spot =
1
7
512.25
FII Statistics for
October
1
9
, 2022
Detail Buy
Contracts
Open
Interest
Value
(in Cr.)
Sell
Net
CHANGE
INDEX
FUTURES
3799.93 3941.30 (141.37) 154150 14020.50 3.71
INDEX
OPTIONS
994668.72 990324.69 4344.03
2026759 185717.57 14.51
STOCK
FUTURES
19379.39 19224.44 154.95
2177023 148737.98 1.36
STOCK
OPTIONS
10592.75 10507.72 85.03
157951 11324.00 5.08
Total
1028440.79
1023998.15
4442.64
4515883
359800.05
7.09
Turnover on
October
1
7
, 2022
Instrument
No. of
Contracts
Turnover
( in Cr. )
Change
(%)
Index Futures
409340 37995.42 -18.15
Index Options
110242718 10213416.30
30.53
Stock Futures
833565 58322.29 -3.55
Stock Options
3118245 228087.99 -5.70
Total
31,18,245 228087.99 28.93
*Turnover data as per 17
th
Oct Closing
Bull-Call Spreads
Action Strike Price Risk Reward BEP
Buy
17500 156.30
47.40
52.60
17547.40
Sell
17600 108.90
Buy
17500 156.30
85.95
114.05
17585.95
Sell
17700 70.35
Buy
17600 108.90
38.55 61.45 17638.55
Sell
17700 70.35
Bear
-
Put Spreads
Action Strike Price Risk Reward BEP
Buy
17500 162.95
41.10
58.90
17458.90
Sell 17400 121.85
Buy 17500 162.95
74.95
125.05
17425.05
Sell
17300 88.00
Buy
17400 121.85
33.85 66.15 17366.15
Sell
17300 88.00
Nifty Put
-
Call Analysis
,0
1000,000
2000,000
3000,000
4000,000
5000,000
6000,000
16900 17000 17100 17200 17300 17400 17500 17600 17700 17800 17900 18000 18100 18200
Call Put

www.angelone.in
Technical & Derivatives Report
OCT 20, 2022
`
Daily Pivot Levels for Nifty Constituents
Scrips
S2
S1
PIVOT
R1 R2
ADANIENT 3,232 3,255
3,282
3,305
3,333
ADANIPORTS
788
796
810
819
832
APOLLOHOSP 4,314 4,351
4,379
4,416
4,443
ASIANPAINT 3,169 3,191
3,218
3,240
3,268
AXISBANK
807
818
828
840
850
BAJAJ-AUTO 3,572 3,614
3,666
3,707
3,759
BAJFINANCE 7,300 7,340
7,390
7,430
7,480
BAJAJFINSV 1,669 1,684
1,707
1,722
1,746
BPCL
287
290
294
297
301
BHARTIARTL
775
779
784
788
793
BRITANNIA 3,719 3,744
3,767
3,791
3,814
CIPLA 1,103 1,112
1,129
1,138
1,155
COALINDIA
233
236
239
242
245
DIVISLAB 3,544 3,576
3,594
3,626
3,644
DRREDDY 4,250 4,283
4,339
4,372
4,428
EICHERMOT 3,548 3,580
3,632
3,665
3,717
GRASIM 1,656 1,670
1,692
1,706
1,727
HCLTECH
986
991
999
1,003
1,011
HDFCBANK 1,439 1,449
1,463
1,473
1,487
HDFCLIFE
526
529
532
535
538
HDFC 2,341 2,362
2,389
2,409
2,436
HEROMOTOCO 2,507 2,524
2,549
2,566
2,591
HINDALCO
384
387
393
396
401
HINDUNILVR 2,554 2,568
2,593
2,608
2,632
ICICIBANK
878
885
893
900
908
INDUSINDBK 1,198 1,208
1,220
1,230
1,242
INFY 1,467 1,476
1,491
1,500
1,514
ITC
337
342
345
349
352
JSW STEEL
615
621
630
636
645
KOTAKBANK 1,845 1,857
1,867
1,880
1,890
LT 1,873 1,889
1,918
1,934
1,963
M&M 1,232 1,240
1,252
1,261
1,273
MARUTI 8,596 8,658
8,756
8,818
8,916
NESTLEIND
19,020
19,380
19,614
19,973
20,207
NTPC
161
163
165
167
170
ONGC
127
127
128
129
129
POWERGRID
211
212
215
216
219
RELIANCE 2,402 2,448
2,488
2,534
2,574
SBILIFE 1,204 1,216
1,225
1,236
1,245
SBIN
544
549
556
561
568
SUNPHARMA
959
968
974
983
990
TCS 3,084 3,103
3,131
3,150
3,178
TATACONSUM
752
758
768
774
783
TATAMOTORS
391
395
401
405
411
TATASTEEL 99 99
100
101
102
TECHM 1,008 1,014
1,022
1,027
1,036
TITAN 2,617 2,631
2,654
2,668
2,691
ULTRACEMCO 6,169 6,284
6,365
6,480
6,561
UPL
667
672
681
685
694
WIPRO
375
376
379
380
383

www.angelone.in
Technical & Derivatives Report
OCT 20, 2022
*
Technical and Derivatives Team:
Sameet Chavan Chief Analyst – Technical & Derivatives sameet.chavan@angelone.in
Sneha Seth Senior Analyst – Technical & Derivatives sneha.seth@angelone.in
Rajesh Bhosale Technical Analyst rajesh.bhosle@angelone.in
Osho Krishan Senior Analyst – Technical & Derivatives osho.krishan@angelone.in
Research Team Tel: 022 – 39357600 Website: www.angelone.in
For Technical Queries E-mail: technicalresearch-cso@angelone.in
For Derivatives Queries E-mail: derivatives.desk@angelone.in
DISCLAIMER
Angel One Limited (hereinafter referred to as “Angel”) is a registered Member of National Stock Exchange of India Limited, Bombay
Stock Exchange Limited and Metropolitan Stock Exchange Limited. It is also registered as a Depository Participant with CDSL and
Portfolio Manager and investment advisor with SEBI. It also has registration with AMFI as a Mutual Fund Distributor. Angel One Limited
is a registered entity with SEBI for Research Analyst in terms of SEBI (Research Analyst) Regulations, 2014 vide registration number
INH000000164. Angel or its associates has not been debarred/ suspended by SEBI or any other regulatory authority for accessing
/dealing in securities Market.
This document is solely for the personal information of the recipient, and must not be singularly used as the basis of any investment
decision. Nothing in this document should be construed as investment or financial advice. Each recipient of this document should make
such investigations as they deem necessary to arrive at an independent evaluation of an investment in the securities of the companies
referred to in this document (including the merits and risks involved), and should consult their own advisors to determine the merits
and risks of such an investment.
Angel or its associates or research analyst or his relative may have actual/beneficial ownership of 1% or more in the securities of the
subject company at the end of the month immediately preceding the date of publication of the research report. Neither Angel or its
associates nor Research Analysts or his relative has any material conflict of interest at the time of publication of research report.
Angel or its associates might have received any compensation from the companies mentioned in the report during the period preceding
twelve months from the date of this report for services in respect of managing or co-managing public offerings, corporate finance,
investment banking or merchant banking, brokerage services or other advisory service in a merger or specific transaction in the normal
course of business. Angel or its associates did not receive any compensation or other benefits from the companies mentioned in the
report or third party in connection with the research report. Neither Angel nor its research analyst entity has been engaged in market
making activity for the subject company.
Reports based on technical and derivative analysis center on studying charts of a stock's price movement, outstanding positions and
trading volume, as opposed to focusing on a company's fundamentals and, as such, may not match with a report on a company's
fundamentals. Investors are advised to refer the Fundamental and Technical Research Reports available on our website to evaluate
the contrary view, if any.
The information in this document has been printed on the basis of publicly available information, internal data and other reliable sources
believed to be true, but we do not represent that it is accurate or complete and it should not be relied on as such, as this document is
for general guidance only. Angel One Limited or any of its affiliates/ group companies shall not be in any way responsible for any loss
or damage that may arise to any person from any inadvertent error in the information contained in this report. Angel One Limited has
not independently verified all the information contained within this document. Accordingly, we cannot testify, nor make any
representation or warranty, express or implied, to the accuracy, contents or data contained within this document. While Angel One
Limited endeavors to update on a reasonable basis the information discussed in this material, there may be regulatory, compliance, or
other reasons that prevent us from doing so.
This document is being supplied to you solely for your information, and its contents, information or data may not be reproduced,
redistributed or passed on, directly or indirectly.
Neither Angel One Limited, nor its directors, employees or affiliates shall be liable for any loss or damage that may arise from or in
connection with the use of this information. Angel or its associates or Research Analyst or his relative might have financial interest in
the subject company. Research analyst has not served as an officer, director or employee of the subject company.
