September
20
, 2023
www.angelone.in
Technical & Derivatives Report
Nifty Bank Outlook (
4
5980
)
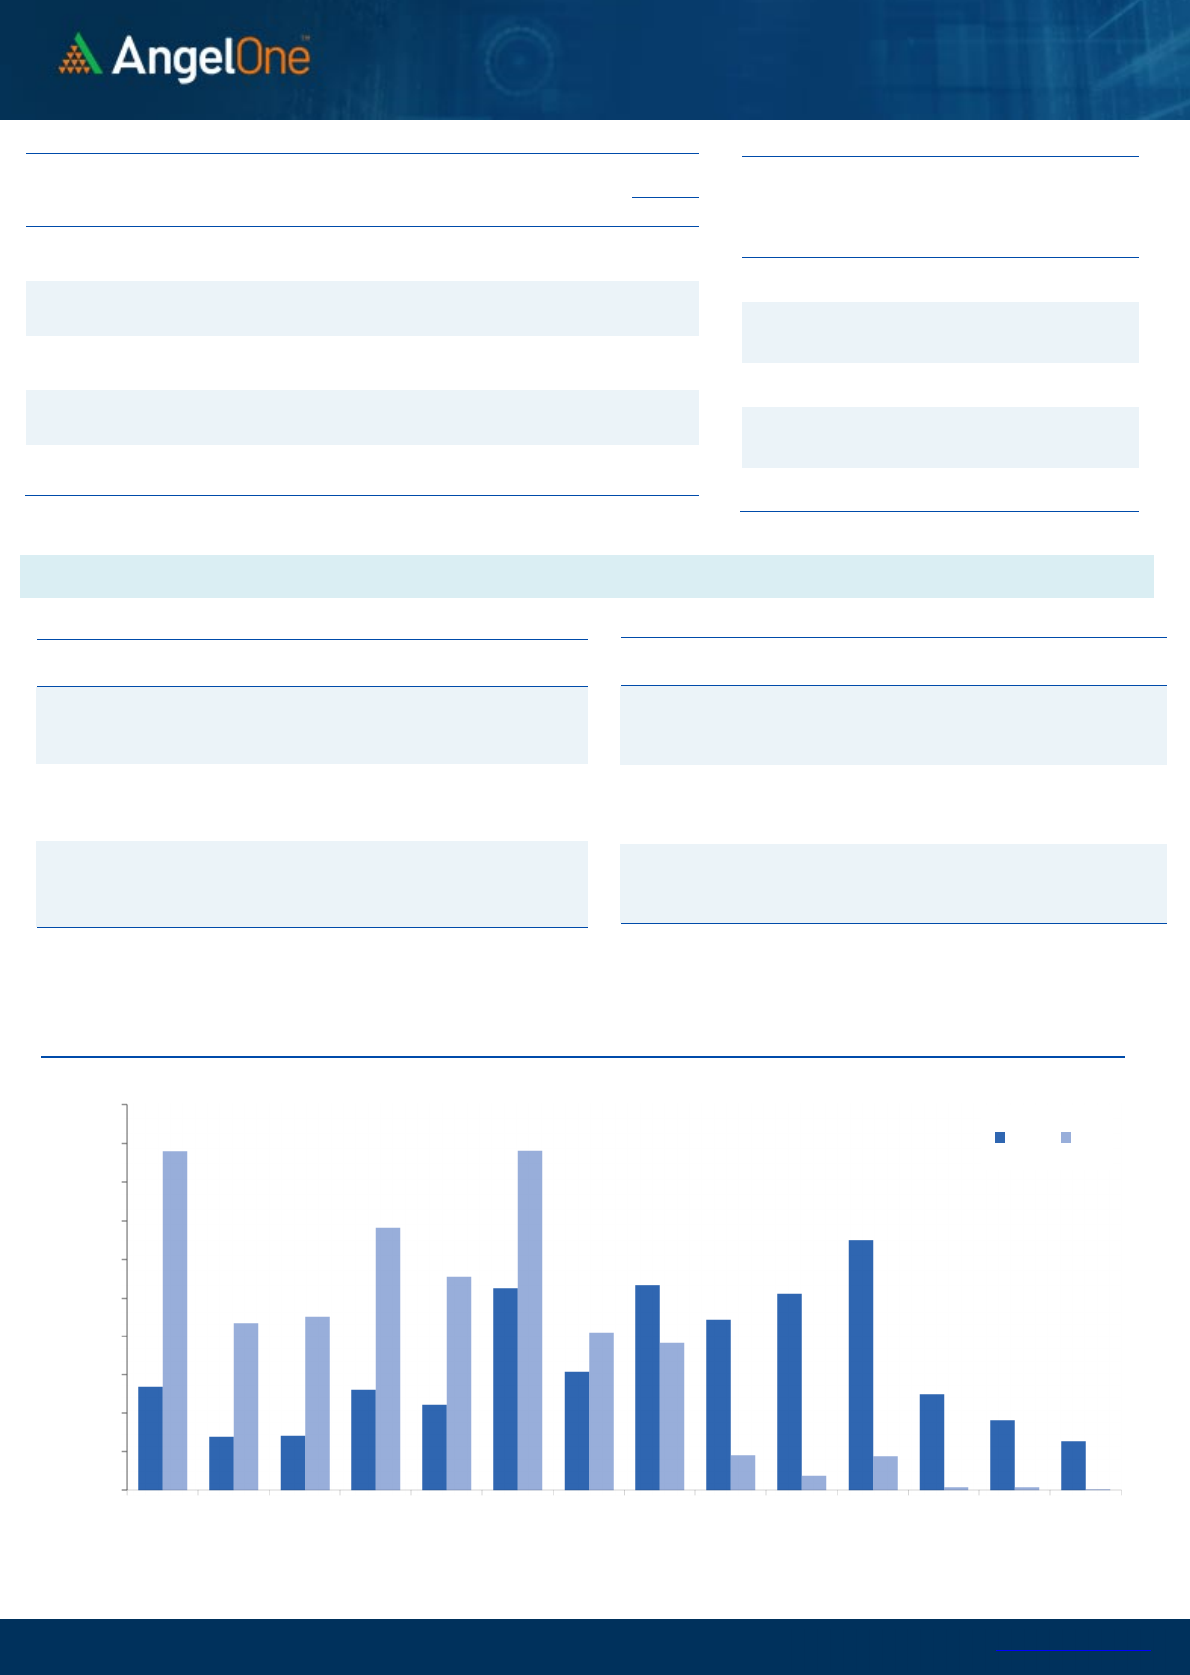
The Bank Nifty had a negative start to the truncated week, with prices
steadily declining throughout the session and resulting in a loss of
0.54%, closing just below 46000.
This High-beta index has been showing significant upward momentum
in the September month. However, as it has neared its all-time high of
46369, there was some tentativeness visible at higher levels. This
caution was evident as traders opted to secure profits before the mid-
week holiday and ahead of the key FOMC meeting. Looking ahead, the
levels of 46300 to 46500 are crucial resistance points, and positive
momentum will likely resume only if these levels are surpassed. Until
then, there might be a period of consolidation or even a slight dip in
prices in the short term, considering the volatility associated with this
important event. The primary trend, however, is anticipated to remain
positive, and any such dips could be viewed as an opportunity to buy.
Regarding support levels, 45800 followed by 45500 are the immediate
support levels. A notable aspect in this sector was the consistent
performance of PSU banks, contrasting with the disappointing
performance of the heavyweight HDFCBANK, which notably pulled the
index down. This underscores the need for traders to focus on specific
stock actions while maintaining a selective approach.
Key Levels
Support 1 – 45800 Resistance 1 – 46300
Support 2 – 45500 Resistance 2 – 46500
Exhibit 1: Nifty Daily Chart
Exhibit 2: Nifty Bank Daily Chart
Sensex (
6
7
597
) / Nifty (
20
1
33
)
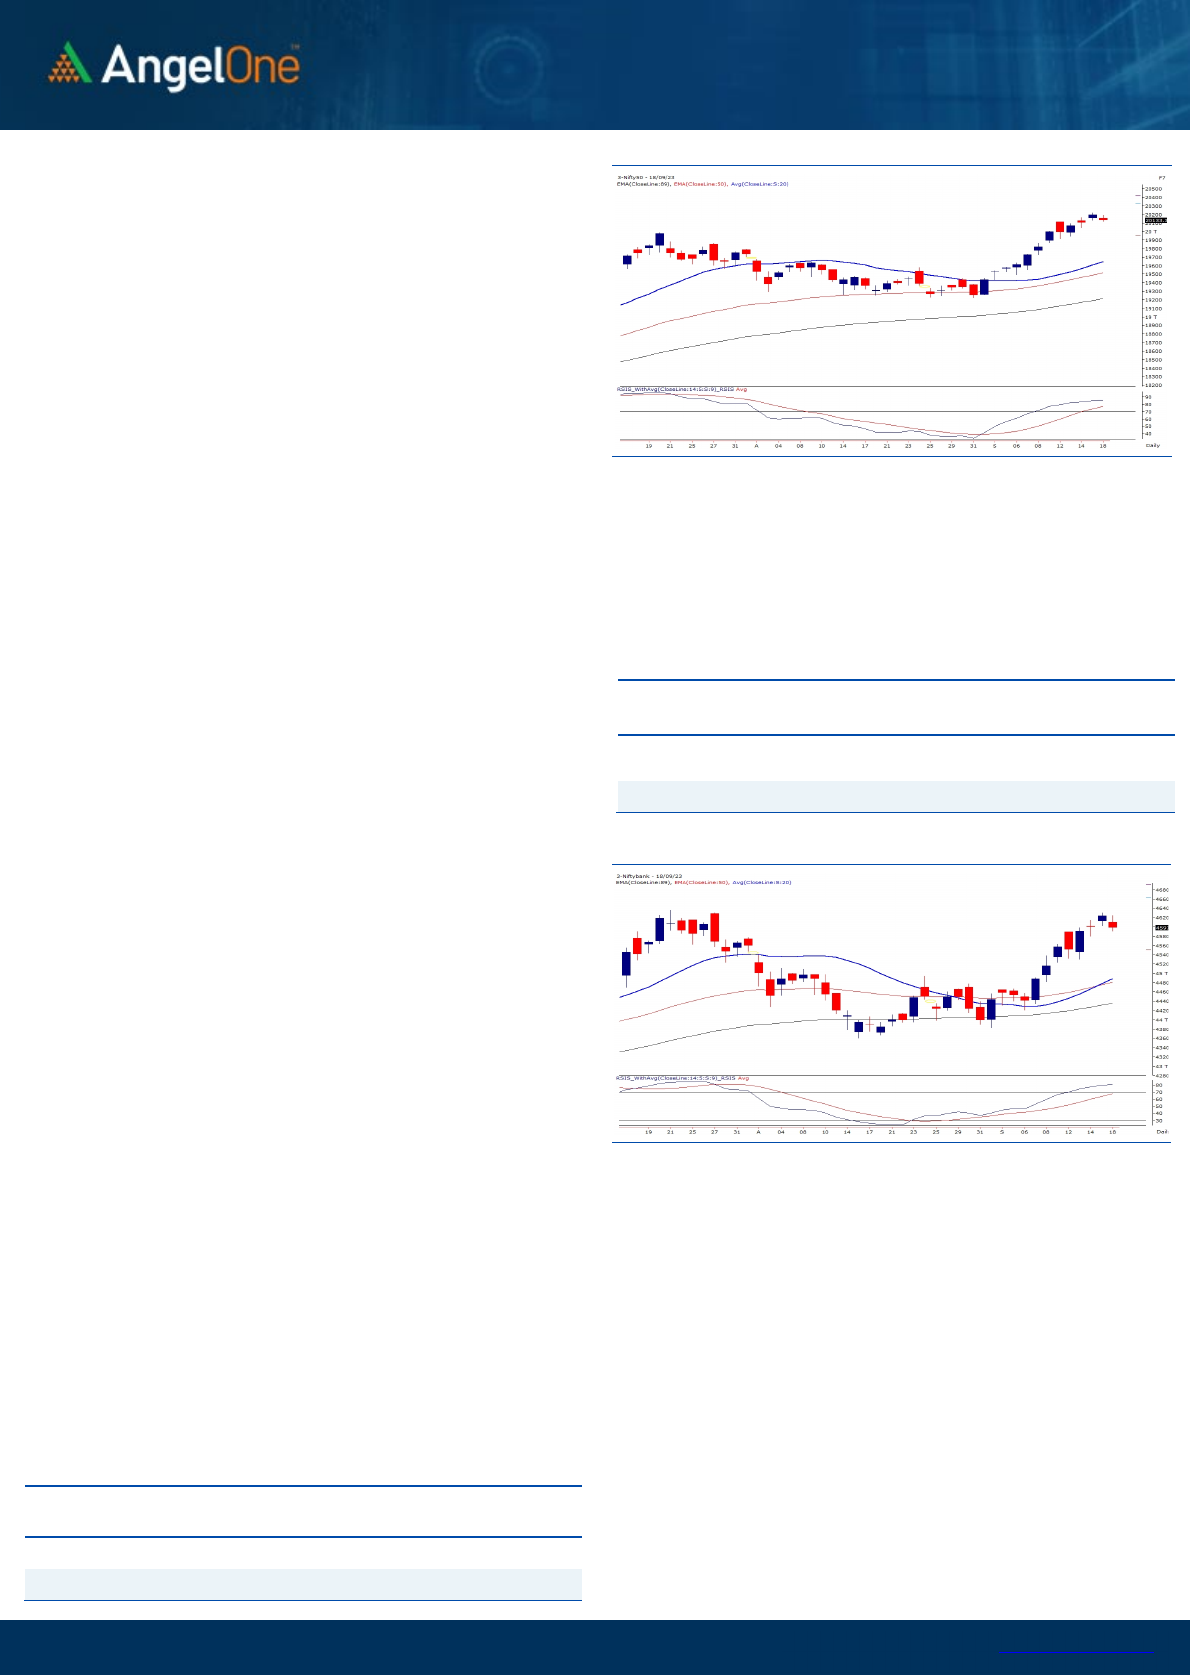
The weakness in the US bourses on Friday led to a sluggish start for our
domestic markets. As indicated by the GIFT Nifty, the benchmark index
opened slightly lower in the truncated week and stayed in a slender
range with some choppy moves. Overall, it has been a lackluster day for
the Nifty50 index, showcasing a sign of exhaustion to the bulls. Hence,
ahead of the mid-week holiday, the Nifty index settled on a negative
note, with a mere cut of 0.29 percent from ATH closure.
The small candle formation near the lifetime highs signifies a breather
for our markets after the recent rally. Also, the market participant
chose to take some money off the table ahead of the mid-week off and
refrained from carrying aggressive bets when global sentiments aren’t
pleasing. Technically, there are no significant alterations in the price
action in the index, but brakes seem to have been applied on the recent
momentum. On the levels front, the immediate resistance is intact near
20200-20250, and a decisive breach would only trigger the next leg of
rally to propel the index into uncharted territory. On the lower end,
20100-20080 withholds the cushion, followed by the sacrosanct
support of 20000 in the near period.
The market awaits some trigger to carry the momentum, be it from
the Banking index or the global bourses. Till then, some
consolidation could be seen with strong support near 20000.
Meanwhile, the global markets need to be watched carefully as they
might dictate the near-term trend for our market. Also, one must
remain fussy with stock preferences with one step at a time
approach.
Key Levels
Support 1 – 20080 Resistance 1 – 20200
Support 2 – 20000 Resistance 2 – 20250

www.angelone.in
Technical & Derivatives Report
September
20
, 2023
View
The Indian equity market had a choppy trade on
Monday, and hence we concluded the day with a
decline of three-tenths of a percent.
FIIs were net buyers in the cash market segment to
the tune of Rs. 1237 cr. Simultaneously, in Index
futures, they sold worth Rs. 332 cr with a decrease in
open interest, suggesting long unwinding.
On the derivatives front, we witnessed decent long
unwinding in key indices. On the options front, some
unwinding was witnessed in 20150-20200 put
strikes. On the flip side, the build-up remained
scattered between 20150-20500 call options. FIIs
turned net sellers in equities and index futures as
well. Considering the above data points, the market
seems upbeat but would advocate avoiding being
complacent after the rally and utilizing dips to add
long bets in the system.
Comments
The Nifty futures open interest has decreased by 1.57%
and Bank Nifty futures open interest has decreased by
5.40% as the market closed at 20133.30.
The Nifty September future closed with a premium of
45.55 points against 57.25 points in the last trading
session. The October series closed at a premium of
153.15 points.
The INDIA VIX has decreased from 10.90 to 10.84. At
the same time, the PCR-OI of Nifty has decreased from
1.31 to 1.10.
A few of the liquid counters where we have seen high
cost of carry are BAJAJ-AUTO, ICICIPRULI, IDEA, IOC and
IPCALAB.
Historical Volatility
SCRIP HV
SYNGENE 31.42
IDEA 66.02
BERGEPAINT 25.71
POWERGRID 29.68
TITAN 27.06
Nifty Vs OI
19200
19400
19600
19800
20000
20200
20400
20600
10,000
11,000
12,000
13,000
14,000
15,000
8-23 8-25 9-6 9-8 9-12 9-14
Openinterest Nifty
OI Gainers
SCRIP OI
OI
CHG. (%)
PRICE
PRICE
CHG. (%)
IPCALAB 2379650 32.36 927.55 -0.90
DELTACORP 18603200 23.86 177.00 -2.20
SBICARD 10716000 15.06 819.95 -2.20
PNB 292352000 11.50 76.90 3.91
LALPATHLAB 1013100 10.47 2361.55 0.93
HAL 5215500 8.12 3983.65 0.63
NATIONALUM 69367500 7.81 95.95 -1.74
SAIL 142848000 7.47 96.90 0.21
OI Losers
SCRIP OI
OI
CHG. (%)
PRICE
PRICE
CHG. (%)
RECLTD 17600 -8.05 250.45 2.90
CHAMBLFERT 14286100 -7.97 281.95 -1.71
CONCOR 6839000 -7.77 735.65 2.42
LUPIN 6420050 -6.26 1139.55 -1.36
PERSISTENT 1049825 -5.18 5838.85 -1.88
PIDILITIND 2603500 -4.87 2508.10 0.77
BRITANNIA 2153600 -4.85 4596.20 1.03
HDFCLIFE 18045500 -4.82 660.00 2.15
Put-Call Ratio
SCRIP PCR (OI) PCR (VOL)
NIFTY 1.10 0.97
BANKNIFTY 0.81 0.91
RELIANCE 0.48 0.38
ICICIBANK 0.59 0.52
INFY 0.47 0.51
www.angelone.in
Technical & Derivatives Report
September
20
, 2023
Note: Above mentioned Bullish or Bearish Spreads in Nifty (Sep Series) are given as an information and not as a recommendation.
Nifty Spot =
20
1
33.30
FII Statistics for
September
1
8
, 2023
Detail Buy
Contracts
OI Value
(in Cr.)
Sell Net
CHANGE
INDEX
FUTURES
1568.09 1899.57 (331.48) 193057 17280.25 (2.36)
INDEX
OPTIONS
1387141.83 1403865.04 (16723.21) 3406965 286797.23 (5.13)
STOCK
FUTURES
12259.00 12794.17 (535.17) 2355135 189285.27 0.64
STOCK
OPTIONS
26086.25 25920.76 165.49
346252 28354.23 3.77
Total
1427055.17
1444479.54
(17424.37) 6301409
521716.98
(2.50)
Turnover on
September
1
8
, 2023
Instrument
No. of
Contracts
Turnover
(in Cr.)
Change
(%)
Index Futures
223667 18380.88
-23.91
Index
Options
215643552
46857.32
-23.80
Stock Futures
975776 80692.05
7.15
Stock
Options
4541142 5395.46 2.03
Total
45,41,142
5395.46 -8.98
Bull-Call Spreads
Action Strike Price Risk Reward BEP
Buy
20100 170.55
56.90
43.10
20156.90
Sell
20200 113.65
Buy
20100 170.55
102.05
97.95
20202.05
Sell
20300 68.50
Buy
20200 113.65
45.15 54.85 20245.15
Sell
20300 68.50
Bear-Put Spreads
Action Strike Price Risk Reward BEP
Buy
20100 88.25
28.80
71.20
20071.20
Sell 20000 59.45
Buy 20100 88.25
48.60
151.40
20051.40
Sell
19900 39.65
Buy
20000 59.45
19.80 80.20 19980.20
Sell 19900 39.65
Nifty Put
-
Call Analysis
,0
500,000
1000,000
1500,000
2000,000
2500,000
3000,000
3500,000
4000,000
4500,000
5000,000
19500 19600 19700 19800 19900 20000 20100 20200 20300 20400 20500 20600 20700 20800
Call Put

www.angelone.in
Technical & Derivatives Report
September
20
, 2023
`
Daily Pivot Levels for Nifty Constituents
Scrips S2 S1 PIVOT R1 R2
ADANIENT 2,452 2,477 2,516 2,541 2,580
ADANIPORTS 816 824 836 843 856
APOLLOHOSP 5,007 5,041 5,102 5,136 5,196
ASIANPAINT 3,169 3,188 3,209 3,227 3,249
AXISBANK 1,014 1,019 1,025 1,030 1,035
BAJAJ-AUTO 5,001 5,089 5,182 5,270 5,363
BAJFINANCE 7,430 7,489 7,525 7,584 7,620
BAJAJFINSV 1,520 1,540 1,553 1,573 1,585
BPCL 347 354 357 364 368
BHARTIARTL 907 914 925 931 942
BRITANNIA 4,490 4,543 4,573 4,626 4,656
CIPLA 1,225 1,233 1,245 1,253 1,266
COALINDIA 271 276 279 285 288
DIVISLAB 3,744 3,765 3,792 3,813 3,841
DRREDDY 5,653 5,690 5,760 5,797 5,866
EICHERMOT 3,391 3,412 3,432 3,452 3,473
GRASIM 1,931 1,944 1,966 1,979 2,001
HCLTECH 1,280 1,293 1,302 1,314 1,324
HDFCBANK 1,608 1,618 1,637 1,647 1,666
HDFCLIFE 636 648 657 669 678
HEROMOTOCO 3,004 3,059 3,094 3,149 3,184
HINDALCO 476 480 487 491 498
HINDUNILVR 2,450 2,469 2,481 2,500 2,512
ICICIBANK 982 986 991 995 1,000
INDUSINDBK 1,437 1,447 1,455 1,465 1,473
INFY 1,478 1,485 1,495 1,502 1,512
ITC 443 448 451 455 459
JSW STEEL 803 806 810 813 818
KOTAKBANK 1,783 1,791 1,801 1,809 1,819
LT 2,896 2,908 2,919 2,931 2,942
LTIMINDTREE 5,450 5,482 5,503 5,535 5,555
M&M 1,570 1,606 1,638 1,674 1,706
MARUTI 10,417 10,470 10,547 10,599 10,676
NESTLEIND 22,317 22,568 22,704 22,955 23,091
NTPC 234 237 240 244 246
ONGC 184 185 186 188 189
POWERGRID 192 196 198 202 205
RELIANCE 2,421 2,429 2,440 2,448 2,459
SBILIFE 1,353 1,363 1,378 1,389 1,404
SBIN 592 598 603 609 614
SUNPHARMA 1,135 1,141 1,149 1,156 1,164
TCS 3,556 3,581 3,600 3,625 3,644
TATACONSUM
871 876 881 886 891
TATAMOTORS 628 634 639 646 650
TATASTEEL 127 129 132 134 137
TECHM 1,273 1,281 1,292 1,300 1,311
TITAN 3,208 3,274 3,313 3,379 3,418
ULTRACEMCO 8,527 8,577 8,658 8,708 8,788
UPL 621 626 632 637 643
WIPRO 432 434 437 440 443

www.angelone.in
Technical & Derivatives Report
September
20
, 2023
Technical and Derivatives Team:
Sameet Chavan Head Research – Technical & Derivatives sameet.chavan@angelone.in
Sneha Seth Senior Analyst – Technical & Derivatives sneha.seth@angelone.in
Rajesh Bhosale Analyst - Technical rajesh.bhosle@angelone.in
Osho Krishan Senior Analyst – Technical & Derivatives osho.krishan@angelone.in
Hitesh Rathi Analyst – Technical & Derivatives hitesh.rathi@angelone.in
Research Team Tel: 022 – 39357600 Website: www.angelone.in
For Technical Queries E-mail: technicalresearch-cso@angelone.in
For Derivatives Queries E-mail: derivatives.desk@angelone.in
DISCLAIMER
We, Angel One Limited (hereinafter referred to as “Angel”) a company duly incorporated under the provisions of the Companies Act, 1956 with
its registered office at 601, 6th Floor, Ackruti Star, Central Road, MIDC, Andheri East, Mumbai – 400093, CIN: (L67120MH1996PLC101709) and
duly registered as a member of National Stock Exchange of India Limited, Bombay Stock Exchange Limited, Metropolitan Stock Exchange Limited,
Multi Commodity Exchange of India Ltd and National Commodity & Derivatives Exchange Ltd. Angel One limited is a company engaged in
diversified financial services business including securities broking, DP services, distribution of Mutual Fund products. It is also registered as a
Depository Participant with CDSL and Portfolio Manager and Investment Adviser with SEBI. It also has registration with AMFI as a Mutual Fund
Distributor. Angel One Limited is a registered entity with SEBI for Research Analyst in terms of SEBI (Research Analyst) Regulations, 2014 vide
registration number INH000000164 and also registered with PFRDA as PoP ,Registration No.19092018. Angel Group does not have any joint
ventures or associates. Angel One Limited (formerly known as Angel Broking Limited) is the ultimate parent company of the Group. . Angel or its
associates has not been debarred/ suspended by SEBI or any other regulatory authority for accessing /dealing in securities Market.
AOL was merged with Angel Global Capital Private Limited and subsequently name of Angel Global Capital Private Limited was changed to Angel
Broking Private Limited (AOL) pursuant to scheme of Amalgamation sanctioned by the Hon'ble High Court of Judicature at Bombay by Orders
passed in Company Petition No 710 of 2011 and the approval granted by the Registrar of Companies. Further, name of Angel Broking Private
Limited again got changed to Angel Broking Limited (AOL) pursuant to fresh certificate of incorporation issued by Registrar of Companies (ROC)
dated June 28, 2018. Further name of Angel Broking name changed to Angel One Ltd pursuant to fresh certificate of incorporation issued by
Registrar of Companies (ROC) dated 23-09-21.
In case of any grievances please write to: support@angelone.in, Compliance Officer Details: Name : Hiren Thakkar, Tel No. –08657864228, Email
id - compliance@angelone.in
Registration granted by SEBI and certification from NISM in no way guarantee performance of the intermediary or provide any assurance of returns
to investors.
This document is solely for the personal information of the recipient, and must not be singularly used as the basis of any investment decision.
Nothing in this document should be construed as investment or financial advice. Each recipient of this document should make such investigations
as they deem necessary to arrive at an independent evaluation of an investment in the securities of the companies referred to in this document
(including the merits and risks involved), and should consult their own advisors to determine the merits and risks of such an investment.
Angel or its associates or research analyst or his relative may have actual/beneficial ownership of 1% or more in the securities of the subject
company at the end of the month immediately preceding the date of publication of the research report. Neither Angel or its associates nor
Research Analysts or his relative has any material conflict of interest at the time of publication of research report.
Angel or its associates might have received any compensation from the companies mentioned in the report during the period preceding twelve
months from the date of this report for services in respect of managing or co-managing public offerings, corporate finance, investment banking or
merchant banking, brokerage services or other advisory service in a merger or specific transaction in the normal course of business. Angel or its
associates did not receive any compensation or other benefits from the companies mentioned in the report or third party in connection with the
research report. Neither research entity nor research analyst has been engaged in market making activity for the subject company.

www.angelone.in
Technical & Derivatives Report
September
20
, 2023
*
Reports based on technical and derivative analysis center on studying charts of a stock's price movement, outstanding positions and trading
volume, as opposed to focusing on a company's fundamentals and, as such, may not match with a report on a company's fundamentals. Investors
are advised to refer the Fundamental and Technical Research Reports available on our website to evaluate the contrary view, if any.
The information in this document has been printed on the basis of publicly available information, internal data and other reliable sources believed
to be true, but we do not represent that it is accurate or complete and it should not be relied on as such, as this document is for general guidance
only. Angel One Limited or any of its affiliates/ group companies shall not be in any way responsible for any loss or damage that may arise to any
person from any inadvertent error in the information contained in this report. Angel One Limited does not warrant the accuracy, adequacy or
completeness of the service, information and materials and expressly disclaims liability for errors or omissions in the service, information and
materials. While Angel One Limited endeavours to update on a reasonable basis the information discussed in this material, there may be
regulatory, compliance, or other reasons that prevent us from doing so.
This document is being supplied to you solely for your information, and its contents, information or data may not be reproduced, redistributed or
passed on, directly or indirectly.
Neither Angel One Limited, nor its directors, employees or affiliates shall be liable for any loss or damage that may arise from or in connection
with the use of this information. Angel or its associates or Research Analyst or his relative might have financial interest in the subject company.
Research analyst has not served as an officer, director or employee of the subject company.
Investment in securities market are subject to market risks. Read all the related documents carefully before investing.
Any communication sent to clients on phone numbers or e-mail ids registered with the Trading Member is meant for client consumption and such
material should not be redistributed. Brokerage will not exceed SEBI prescribed limit. Any Information provided by us through any medium based
on our research or that of our affiliates or third parties or other external sources is subject to domestic and international market conditions and
we do not guarantee the availability or otherwise of any securities or other instruments and such Information is merely an estimation of certain
investments, and we have not and shall not be deemed to have assumed any responsibility for any such Information. You should seek independent
professional advice and/or tax advice regarding the suitability of any investment decision whether based on any Information provided by us
through the Site from inhouse research or third party reports or otherwise.
The report and information contained herein is strictly confidential and meant solely for the selected recipient and may not be altered in any way,
transmitted to, copied or distributed, in part or in whole, to any other person or to the media or reproduced in any form, without prior written
consent.
