SEPT 20, 2022
www.angelone.in
Technical & Derivatives Report
xOOOOOOOO
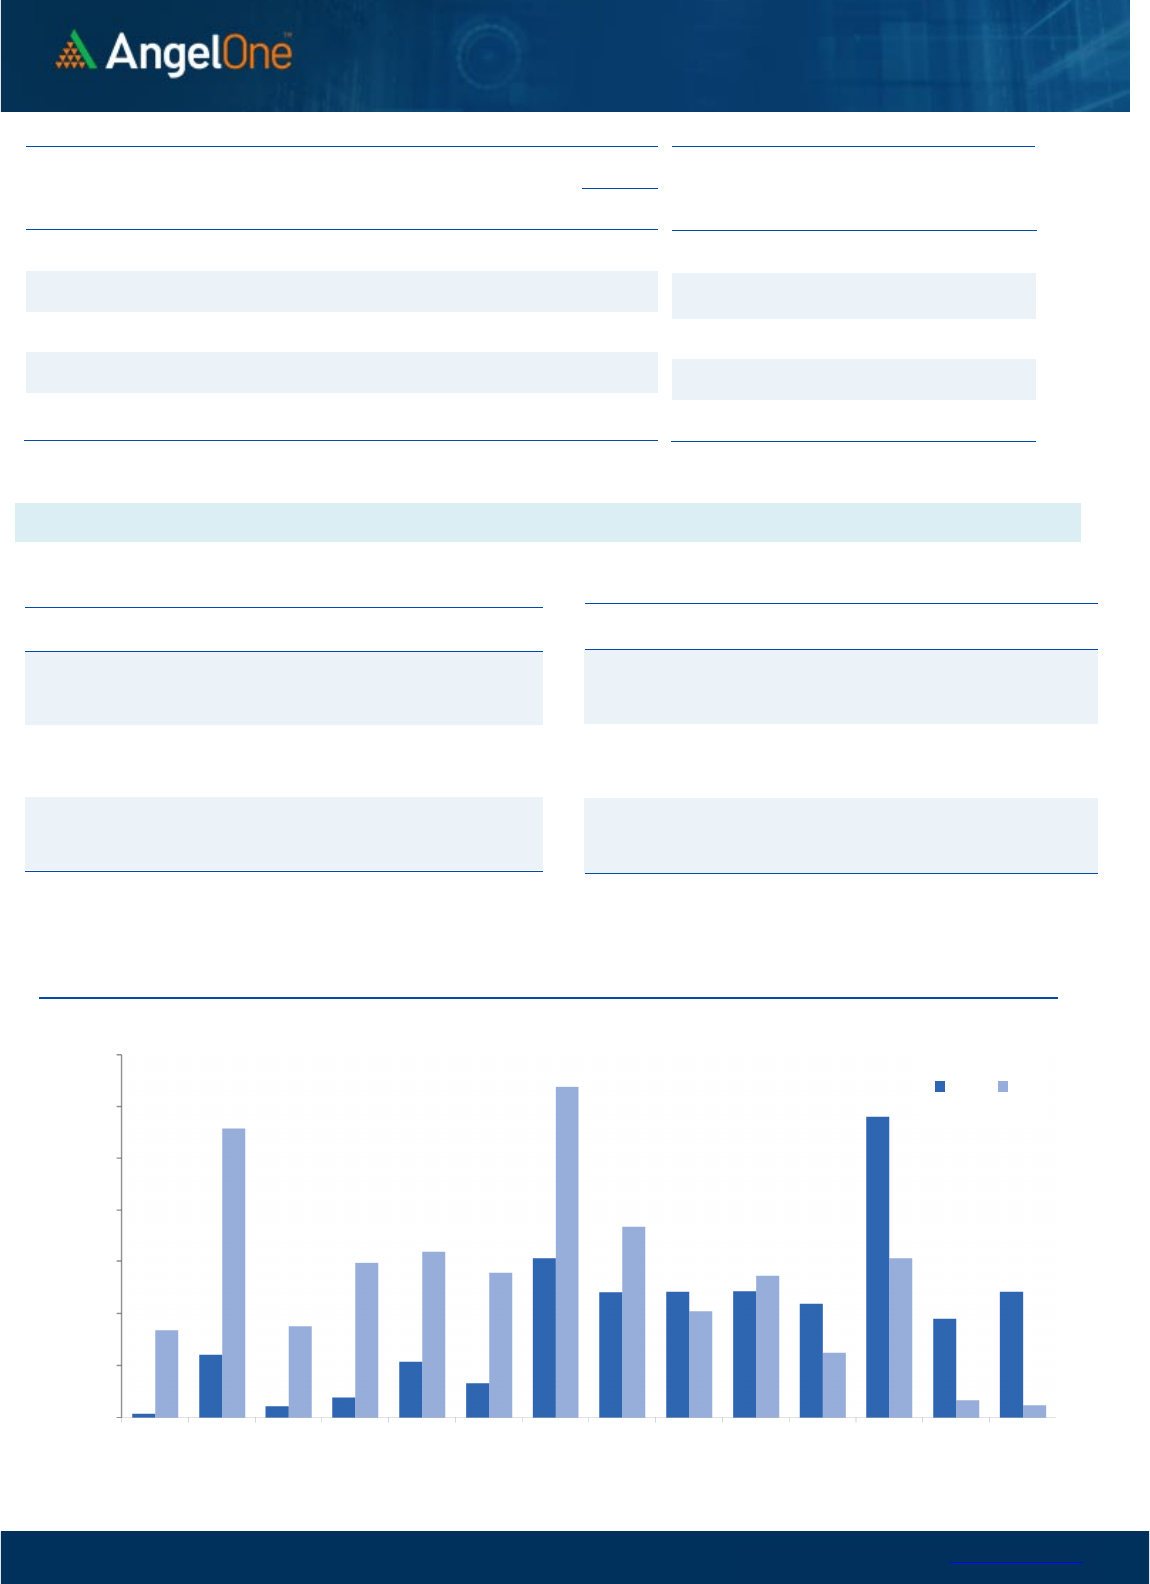
Nifty Bank Outlook (40904)
Bank Nifty as well started on a weak note however post the initial
dip towards Friday's low a strong bounce back was seen during the
first hour. There was no major traction after that, and the bank
index remained within a range throughout the session to end with
gains of 0.31% tad above 40900.
The bank index continues to consolidate within the strong bullish
candle formed on Wednesday 14th September. The low of this
candle at 40288 is a very sacrosanct level as if broken can trigger
the bearish Shooting Star pattern formed last week on the weekly
chart. As long it holds the primary trend remains positive and any
dips should be considered buying opportunity. On the higher side,
41500 - 41840 is the stiff resistance zone. For the Shooting Star
pattern to neglect and to trigger the positive momentum back, the
Bank Nifty needs to close above 41840. Traders are hence advised
to keep a tab on the mentioned levels and since the volatility is
likely to be on the higher side avoid being complacent.
Key Levels
Support 1 – 40500 Resistance 1 – 41500
Support 2 – 40300 Resistance 2 – 41840
Exhibit 1: Nifty
Daily
Chart
Exhibit 2: Nifty Bank
Weekly
Chart
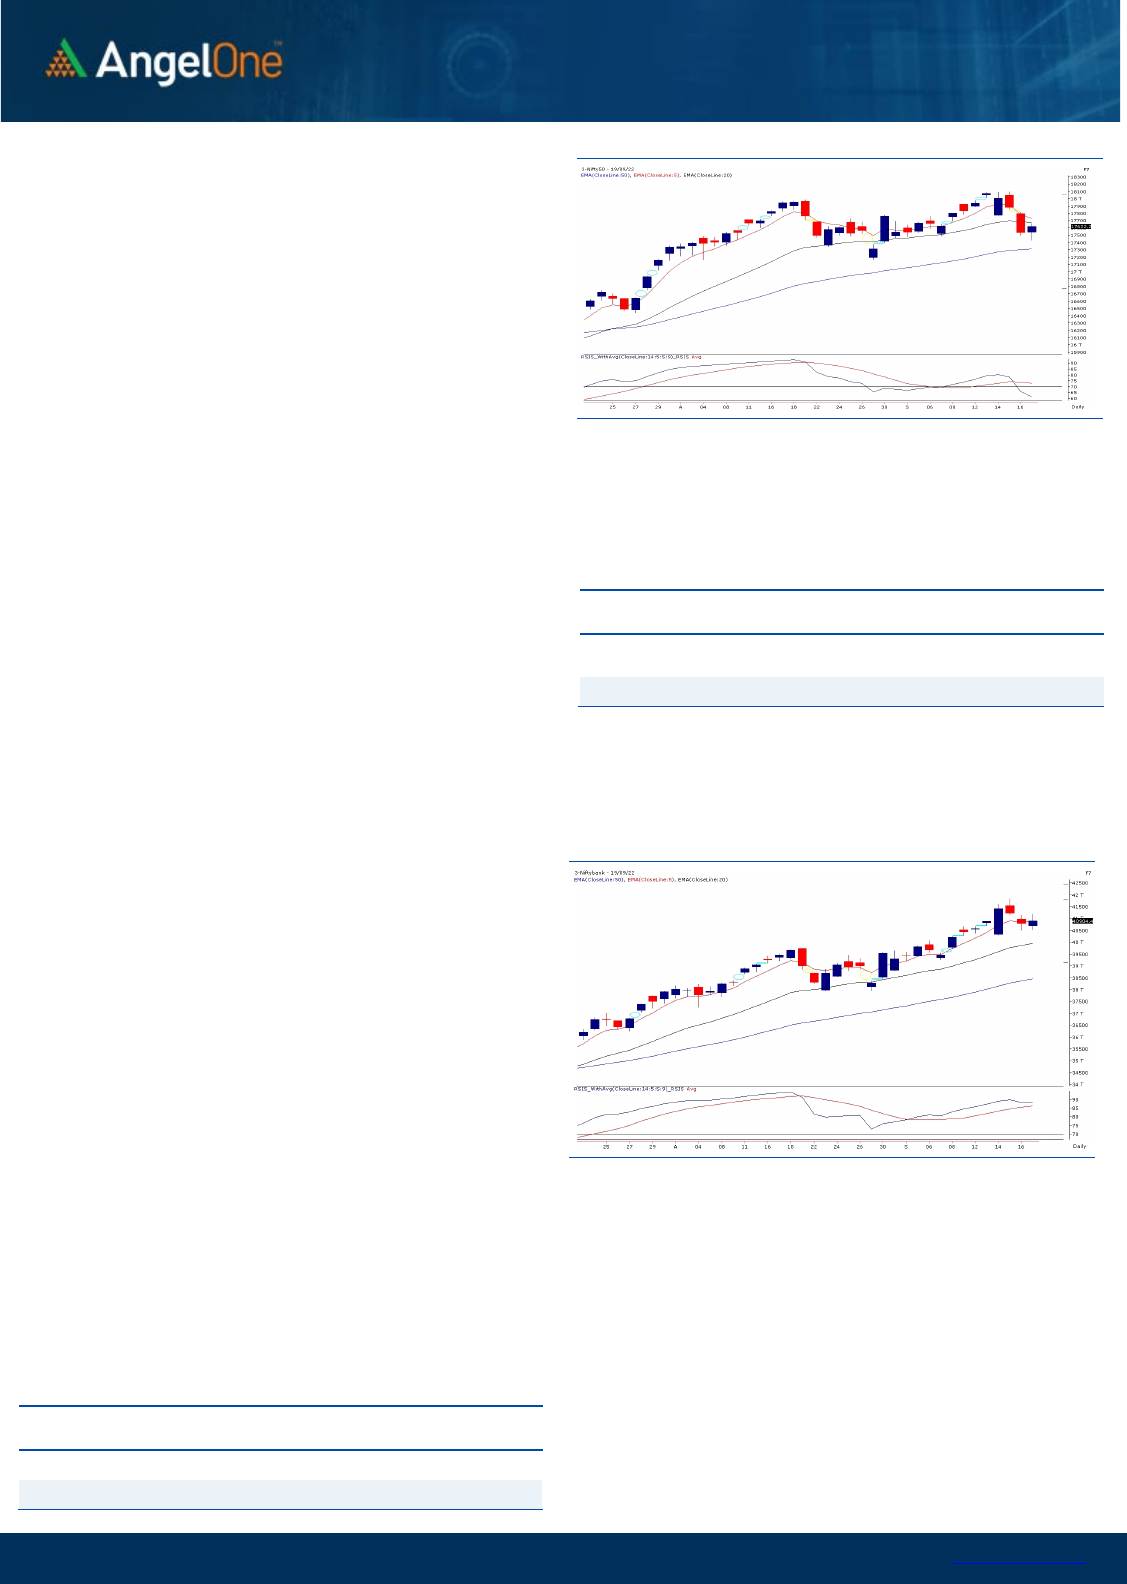
Sensex (59141) / Nifty (17622)
The weakness in the global market led to a mild start in Indian
equities, wherein the benchmark index started the session on a
nervous note. Soon after, the bulls grabbed the opportunity and
made a modest recovery in the index, post which slender range-
bound moves were seen throughout the day. Amidst the lackluster
session, the bulls showed their resilience and snapped the losing
momentum of the past three days. The Nifty concluded the day with
a gain of 0.52 percent and settled a tad above the 17600 level.
We allude to our previous commentary on the market being
tentative amid uncertainty in the global bourses. However, the
undertone is expected to remain upbeat till Nifty sustains above the
unfilled gap of 17400-17380 odd zone. Meanwhile, some
tentativeness could be sensed until the unfilled gap of 17820-17860
is not taken out. Looking at the technical setup, the market is likely
to trade within the mentioned range until a decisive breakout is not
seen on either side in the comparable period.
Going forward, many stock-specific adjustments are likely to
continue and provide substantial trading opportunities. Hence,
traders are advised to have a stock-centric approach and stay
abreast with global and domestic developments on a regular
basis.
Key Levels
Support 1 – 17400 Resistance 1 – 17820
Support 2 – 17380 Resistance 2 – 17860

www.angelone.in
Technical & Derivatives Report
SEPT 20, 2022
View
We had flat to positive start for the week, wherein we
witnessed a smart upmove in initial hour of trade to
reclaim 17650. However, as we progressed index
traded in a range to settle the day tad above 17600.
FIIs were net buyers in the cash market segment to
the tune of Rs. 312 crores. Simultaneously, in Index
futures, they bought worth Rs. 1173 crores with fall in
open interest, indicating covering of bearish bets.
In F&O space, we observed decent short covering in
Nifty, whereas no major open interest change was
observed in case of banking index. Stronger hands
bought equities and covered shorts in index futures
segment, which is a positive development. Now, their
index futures Long Short Ratio has improved from 28%
to 32%. Interestingly, we saw decent unwinding in ATM
and OTM call strikes along with writing in 17500-17600
put strikes. Considering the above development in
above data, we expect 17400-17500 to act as a strong
base now and any move beyond 17800 on the closing
basis shall boost the overall sentiment in market.
Comments
The Nifty futures open interest has decreased by
4.10%. and Bank Nifty futures open interest has
increased by 0.18% as the market closed at 17622.25.
The Nifty Sep future closed with a premium of 5.75
point against a premium of 35.30 point in the last
trading session. The Oct series closed at a premium
of 60.85 point.
The INDIA VIX increased from 19.82 to 19.94. At the
same time, the PCR-OI of Nifty has increased from
0.76 to 0.94.
Few of the liquid counters where we have seen high
cost of carry are AMBUJACEM, INDIACEM, ESCORTS,
M&M and MFSL.
Historical Volatility
SCRIP HV
IDEA 81.66
RBLBANK 72.83
IBULHSGFIN 73.12
ZEEL 64.13
HINDCOPPER 62.91
*HV data as per Friday 16
th
SEPT closing.
Nifty Vs OI
17200
17300
17400
17500
17600
17700
17800
17900
18000
18100
18200
12,000
12,500
13,000
13,500
14,000
14,500
15,000
9/2 9/6 9/8 9/12 9/14 9/16
Openinterest Nifty
OI Gainers
SCRIP OI
OI
CHG. (%)
PRICE
PRICE
CHG. (%)
CANFINHOME 3303300 61.87 635.00 -7.26
ESCORTS 2217050 31.47 1929.90 8.32
MUTHOOTFIN 7809750 12.41 1033.40 -0.43
GUJGASLTD 5803750 9.14 504.25 -2.06
LTTS 1079800 6.43 3432.80 -3.06
TVSMOTOR 7564200 6.00 1024.85 0.57
M&MFIN 21096000 5.95 226.10 -1.43
AARTIIND 2981800 4.34 884.80 -2.11
OI Losers
SCRIP OI
OI
CHG. (%)
PRICE
PRICE
CHG. (%)
INDIACEM 15747000 -19.97 266.10 8.76
ASTRAL 1513050 -7.70 2338.85 0.46
LUPIN 8094550 -7.41 632.15 1.26
BSOFT 9120800 -5.07 308.10 -2.29
BAJAJ-AUTO 3295750 -5.06 3689.60 0.62
PVR 4673988 -4.64 1761.20 1.10
HAVELLS 4356500 -4.33 1302.35 0.63
POLYCAB 862200 -4.20 2599.35 -0.55
Put-Call Ratio
SCRIP PCR (OI) PCR (VOL)
NIFTY 0.94 0.82
BANKNIFTY 0.85 0.96
RELIANCE 0.46 0.42
ICICIBANK 0.63 0.74
INFY 0.36 0.39
www.angelone.in
Technical & Derivatives Report
SEPT 20, 2022
Note: Above mentioned Bullish or Bearish Spreads in Nifty (Sep Series) are given as an information and not as a recommendation.
Nifty Spot =
1
7
,
622.25
FII Statistics for
September
1
9
, 2022
Detail Buy
Contracts
Open
Interest
Value
(in Cr.)
Sell
Net
CHANGE
INDEX
FUTURES
4287.68
3114.35
1173.33
125431
11638.85
(5.99)
INDEX
OPTIONS
712813.16
717047.35
(4234.19) 1392880
127869.13
(6.33)
STOCK
FUTURES
12874.25
12832.17
42.08
2177219
152082.75
(0.29)
STOCK
OPTIONS
11097.36
11097.65
(0.29) 207162
14883.63
0.09
Total 741072.45
744091.52
(3019.07) 3902692
306474.36
(2.70)
Turnover on
September
1
9
, 2022
Instrument
No. of
Contracts
Turnover
( in Cr. )
Change
(%)
Index
Futures
356262 33647.31 -31.75
Index
Options
93257526
8922281.42 0.43
Stock
Futures
912529 68004.50 -29.49
Stock
Options
4079166 320070.42 -14.50
Total
4,079,166
320070.42 -0.64
Bull-Call Spreads
Action Strike Price Risk Reward BEP
Buy
17600 310.55
57.65
42.35
17657.65
Sell
17700 252.90
Buy
17600 310.55
110.05
89.95
17710.05
Sell
17800 200.50
Buy
17700 252.90
52.40 47.60 17752.40
Sell 17800 200.50
Bear
-
Put Spreads
Action Strike Price Risk Reward BEP
Buy 17600 223.95
40.90
59.10
17559.10
Sell
17500 183.05
Buy 17600 223.95
75.70
124.30
17524.30
Sell 17400 148.25
Buy
17500 183.05
34.80 65.20 17465.20
Sell 17400 148.25
Nifty Put
-
Call Analysis
,0
500,000
1000,000
1500,000
2000,000
2500,000
3000,000
3500,000
16900 17000 17100 17200 17300 17400 17500 17600 17700 17800 17900 18000 18100 18200
Call Put

www.angelone.in
Technical & Derivatives Report
SEPT 20, 2022
`
Daily Pivot Levels for Nifty Constituents
Scrips
S2
S1
PIVOT
R1 R2
ADANIPORTS
919
939
956
976
993
APOLLOHOSP
4,184
4,246
4,289
4,351
4,393
ASIANPAINT
3,186
3,251
3,297
3,362
3,407
AXISBANK
780
789
796
805
811
BAJAJ-AUTO 3,630 3,669
3,700 3,740
3,771
BAJFINANCE 7,070 7,283
7,404
7,617
7,737
BAJAJFINSV 1,718 1,742
1,761 1,785
1,803
BPCL
316
318
322
324
327
BHARTIARTL 767 775
780
788
794
BRITANNIA
3,521
3,557
3,600 3,635 3,678
CIPLA
1,003
1,020
1,032
1,049
1,061
COALINDIA 226 228
230
232
234
DIVISLAB 3,532 3,576
3,604 3,648
3,676
DRREDDY 3,955 4,027
4,069 4,141
4,183
EICHERMOT 3,432 3,511
3,572
3,651
3,713
GRASIM 1,710 1,730
1,746
1,766
1,783
HCLTECH
878
888
897
907
917
HDFCBANK
1,465
1,484
1,499
1,518
1,533
HDFCLIFE
535
542
549
556
563
HDFC
2,371
2,406
2,428 2,463
2,485
HEROMOTOCO 2,638 2,671
2,698 2,731 2,758
HINDALCO 401 406
411
417
422
HINDUNILVR 2,478 2,529
2,558
2,609
2,638
ICICIBANK
885
892
902
909
920
INDUSINDBK 1,195 1,211
1,233
1,249
1,271
INFY
1,367
1,379
1,392
1,404
1,418
ITC 326 331
334
339
342
JSW STEEL 666 673
682
689
698
KOTAKBANK
1,893
1,911
1,926
1,944
1,958
LT
1,889
1,900
1,916 1,927
1,943
M&M 1,231 1,260
1,279
1,308
1,327
MARUTI 8,958 9,119
9,231
9,393
9,505
NESTLEIND
18,051
18,408
18,624
18,981
19,197
NTPC 168 170
172
173
175
ONGC
127
129
132
133
136
POWERGRID
228
231
234
237 241
RELIANCE
2,461
2,482
2,502 2,523
2,544
SBILIFE
1,259
1,281
1,295
1,317
1,330
SHREECEM 22,659 23,030
23,383 23,754
24,106
SBIN
554
563
569
578
584
SUNPHARMA
849
862
870
882
890
TCS
2,965
2,997
3,020 3,051 3,074
TATACONSUM
779 786
794
801
809
TATAMOTORS 419 422
427
430
435
TATASTEEL
101
102
104 105
107
TECHM
1,009
1,024
1,038
1,053
1,067
TITAN
2,522
2,571
2,601
2,650
2,681
ULTRACEMCO
6,138
6,299
6,405
6,566
6,673
UPL
686
699
709
722
731
WIPRO
393
397
402
406
411

www.angelone.in
Technical & Derivatives Report
SEPT 20, 2022
*
Technical and Derivatives Team:
Sameet Chavan Chief Analyst – Technical & Derivatives sameet.chavan@angelone.in
Sneha Seth Senior Analyst – Technical & Derivatives sneha.seth@angelone.in
Rajesh Bhosale Technical Analyst rajesh.bhosle@angelone.in
Osho Krishan Senior Analyst – Technical & Derivatives osho.krishan@angelone.in
Research Team Tel: 022 – 39357600 Website: www.angelone.in
For Technical Queries E-mail: technicalresearch-cso@angelone.in
For Derivatives Queries E-mail: derivatives.desk@angelone.in
DISCLAIMER
Angel One Limited (hereinafter referred to as “Angel”) is a registered Member of National Stock Exchange of India Limited, Bombay
Stock Exchange Limited and Metropolitan Stock Exchange Limited. It is also registered as a Depository Participant with CDSL and
Portfolio Manager and investment advisor with SEBI. It also has registration with AMFI as a Mutual Fund Distributor. Angel One
Limited is a registered entity with SEBI for Research Analyst in terms of SEBI (Research Analyst) Regulations, 2014 vide registration
number INH000000164. Angel or its associates has not been debarred/ suspended by SEBI or any other regulatory authority for
accessing /dealing in securities Market.
This document is solely for the personal information of the recipient, and must not be singularly used as the basis of any investment
decision. Nothing in this document should be construed as investment or financial advice. Each recipient of this document should
make such investigations as they deem necessary to arrive at an independent evaluation of an investment in the securities of the
companies referred to in this document (including the merits and risks involved), and should consult their own advisors to determine
the merits and risks of such an investment.
Angel or its associates or research analyst or his relative may have actual/beneficial ownership of 1% or more in the securities of
the subject company at the end of the month immediately preceding the date of publication of the research report. Neither Angel or
its associates nor Research Analysts or his relative has any material conflict of interest at the time of publication of research report.
Angel or its associates might have received any compensation from the companies mentioned in the report during the period
preceding twelve months from the date of this report for services in respect of managing or co-managing public offerings, corporate
finance, investment banking or merchant banking, brokerage services or other advisory service in a merger or specific transaction
in the normal course of business. Angel or its associates did not receive any compensation or other benefits from the companies
mentioned in the report or third party in connection with the research report. Neither Angel nor its research analyst entity has been
engaged in market making activity for the subject company.
Reports based on technical and derivative analysis center on studying charts of a stock's price movement, outstanding positions and
trading volume, as opposed to focusing on a company's fundamentals and, as such, may not match with a report on a company's
fundamentals. Investors are advised to refer the Fundamental and Technical Research Reports available on our website to evaluate
the contrary view, if any.
The information in this document has been printed on the basis of publicly available information, internal data and other reliable
sources believed to be true, but we do not represent that it is accurate or complete and it should not be relied on as such, as this
document is for general guidance only. Angel One Limited or any of its affiliates/ group companies shall not be in any way responsible
for any loss or damage that may arise to any person from any inadvertent error in the information contained in this report. Angel One
Limited has not independently verified all the information contained within this document. Accordingly, we cannot testify, nor make
any representation or warranty, express or implied, to the accuracy, contents or data contained within this document. While Angel
One Limited endeavors to update on a reasonable basis the information discussed in this material, there may be regulatory,
compliance, or other reasons that prevent us from doing so.
This document is being supplied to you solely for your information, and its contents, information or data may not be reproduced,
redistributed or passed on, directly or indirectly.
Neither Angel One Limited, nor its directors, employees or affiliates shall be liable for any loss or damage that may arise from or in
connection with the use of this information. Angel or its associates or Research Analyst or his relative might have financial interest
in the subject company. Research analyst has not served as an officer, director or employee of the subject company.
