
May 20, 2022
www.angelone.in
Technical & Derivatives Report
Nifty Bank Outlook
-
(33316
)
Bank Nifty as well started with a massive gap down opening and
with no significant intraday bounce continued to creep lower
throughout the session to eventually end with a loss of around
2.50% at 33316.
Looking at the decent bounce of the initial part of the week and
placement of RSI smoothed on the daily chart we were of a view
that the current bounce may extend in the near term however
the mayhem seen across the global financial markets spilled
water on this expectation. With yesterday's sell-off prices are
back to key support levels around the 33000 levels and the
oscillators are still in the oversold zone. It would be crucial to
see how markets react around this make or break level; if they
slip below it then further weakness can be seen towards the
March swing low of 32000 - 32200 levels. On the flip side, it
would be a daunting task for the bulls to reclaim yesterday's lost
ground and the bearish gap zone between 33600 - 34200 is
likely to act as resistance. Volatility is likely to remain high and
traders are advised to avoid undue risk.
Key Levels
Support 1 – 33000 Resistance 1 – 33600
Support 2 – 32200 Resistance 2 – 34000
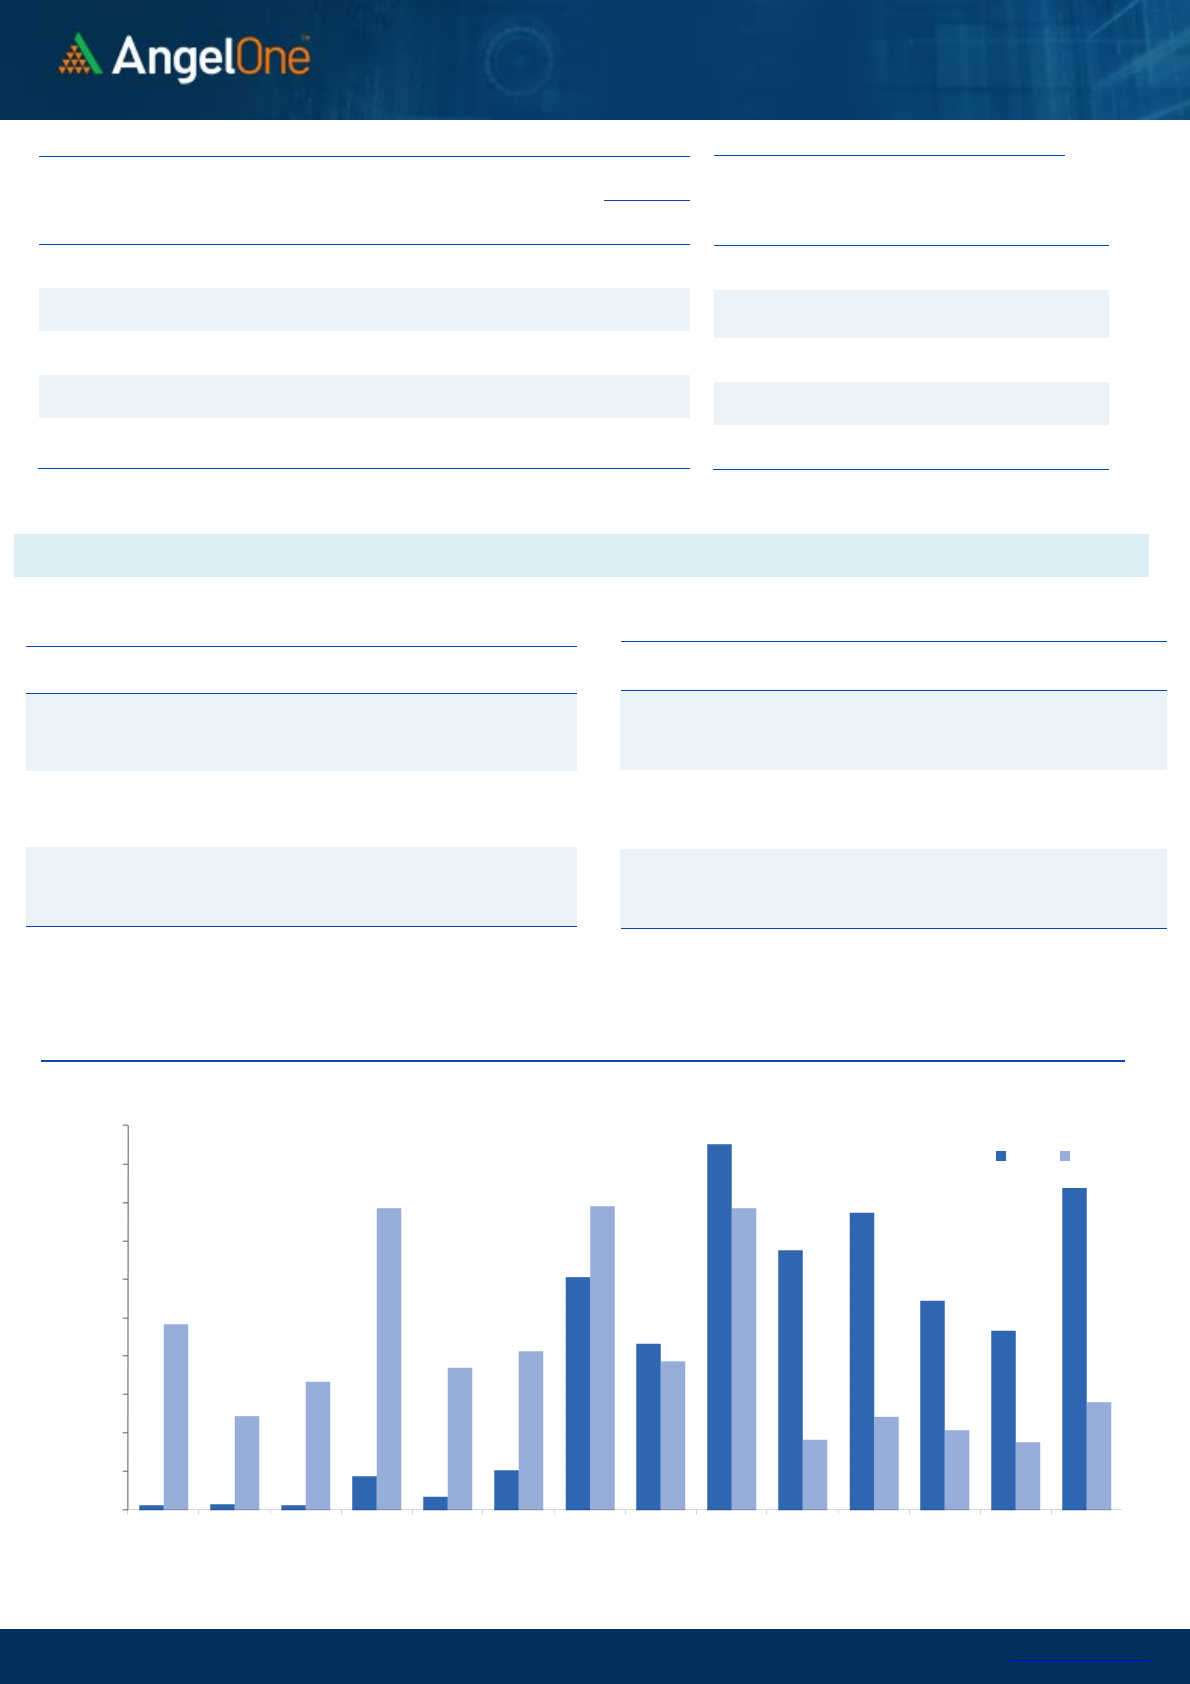
Exhibit 1: Nifty Daily Chart
Exhibit 2: Nifty Bank Daily Chart
Sensex (52792) / Nifty (15809
)
Yesterday’s opening was painful as Nifty opened lower with
nearly 300 points due to massive overnight sell off in US bourses.
This has certainly caught lot of momentum traders on the wrong
foot who had carried over their longs after Tuesday’s sharp
rebound. Barring negligible bounce in the initial trades, the index
kept decelerating downwards to test the 15800 mark. But
fortunately, there was no major damage seen during the day as
compared to the global screen. Eventually, the tragic weekly
expiry day ended with over two and half a percent cut to the
previous close.
Honestly speaking, yesterday’s gap down opening was
completely out of syllabus thing for most of the market
participants, including us. In fact, all the pre-market strategies
went for a toss as Nifty opened convincingly below the strong
psychological support of 16000. Now we are once again very
much closer to the crucial support zone of 15740 – 15650.
Whether we are going to break this and fall below it or not, the
time will tell and importantly, it depends on how things pan out
globally over the next couple of sessions. Similar to last Friday,
we are still hopeful on holding on to this support. But if this has
to happen, we need to have some solid trigger on the global front,
which will help our market defend this zone.
At this juncture, it’s better to take one step at a time. As far as
levels are concerned, 16000 – 16100 once again becomes a
sturdy wall and till the time, it does not get surpassed, we are
likely to see selling pressure at higher levels.
Key Levels
Support 1 – 15740 Resistance 1 – 16000
Support 2 – 15650 Resistance 2 – 16100

www.angelone.in
Technical & Derivatives Report
May 20, 2022
View
Our market plummeted, tracking the massive
overnight sell-off in the US bourses. The benchmark
index NIFTY shed over 2.65 percent on the expiry day
to close a tad above the 15800 level.
FIIs were net sellers in the cash market segment
to the tune of Rs. 4900 crores. Simultaneously, in
Index futures, they sold worth Rs. 921 crores with
an increase in open interest, indicating short
formation.
Looking at the F&O data, fresh shorts have been
added to both indices. On the options front, the
15800 put strike has seen some addition in the OI,
followed by the 15600-15500 PE, where significant
OI concentration has piled up. On the contrary, a
considerable OI concentration is built on the 16000-
16100 call strikes, suggesting it to be the sturdy
hurdle for Nifty. Considering the recent
developments, some tentativeness could be sensed
among market participants amid the uncertainties
in the global market. Hence, traders are advised to
keep a close tab on global developments and avoid
any aggressive bets for the time being.
Comments
The Nifty futures open interest has increased by 7.99%.
and BANK Nifty futures open interest has increased by
0.02% as the market closed at 15809.40.
The Nifty May future closed with a discount of 39.95
point against a discount of 14.25 point in the last trading
session. The June series closed at a discount of 32.55
point.
The INDIA VIX increased from 22.29 to 24.55. At the
same time, the PCR-OI of Nifty decreased from 0.87 to
0.71.
Few of the liquid counters where we have seen high
cost of carry are MANAPPURAM, TCS, LUPIN, WIPRO
and HCLTECH.
Historical Volatility
SCRIP HV
IDEA 94.76
IBULHSGFIN 78.66
ZEEL 72.08
HINDCOPPER 67.81
RBLBANK 66.83
Nifty Vs OI
15000
15500
16000
16500
17000
17500
,0
2,000
4,000
6,000
8,000
10,000
12,000
14,000
16,000
18,000
4-29 5-4 5-6 5-10 5-12 5-16 5-18
Openinterest Nifty
OI Gainers
SCRIP OI
OI
CHG. (%)
PRICE
PRICE
CHG. (%)
ADANIPORTS 94705000 17.45 732.80 -3.49
CUB 12660200 11.60 124.90 0.16
ASTRAL 732600 9.99 1665.65 -4.97
HDFCAMC 4926200 9.32 1706.75 -3.86
HINDPETRO 15930000 8.34 239.00 -1.82
BRITANNIA 1691800 7.39 3332.10 -1.95
JUBLFOOD 11907500 7.30 481.70 -1.75
TCS 12321900 7.22 3264.05 -5.56
OI Losers
SCRIP OI
OI
CHG. (%)
PRICE
PRICE
CHG. (%)
ITC 107872000 -15.73 275.65 3.04
COROMANDEL 1508500 -8.05 908.60 -2.54
DELTACORP 17820400 -6.94 228.40 -0.11
PERSISTENT 434550 -6.06 3616.40 -6.44
BALRAMCHIN 7443200 -4.98 407.05 -5.02
INTELLECT 1179000 -4.50 625.80 -3.30
LICHSGFIN 23712000 -4.22 354.45 -1.21
DEEPAKNTR 1256250 -3.66 1981.85 -2.86
Put-Call Ratio
SCRIP PCR (OI) PCR (VOL)
NIFTY 0.71 0.87
BANKNIFTY 0.82 0.99
RELIANCE 0.30 0.52
ICICIBANK 0.47 0.75
INFY 0.37 0.65
www.angelone.in
Technical & Derivatives Report
May 20, 2022
Note: Above mentioned Bullish or Bearish Spreads in Nifty (May Series) are given as an information and not as a recommendation.
Nifty Spot = 1
5809
.
4
0
FII Statistics for
May
1
9
, 2022
Detail Buy
Contracts
Open
Interest
Value
(in Cr.)
Sell
Net
CHANGE
INDEX
FUTURES
4838.54 5759.31 (920.77) 183823 14723.13 11.05
INDEX
OPTIONS
1056857.01 1039952.96 16904.05
1528187 121736.38 (21.31)
STOCK
FUTURES
19544.89 19501.12 43.77
2417214 145668.64 3.37
STOCK
OPTIONS
9274.52 9296.75 (22.23) 160967 10064.66 1.80
Total
1090514.96
1074510.14
16004.82
4290191
292192.81
(6.82)
Turnover on
May
1
9
, 2022
Instrument
No. of
Contracts
Turnover
( in Cr. )
Change
(%)
Index
Futures
485014 39173.37 1.65
Index
Options
208656124 17132694.46 56.34
Stock
Futures
1137875 69058.73 8.94
Stock
Options
3745452 239986.56
-4.42
Total
37,45,452 239986.56
54.54
Bull
-
Call Spreads
Action Strike Price Risk Reward BEP
Buy
15800 192.00
48.25 51.75 15848.25
Sell
15900 143.75
Buy
15800 192.00
88.30 111.70 15888.30
Sell
16000 103.70
Buy
15900 143.75
40.05 59.95 15940.05
Sell 16000 103.70
Bear
-
Put Spreads
Action Strike Price Risk Reward BEP
Buy
15800 224.65
43.00 57.00 15757.00
Sell
15700 181.65
Buy
15800 224.65
80.55 119.45 15719.45
Sell
15600 144.10
Buy
15700 181.65
37.55 62.45 15662.45
Sell
15600 144.10
Nifty Put
-
Call Analysis
,0
500,000
1000,000
1500,000
2000,000
2500,000
3000,000
3500,000
4000,000
4500,000
5000,000
15200 15300 15400 15500 15600 15700 15800 15900 16000 16100 16200 16300 16400 16500
Call Put

www.angelone.in
Technical & Derivatives Report
May 20, 2022
`
Daily Pivot Levels for Nifty Constituents
Scrips
S2
S1
PIVOT
R1
R2
ADANIPORTS 719 726
737 743 754
APOLLOHOSP 3,545 3,588
3,653 3,697 3,761
ASIANPAINT 2,968 3,008
3,040 3,079 3,111
AXISBANK 633 642
650 658 666
BAJAJ-AUTO 3,621 3,660
3,719 3,758 3,817
BAJFINANCE 5,554 5,630
5,688 5,764 5,822
BAJAJFINSV 12,002 12,208
12,380 12,586 12,758
BPCL 321 324
327 330 333
BHARTIARTL 653 664
678 689 704
BRITANNIA 3,262 3,297
3,343 3,378 3,423
CIPLA 923 930
942 950 962
COALINDIA 179 180
182 183 185
DIVISLAB 4,095 4,147
4,242 4,294 4,389
DRREDDY 3,739 3,834
3,924 4,020 4,110
EICHERMOT 2,554 2,602
2,670 2,718 2,786
GRASIM 1,434 1,446
1,458 1,470 1,483
HCLTECH 970 990
1,024 1,044 1,078
HDFCBANK 1,269 1,278
1,287 1,296 1,305
HDFCLIFE 512 520
534 542 556
HDFC 2,103 2,120
2,139 2,156 2,176
HEROMOTOCO 2,473 2,494
2,522 2,543 2,570
HINDALCO 407 412
419 424 431
HINDUNILVR 2,226 2,245
2,265 2,284 2,303
ICICIBANK 678 684
692 697 705
INDUSINDBK 842 854
872 885 903
INFY 1,376 1,402
1,443 1,469 1,510
ITC 256 266
273 282 289
JSW STEEL 573 587
606 619 639
KOTAKBANK 1,747 1,765
1,796 1,814 1,845
LT 1,528 1,538
1,550 1,560 1,573
M&M 859 871
892 904 925
MARUTI 7,298 7,351
7,438 7,491 7,578
NESTLEIND 15,868 15,981
16,113 16,226 16,358
NTPC 145 146
147 149 150
ONGC 156 158
160 162 164
POWERGRID 219 223
227 231 235
RELIANCE 2,440 2,460
2,486 2,506 2,533
SBILIFE 1,032 1,044
1,059 1,071 1,086
SHREECEM 21,479 21,848
22,074 22,443 22,669
SBIN 442 445
447 450 453
SUNPHARMA 866 875
888 897 909
TCS 3,124 3,193
3,299 3,368 3,474
TATACONSUM
701 711
729 739 757
TATAMOTORS 390 394
401 405 411
TATASTEEL 1,091 1,107
1,131 1,146 1,170
TECHM 1,067 1,088
1,121 1,142 1,175
TITAN 2,007 2,059
2,108 2,160 2,209
ULTRACEMCO 5,973 6,023
6,100 6,149 6,226
UPL 798 806
811 819 824
WIPRO 435 443
458 467 482

www.angelone.in
Technical & Derivatives Report
May 20, 2022
*
Technical and Derivatives Team:
Sameet Chavan
Chief Analyst
–
Technical & Derivatives
sameet.chavan@angelone.in
Sneha Seth Senior Analyst – Technical & Derivatives sneha.seth@angelone.in
Rajesh Bhosale Technical Analyst rajesh.bhosle@angelone.in
Osho Krishan Senior Analyst – Technical & Derivatives osho.krishan@angelone.in
Research Team Tel: 022 – 39357600 (Extn. 6844) Website: www.angelone.in
For Technical Queries E-mail: technicalresearch-cso@angelone.in
For Derivatives Queries E-mail: derivatives.desk@angelone.in
DISCLAIMER
Angel One Limited (hereinafter referred to as “Angel”) is a registered Member of National Stock Exchange of India Limited, Bombay
Stock Exchange Limited and Metropolitan Stock Exchange Limited. It is also registered as a Depository Participant with CDSL and
Portfolio Manager and investment advisor with SEBI. It also has registration with AMFI as a Mutual Fund Distributor. Angel One
Limited is a registered entity with SEBI for Research Analyst in terms of SEBI (Research Analyst) Regulations, 2014 vide registration
number INH000000164. Angel or its associates has not been debarred/ suspended by SEBI or any other regulatory authority for
accessing /dealing in securities Market.
This document is solely for the personal information of the recipient, and must not be singularly used as the basis of any investment
decision. Nothing in this document should be construed as investment or financial advice. Each recipient of this document should
make such investigations as they deem necessary to arrive at an independent evaluation of an investment in the securities of the
companies referred to in this document (including the merits and risks involved), and should consult their own advisors to determine
the merits and risks of such an investment.
Angel or its associates or research analyst or his relative may have actual/beneficial ownership of 1% or more in the securities of
the subject company at the end of the month immediately preceding the date of publication of the research report. Neither Angel or
its associates nor Research Analysts or his relative has any material conflict of interest at the time of publication of research report.
Angel or its associates might have received any compensation from the companies mentioned in the report during the period
preceding twelve months from the date of this report for services in respect of managing or co-managing public offerings, corporate
finance, investment banking or merchant banking, brokerage services or other advisory service in a merger or specific transaction
in the normal course of business. Angel or its associates did not receive any compensation or other benefits from the companies
mentioned in the report or third party in connection with the research report. Neither Angel nor its research analyst entity has been
engaged in market making activity for the subject company.
Reports based on technical and derivative analysis center on studying charts of a stock's price movement, outstanding positions and
trading volume, as opposed to focusing on a company's fundamentals and, as such, may not match with a report on a company's
fundamentals. Investors are advised to refer the Fundamental and Technical Research Reports available on our website to evaluate
the contrary view, if any.
The information in this document has been printed on the basis of publicly available information, internal data and other reliable
sources believed to be true, but we do not represent that it is accurate or complete and it should not be relied on as such, as this
document is for general guidance only. Angel One Limited or any of its affiliates/ group companies shall not be in any way responsible
for any loss or damage that may arise to any person from any inadvertent error in the information contained in this report. Angel One
Limited has not independently verified all the information contained within this document. Accordingly, we cannot testify, nor make
any representation or warranty, express or implied, to the accuracy, contents or data contained within this document. While Angel
One Limited endeavors to update on a reasonable basis the information discussed in this material, there may be regulatory,
compliance, or other reasons that prevent us from doing so.
This document is being supplied to you solely for your information, and its contents, information or data may not be reproduced,
redistributed or passed on, directly or indirectly.
Neither Angel One Limited, nor its directors, employees or affiliates shall be liable for any loss or damage that may arise from or in
connection with the use of this information. Angel or its associates or Research Analyst or his relative might have financial interest
in the subject company. Research analyst has not served as an officer, director or employee of the subject company.
